 Open Access Article
Sample-to-answer acoustic detection of DNA in complex samples†
George
Papadakis‡
 a,
Pasquale
Palladino‡
a,
Dimitra
Chronaki
ab,
Achilleas
Tsortos
a and
Electra
Gizeli
a,
Pasquale
Palladino‡
a,
Dimitra
Chronaki
ab,
Achilleas
Tsortos
a and
Electra
Gizeli
 *ab
*ab
aInstitute of Molecular Biology and Biotechnology-FORTH, 100 N. Plastira Str, Heraklion, 70013, Greece. E-mail: gizeli@imbb.forth.gr
bDept. of Biology, Univ. of Crete, Vassilika Vouton, 71409, Greece
First published on 3rd July 2017
Abstract
The present study demonstrates the sensitive and label-free acoustic detection of dsDNA amplicons produced from whole Salmonella Thyphimurium cells without employing any DNA extraction and/or purification step, in the presence of the lysed bacterial cells and in a hybridization-free assay. A sample-to-answer assay is also shown during DNA detection directly in milk.
Advancements in molecular biology and improvements in fabrication techniques have triggered an explosive growth in molecular diagnostics. One relevant field is the point-of-care (POC), where simple and portable instruments allow diagnostic assays to be performed inexpensively and quickly by untrained personnel directly at the point of need. Of particular importance in the POC testing is nucleic acid analysis in applications such as the detection of foodborne pathogens or diagnosis of infectious diseases. Nucleic acid testing typically involves three major steps: nucleic acid extraction from samples, amplification and detection. Additionally, POC testing is ideally related to a sample-to-answer concept in which nucleic acid amplification and detection is performed within complex real samples in one or two steps and without prior or post purification. Novel mutants of polymerases for DNA amplification in combination with labels and microfluidics have offered sample-to-answer solutions directly from crude samples1,2 that are suitable for POC testing. Most of these solutions are based on optical (fluorescent) or visual, i.e., by naked-eye, detection of the DNA amplicons;3 significant drawbacks related to the former method are the need for lasers and fluorescent probes, which add in the complexity and cost, while the latter suffers from low sensitivity and frequently obtained false results. DNA acoustic sensor technology, employing the quartz crystal microbalance with dissipation monitoring (QCM-D), has emerged as an alternative to optical or visual detection for POC diagnostics.4,5 The QCM-D allows the real-time detection of biomolecule immobilization at solid/liquid interfaces by monitoring simultaneously changes in the mass and viscoelastic properties of the interface; the former is reflected in the frequency change (ΔF) measurement while the latter in the energy dissipation (ΔD). In addition, the acoustic ratio of the energy dissipation per unit mass (ΔD/ΔF), can be used as a quantitative measure of the conformation of surface-attached biomolecules, providing information on their shape and size.6,7 This measurement is also indicative of the way biomolecules are immobilized, discriminating between flat and protruding modes of attachment.8 QCM biosensors have been developed for detecting viruses,9 genetically modified organisms,10 bacteria11 and single nucleotide polymorphisms.12 Recently, a QCM-based method involving the acoustic ratio measurement for the direct detection of double stranded (ds) DNA amplicons without post-PCR purification has been demonstrated to be capable of detecting breast cancer associated mutations5 and plant pathogens13 in pure samples.
In the current work we have evolved and applied the dsDNA acoustic detection methodology, this time in complex samples. Non-specific adsorption of macromolecules represents a main concern for sample-to-answer biosensing where highly concentrated proteinaceous mixtures generate a large background signal potentially hindering the sensitivity of the detection.14,15 One of the most promising strategies for surface coating and protein passivation involves poly(L-lysine)-graft-poly(ethylene glycol) (PLL-g-PEG), where the nucleic acid-attracting region of PLL is the polymer backbone conjugated to the protein-repelling PEG units.15–18 Here we employ a PLL-g-PEG layer on a gold surface and demonstrate for the first time the label-free acoustic detection of DNA amplicons produced from whole Salmonella Thyphimurium cells, without employing any purification step prior to detection. Moreover we show that PLL-g-PEG is suitable for DNA detection from real-life complex samples such as milk.
The copolymers used here, PLL(25)-g-PEG(2) and PLL(25)-g-PEG(5), contain PEG units of 2 kDa and 5 kDa, respectively, covalently bound to a PLL backbone of an average molecular weight of 25 kDa and an average grafting density of 3.5; the polymer adsorption on gold took place from a 0.01% (w/v) solution of each polymer in PBS buffer (pH 7.4, 150 mM NaCl). Acoustic results show that the PLL-g-PEG copolymers can physisorb onto bare gold to form stable films, likely through the electrostatic interaction of the positively charged lysine units with the negatively polarized metal surface; the latter is known from contact angle titration measurements19 showing that the isoelectric point of gold is ∼5.2. Accordingly, the rapid and large adsorption observed at pH 7.2–7.4 for PLL-g-PEG solutions was absent at pH 4.3 (data not shown). In order to obtain information regarding the structural features of the employed copolymers we used the combined QCM-D/Ellipsometer to perform in situ monitoring of the film formation at the gold electrode/liquid interface. In this way both the “dry” (polymer) and “wet” (polymer plus water) mass was obtained and from these two quantities the thickness of the layers was deduced (see ESI† and Table 1).16,17,20,21
| h f (nm) | d f (nm) | Z f (nm) | (ΔD/ΔF)35 (10−6/Hz) | |
|---|---|---|---|---|
| a The indicated range of values incorporates both the experimental scatter and the variance from assuming the film refractive index nf = 1.38–1.42. b The film density ρf = 1.05–1.15 g mL−1. c Calculated with eqn (S1) (see ESI). | ||||
| PLL(25)-g(3.5)-PEG(2) on Au | 3.8 ± 0.9a | 7.2 ± 0.8b | 7.6 ± 0.8c | 0.013 ± 0.002 |
| PLL(25)-g(3.5)-PEG(5) on Au | 2.4 ± 0.7 | 5.1 ± 0.6 | 5.4 ± 0.5 | 0.014 ± 0.002 |
| DNA on PLL(25)-g(3.5)-PEG(2) | 0.65 ± 0.15 | 4.6 ± 0.9 | 5.0 ± 1.0 | 0.036 ± 0.004 |
Since it is well established22 that for PLL-g-PEG polymers the PLL chain lies rather flat on the surface and the PEG side chains extend away from it, we attempted to estimate the height of the protruding PEG chains from data obtained in Table 1. In the case of the PLL-g-PEG(2), given that the measured thickness of the hydrated layer is ZPLL-g-PEG ≈ 7.6 ± 0.8 nm and the thickness of PLL alone lying flat is ∼2 nm,23 this leaves around 5.6 nm for the height of the PEG chains in agreement with published data.24 A comparison to the radius of gyration25Rg ≈ 1.66 nm (indicative of the unperturbed bulk-solution chain dimensions) for the 2 kDa molecule shows that ZPEG > 2Rg suggesting that the chain is in a brush-like conformation rather than a mushroom-like one (Fig. 1). This is exemplified by LPEG ≈ 1.63 nm, the calculated distance between the PEG chains at the surface and the ratio LPEG/2Rg ≈ 0.49 which indicates overlap; this forces neighboring PEG chains to extend away as brushes resulting in a higher than 2Rg thickness.22,26 The same analysis also applies to PLL-g-PEG(5).
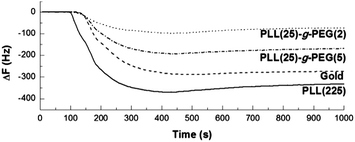
The fouling behaviour of the free and polymer-coated gold surfaces was tested against fetal bovine serum (FBS). Fig. 2 shows the frequency change of a QCM sensor in contact with FBS solution (10% v/v). Since ΔF is directly proportional to the amount of macromolecules deposited on the surface, it is clear that PLL(25)-g-PEG(2) and PLL(25)-g-PEG(5) reduce considerably the non-specific adsorption of FBS solution in comparison with bare gold or just PLL.
 | ||
| Fig. 2 Frequency shift (ΔF) of QCM sensors coated with Au, PLL(225), PLL(25)-g-PEG(2) and PLL(25)-g-PEG(5) upon contact with 50 μL min−1 FBS (10% v/v) in PBS pH 7.4 at 25 °C. | ||
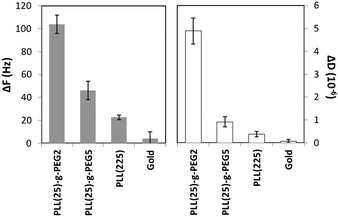
The affinity of the PLL-g-PEG-coated gold surfaces for DNA was initially demonstrated by applying a mixture of double stranded DNA molecules of sizes ranging from 250 bp up to 11.5 kbp to surfaces pre-exposed to 10% (v/v) of FBS (i.e., surfaces shown in Fig. 2). DNA fragments approach the sensor surface due to the electrostatic attraction between the negatively charged phosphate groups (pKa ∼ 2) and the positively charged ε-amino groups (pKa ∼ 11) of the poly-L-lysine moiety, whereas the upper layer of PEG reduces non-specific adsorption of proteins, in agreement with previous findings for similar polymers on niobium, silicon, tantalum, titanium oxide and polymer surfaces.16,27 Based on the ΔF signal, DNA adsorbed to a higher extent on PLL(25)-g-PEG(2) and PLL(25)-g-PEG(5) with respect to PLL, whereas FBS-coated gold displays almost no binding affinity for DNA (Fig. 3); the latter could be explained on the basis of the low affinity of DNA for FBS proteins and/or any negatively polarized metal surface which is still free for binding.14 Furthermore, PLL(25)-g-PEG(2) gives both the lowest adsorption of proteins from FBS solution and the highest ΔF and ΔD for DNA adsorption as shown in Fig. 2 and 3, respectively. For these reasons, the PLL(25)-g-PEG(2) copolymer was further investigated for DNA detection.
 | ||
| Fig. 3 Changes in frequency (ΔF) and dissipation (ΔD) associated to 1.25 μg dsDNA binding in PBS pH 7.4 onto the bare Au sensors and Au covered with PLL, PLL(25)-g-PEG(2) and PLL(25)-g-PEG(5). | ||
To obtain further insight on the structure of the bound DNA on the PLL-g-PEG(2) biofilm, the combined QCM-D/Ellipsometer was used to measure the additional thickness of the adsorbed DNA mixture; the latter was found to be ≈5.0 ± 1.0 nm (Table 1). This is about two and a half times the dsDNA chain diameter (∼2.0 nm) suggesting that chains lie mostly flat, in close proximity to the PEG substrate, with little coiling in the direction vertical to the surface (Fig. 1). This is corroborated by the acoustic ratio ΔD/ΔF measured with QCM-D for the adsorbed DNA molecules; a value of 0.036 (10−6/Hz) is much smaller than the values 0.045–0.120 (10−6/Hz) expected for chains of ∼250–11.5 kbp (equivalent length ∼ 85 nm–4 μm) attached via a single point and in an orientation extending away from the surface.7 Regarding the obtained thickness of our DNA (5.0 nm), we should note that except for lying rather flat,28 DNA is also known to even sink into the underlying soft layer by 1–2 nm29,30 resulting in ∼1–4 nm thicknesses. In some cases, though, it has been suggested that very long DNAs can both intrude into the layer and protrude away coiled-up giving thicknesses of ∼9–12 nm.31–33 All of these studies suggest that DNA adsorption is greatly controlled by the electrostatic interaction and that chains will tend to adopt an adsorption mode that facilitates such an interaction.
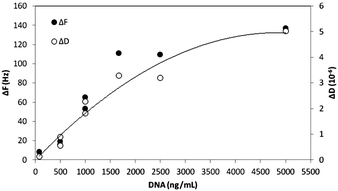
The effect of the DNA concentration on PLL-g-PEG(2) binding was further tested. Purified DNA molecules of 635 bp were produced by PCR and diluted with Tris buffer to final concentrations ranging from 80 ng mL−1 up to 5 μg mL−1. Changes in both ΔF and ΔD increase with the concentration and reach a saturation point at approximately 5 μg mL−1 (Fig. 4). The minimum detectable change, i.e., 9 Hz, is observed with 80 ng mL−1 (121 nM). The acoustic ratio was calculated for each concentration and found to be constant with a value of ∼0.035 ± 0.005 × 10⁻⁶/Hz.
 | ||
| Fig. 4 Changes in frequency shift (ΔF) and dissipation (ΔD) upon binding of various concentrations of purified 635 bp DNA amplicons onto a QCM sensor coated with PLL(25)-g-PEG(2). | ||
In addition, two concentrations (200 ng mL−1 and 600 ng mL−1) of two purified DNA amplicons (635 bp and 195 bp) were loaded on the PLL(25)-g-PEG(2) coated surfaces, as previously. It was observed that both ΔF and ΔD are not dependent on the size of the DNA fragments but only on the concentration used per measurement (data not shown).
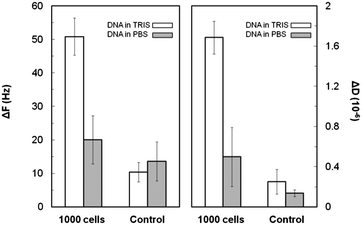
Furthermore, DNA was selectively amplified from Salmonella Thyphimurium cells and, subsequently, detected in the presence of high (PBS) and low (Tris) salt; detection was achieved by flowing the DNA amplification reactions, including the cell lysates, over the PLL(25)-g-PEG(2)-coated sensors. DNA amplicons of 635 bp produced from an initial concentration of 1000 cells were clearly distinguishable from the negative control (i.e., sample without the cells) in Tris through both ΔF and ΔD measurements, but not in PBS (Fig. 5). The limit of detection in Tris buffer was found to be between 100–1000 cells. The acoustic response time during dsDNA binding is less than 10 min as opposed to the longer hybridization times of 30 to 45 min reported earlier.34
Measurements in the low salt Tris buffer resulted in significantly larger acoustic shifts. As discussed above, since one of the dominant forces leading to adsorption is the electrostatic attraction among oppositely charged molecules, the ionic strength of the solution should play an important role. The Debye length KD is a measure of the distance where this attraction is felt; for Tris it is ∼3.0 nm and 0.8 for PBS. The observed difference then suggests a diminished capacity for the positive surface in PBS to attract the long and negatively charged DNA as compared to Tris. This is in agreement with previous studies where a charge-screening effect was demonstrated to hinder the electrostatically driven adsorption of DNA on PLL.17 Regarding the control sample, the frequency response in both cases is very low and close to the detection limit of the method (i.e., 9–11 Hz).
Interestingly, the acoustic ratio in PBS was found to be equal to 0.028 ± 0.006 and 0.010 ± 0.002 for the 1000 cells and control reaction, respectively; this difference is significant and permits the differentiation of the two cases which was not possible by comparing separately the frequency or the dissipation changes.
Finally, to demonstrate the full capability of the method for sample-to-answer applications, DNA was selectively amplified from 1000 Salmonella Thyphimurium cells spiked in a complex mixture of 10% ultra heat treated (UHT) milk in growth medium which is the EU norm for pre-enrichment of Salmonella in dairy samples. The measured ΔD in Tris was 1.9 ± 0.7 (10−6) and 0.5 ± 0.2 (10−6) for the positive and the negative, respectively. Although ΔD and ΔF for the control (negative) were higher compared to these values in Fig. 5, it was still possible to differentiate the positive samples by ΔD or even ΔD/ΔF measurements (ESI†).
Our data suggest that the PLL(25)-g-PEG(2) copolymer is very suitable for the selective immobilization and simultaneous acoustic detection of DNA molecules from complex samples, including milk mixed with broth; the abundant presence of proteins, fat, cells and nutrients makes the detection of DNA in the above medium a real challenge which our methodology can clearly address. The applied copolymer or similar ones were previously investigated with other techniques such as XPS, AFM or ellipsometry16,17 but have never been used with acoustic sensors for DNA detection. In fact, previous reports regarding QCM-based DNA biosensors have mostly relied on DNA hybridization and in addition required either DNA isolation before amplification or post-amplification purification and denaturation.11 Recent work reporting the direct immobilization and detection of dsDNA after PCR amplification4,5 was also based on the use of isolated DNA templates and not in the presence of a biologically rich sample. Moreover, our results further highlight the analytical flexibility offered by acoustic biosensors, since changes in mass and conformation can be advantageously monitored through frequency and acoustic ratio measurements, respectively,6,7 and be selectively applied to specific analyte detection.4,5,13
For the future development of integrated Lab-on-a-Chip (LOC) platforms, the use of the Love wave SAW-type sensors may be more suitable than the QCM crystals, especially given the fact that SAW devices can be effectively integrated with microfluidics.35 For this reason, we also employed a 155 MHz SAW sensor and performed acoustic measurements of DNA amplicons in the presence of cell lysates. The results showed that as low as 250 Salmonella cells can be detected using the PLL-g-PEG(2) polymer in low salt solutions (data not shown). Furthermore, the PLL-g-PEG solution is stable at room temperature compared to proteins (e.g. streptavidin) and can be spin-coated for surface pre-functionalization (data not shown) both representing significant advantages from a commercialization point of view. Overall, the presented approach holds promise for further applications of acoustic biosensors in molecular diagnostics and integrated LOC analysis.
The financial support by EC Horizon2020 (No. 687681, LoveFood2Market) is acknowledged. We thank Ms M. Megariti for performing the DNA amplification reactions and Dr B. Dupuy (Pasteur Inst., France) for providing Salmonella cells.
References
- W. Lu, J. Wang, Q. Wu, J. Sun, Y. Chen, L. Zhang, C. Zheng, W. Gao, Y. Liu and X. Jiang, Biosens. Bioelectron., 2016, 75, 28–33 CrossRef CAS PubMed.
- Z. Zhang, M. B. Kermekchiev and W. M. Barnes, J. Mol. Diagn., 2010, 12, 152–161 CrossRef CAS PubMed.
- K. D. Senarath, R. B. Usgodaarachchi, V. Navaratne, A. Nagahawatte, C. D. Wijayarathna, J. Alvitigala and C. L. Goonasekara, J. Tuberc. Res., 2014, 2, 168–172 CrossRef.
- G. Papadakis, A. Tsortos, A. Kordas, I. Tiniakou, E. Morou, J. Vontas, D. Kardassis and E. Gizeli, Sci. Rep., 2013, 3, 2033 CrossRef CAS PubMed.
- G. Papadakis and E. Gizeli, Anal. Methods, 2014, 6, 363–371 RSC.
- A. Tsortos, G. Papadakis, K. Mitsakakis, K. Melzak and E. Gizeli, Biophys. J., 2008, 94(7), 2706–2715 CrossRef CAS PubMed.
- A. Tsortos, G. Papadakis and E. Gizeli, Anal. Chem., 2016, 88, 6472–6478 CrossRef CAS PubMed.
- D. Milioni, A. Tsortos, M. Velez and E. Gizeli, Anal. Chem., 2017, 89, 4198–4203 CrossRef CAS PubMed.
- S.-R. Honga, H.-D. Jeongb and S. Honga, Talanta, 2010, 82, 899–903 CrossRef PubMed.
- I. Mannelli, M. Minunni, S. Tombelli and M. Mascini, Biosens. Bioelectron., 2003, 18, 129–140 CrossRef CAS PubMed.
- J. Cai, C. Yaoa, J. Xiab, J. Wanga, M. Chenb, J. Huanga, K. Changb, C. Liua, H. Pana and W. Fua, Sens. Actuators, B, 2011, 155, 500–504 CrossRef CAS.
- G. Papadakis, A. Tsortos, F. Bender, E. E. Ferapontova and E. Gizeli, Anal. Chem., 2012, 84, 1854–1861 CrossRef CAS PubMed.
- G. Papadakis, N. Skandalis, A. Dimopoulou, P. Glynos and E. Gizeli, PLoS One, 2015, 10, e0132773 Search PubMed.
- S. Sheikh, D. Y. Yang, C. Blaszykowskia and M. Thompson, Chem. Commun., 2012, 48, 1305–1307 RSC.
- C. Blaszykowski, S. Sheikh and M. Thompson, Chem. Soc. Rev., 2012, 41, 5599–5612 RSC.
- G. L. Kenausis, J. Voros, D. L. Elbert, N. Huang, R. Hofer, L. Ruiz-Taylor, M. Textor, J. A. Hubbell and N. D. Spencer, J. Phys. Chem. B, 2000, 104, 3298–3309 CrossRef CAS.
- R. Schlapak, D. Armitage, N. Saucedo-Zeni, W. Chrzanowski, M. de Hohage, D. Caruana and S. Howorka, Soft Matter, 2009, 5, 613–621 RSC.
- N.-P. Huang, R. Michel, J. Voros, M. Textor, R. Hofer, A. Rossi, D. L. Elbert, J. A. Hubbell and N. D. Spencer, Langmuir, 2001, 17, 489–498 CrossRef CAS.
- M. F. Cuddy, A. R. Poda and L. N. Brantley, ACS Appl. Mater. Interfaces, 2013, 5, 3514–3518 CAS.
- I. Carton, A. R. Brisson and R. P. Richter, Anal. Chem., 2010, 82(22), 9275–9281 CrossRef CAS PubMed.
- E. Guzmán, F. Ortega, M. G. Prolongo, V. M. Starovc and R. G. Rubio, Phys. Chem. Chem. Phys., 2011, 13, 16416–16423 RSC.
- S. Pasche, S. M. De Paul, J. Vörös, N. D. Spencer and M. Textor, Langmuir, 2003, 19(22), 9216–9225 CrossRef CAS.
- H. J. Lee, A. W. Wark and R. M. Corn, J. Phys.: Condens. Matter, 2007, 19, 375107 CrossRef.
- S. S. Perry, X. Yan, F. T. Limpoco, S. Lee, M. Müller and N. D. Spencer, ACS Appl. Mater. Interfaces, 2009, 1(6), 1224–1230 CAS.
- S. Kawaguchi, G. Imai, J. Suzuki, A. Miyahara, T. Kitano and K. Ito, Polymer, 1997, 38(12), 2885–2891 CrossRef CAS.
- S. J. Sofia, V. Premnath and E. W. Merrill, Macromolecules, 1998, 31(15), 5059–5070 CrossRef CAS PubMed.
- R. Marie, J. P. Beech, J. Voros, J. O. Tegenfeldt and F. Hook, Langmuir, 2006, 22, 10103–10108 CrossRef CAS PubMed.
- R. Pei, X. Cui, X. Yang and E. Wang, Biomacromolecules, 2001, 2(2), 463–468 CrossRef CAS PubMed.
- S. M. De Paul, D. Falconnet, S. Pasche, M. Textor and A. P. Abel, et al. , Anal. Chem., 2005, 77(18), 5831–5838 CrossRef CAS PubMed.
- C. Douarche, R. Cortes, S. J. Roser, J.-L. Sikorav and A. Braslau, J. Phys. Chem. B, 2008, 112(44), 13676–13679 CrossRef CAS PubMed.
- A. Naboka, A. Tsargorodskaya, F. Davis and S. P. J. Higson, Biosens. Bioelectron., 2007, 23(3), 377–383 CrossRef PubMed.
- J. Wang, X. Xu, Z. Zhang, F. Yang and X. Yang, Anal. Chem., 2009, 81(12), 4914–4921 CrossRef CAS PubMed.
- X. B. Zhao, F. Pan, P. Coffey and J. R. Lu, Langmuir, 2008, 24, 13556–13564 CrossRef CAS PubMed.
- R. Y. Lai, E. T. Lagally, S.-H. Lee, H. T. Soh, K. W. Plaxco and A. J. Heeger, Proc. Natl. Acad. Sci. U. S. A., 2006, 103, 4017–4021 CrossRef CAS PubMed.
- K. Mitsakakis and E. Gizeli, Biosens. Bioelectron., 2011, 26(11), 4579–4584 CrossRef CAS PubMed.
Footnotes |
| † Electronic supplementary information (ESI) available. See DOI: 10.1039/c6cc10175e |
| ‡ Equally contributing authors. |
| This journal is © The Royal Society of Chemistry 2017 |


