Should analytical chemists (and their customers) trust the normal distribution?
Michael
Thompson
School of Biological and Chemical Sciences, Birkbeck University of London, Malet Street, London WC1E 7HX, UK. E-mail: m.thompson@bbk.ac.uk
Abstract
The normal distribution, under its popular name ‘the bell curve’, has attracted adverse criticism in recent years, owing mainly to being prominently featured in some well-publicised books on socio-economic topics. A number of conclusions in these fields, ranging from questionable to spectacularly incorrect, have been drawn from an ill-considered use of the bell curve as a statistical tool. Those application sectors do not directly impinge on chemical measurement but the toxic fallout has been widespread and likely to bias the reading public against inferences based on the normal distribution. It is therefore essential that analytical chemists should be able to recognise appropriate and inappropriate uses of the normal distribution and to defend their decisions adequately when working alongside those unfamiliar with measurement and statistics.
The general reading public had the normal distribution thrust upon them with the publication in 1994 of a notorious book, The Bell Curve: Intelligence and Class Structure in American Life.1 This book attracted an influential and well-publicised backlash from the large number of people, some famous, who were offended by its subject matter. Largely because it featured prominently in the title, the normal distribution as such was blamed for some contentious conclusions.
More recently, a best-selling book, The Black Swan,2 largely about econometrics, appeared to heap indiscriminate scorn on the bell curve. Chapter 15, for instance, is entitled The Bell Curve, That Great Intellectual Fraud, and the foreword begins ‘Forget everything you heard in college statistics or probability theory’. The trouble with this lurid kind of writing is that it engenders a widespread and broadly-targeted scorn for the normal distribution in general, not just where it is misapplied.
As an outcome of this publicity the normal distribution, as a basis for inference, has become broadly suspect—indeed you might almost say politically incorrect—in the minds of a substantial proportion of the population. That’s not likely to affect analytical chemists directly, but it could have a pernicious effect upon end-users of analytical data who are not statistically-minded—manufacturers, health workers, enforcement agencies, lawyers, politicians—by undermining their confidence in inferences based on the normal distribution and thereby laying sound decisions open to undue criticism.
Analytical chemists are most likely to be concerned with the application of the normal distribution to variation in the measurement process itself. Chemical measurement is nearly always undertaken to inform a decision such as “should we take action on this possible non-compliance?”. We need to ask whether inferences supporting such a decision are sound and that, of course, depends amongst other things on whether the normal distribution is both appropriate and correctly used. The answer depends to a degree on the conditions under which replicated measurements are made. Different conditions of replication—repeatability, run-to-run, and reproducibility—have to be considered separately, as shown below (see also AMC Technical Briefs no. 70 (ref. 3)).
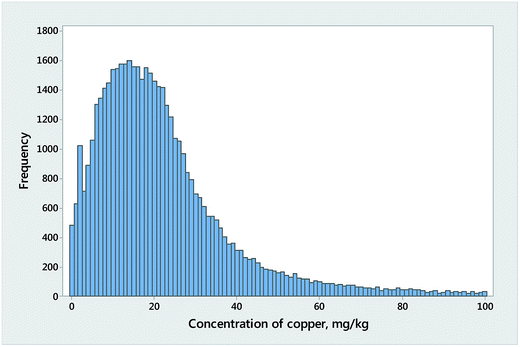
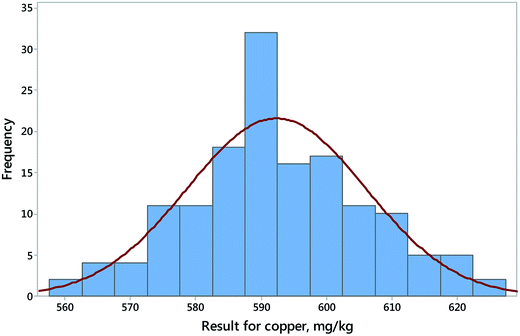
In addition, but crucially, variation in replicate measurements on a single object must be sharply distinguished from variation in composition among different objects of the same type. For instance, Fig. 1 shows the variation of the measured results for copper in a single sediment reference material analysed in 158 successive runs of a procedure in one laboratory. The distribution does not differ significantly from the normal distribution. Fig. 2 shows in contrast the results for copper obtained from the analysis of 49![[thin space (1/6-em)]](https://www.rsc.org/images/entities/char_2009.gif) 305 different samples of stream sediment, a distribution that deviates grossly from a normal distribution (and, for those who might be wondering, it also deviates grossly from a lognormal distribution!). This strongly skewed behaviour is often observed in distributions of concentration of trace constituents in collections of objects of the same kind.
305 different samples of stream sediment, a distribution that deviates grossly from a normal distribution (and, for those who might be wondering, it also deviates grossly from a lognormal distribution!). This strongly skewed behaviour is often observed in distributions of concentration of trace constituents in collections of objects of the same kind.
 | ||
Fig. 2 Results for copper in 49![[thin space (1/6-em)]](https://www.rsc.org/images/entities/char_2009.gif) 305 samples of sediment, taken at an average density of one per square mile, from the whole of England and Wales. Results above 100 mg kg−1 not shown. 305 samples of sediment, taken at an average density of one per square mile, from the whole of England and Wales. Results above 100 mg kg−1 not shown. | ||
Replication under repeatability conditions
Simply repeating a complete chemical measurement a large number of times would seem likely to give rise to a normal curve. After all, a result stems from a number of sequential actions—re-homogenising the test sample, weighing a test portion, addition of reagents, heating, dilution, comparison with standards, et cetera—each of which should introduce only a tiny error. Most of these errors will be independent and so small that, for the eventual result, a detectable deviation from the normal curve is unlikely. Repeatability conditions by definition (VIM3 §2.20) exclude any change—of analyst, instrument, reagent batch, laboratory environment and so forth—that could generate systematic effects, that is, drifts or abrupt jumps in the analytical signal that would give rise to a non-normal outcome. However, it is usually impossible to test this normality precept directly under repeatability conditions because the very definition means that you can produce only a few results in the requisite ‘short period of time’. Attempts to overcome this problem by combining a large number of short repeatability runs are doomed to failure.For analysts perhaps the most familiar encounter with the normal assumption under repeatability conditions is in finding confidence limits for a mean of several results (and related calculations such as p-values for significance tests) via the t-distribution. This usage comes about in questions such as ‘does this instrument need recalibration?’, ‘are my results biased?’ or ‘does this driver show a prohibited level of ethanol?’. Here we are on much firmer ground, because means derived from non-normal distributions (unless they are really weird) will tend towards the normal, even when based on small numbers of observations. Even so, we should be wary of over-interpreting small probabilities in the tails of the normal distribution. The purpose of significance testing is to warn us against making unsound inferences, not to calculate tiny probabilities from insufficient data. So with four results, 95% confidence limits, or p-values down to about 0.05, will be fairly safe. A p-value lower than 0.01, however, should be regarded as providing no better than order-of-magnitude indications of probability, if that. (And, of course, you have to remember what p-values mean exactly, but that’s another story!).
Replication under run-to-run (VIM3 ‘intermediate’) conditions
Run-to-run conditions are encountered in chemical measurement mostly as the outcome of internal quality control (IQC) activities in routine analysis. (A ‘run’ is a sequence of measurements during which repeatability conditions are taken to prevail. IQC typically involves a series of sequential runs). In IQC, results on a surrogate test material analysed in each run are plotted on a Shewhart or other-type control chart and judged according to the familiar rules. Outliers or persistent trends give rise to out-of-control warnings and actions. This interpretation is based on the presumption of the normal distribution. When non-compliant runs are excluded, the remaining runs are likely to conform well to the normal distribution (Fig. 1). Of course there is no guarantee that IQC data in general will conform in this way but, should that be in doubt, a normality test or even a simple histogram with a fitted normal distribution will give a useful indication.Replication under reproducibility conditions
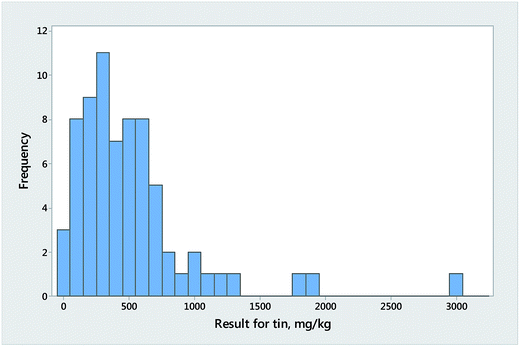
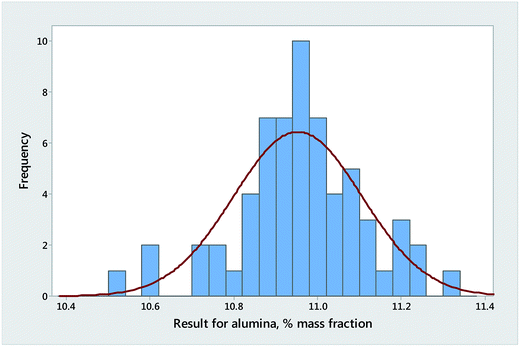
Reproducibility (interlaboratory) conditions are encountered in collaborative trials (one-off interlaboratory experiments with a strictly-defined analytical procedure) and proficiency tests (regular, larger interlaboratory studies but with no fixed measurement principle). Collaborative trials are statistically too small for the general question of normality to be resolved, although outlier exclusion is routine. Proficiency tests are complicated by the combination of results from different analytical methods, which in bad instances can give rise to skewed (Fig. 3), broad-peaked, or even bimodal distributions. Typically, however, proficiency tests produce (outliers aside) roughly symmetrical distributions that are more ‘peaky’ and heavily-tailed than the corresponding normal distributions (Fig. 4).The proficiency test provider must cope with this variety of outcomes using experience and judgement in the selection of the statistical tools best suited to find a consensus, which may be a median, robust mean or mode. Accredited proficiency testing schemes, of course, will have access to statistical experts who can make the appropriate decisions and defend their choices. For participants in a proficiency test, however, the question of normality of the results does not arise—the interpretation of z-scores does not depend on an assumption that the participants’ results in a round follow the normal distribution (see AMC Technical Briefs no. 74 (ref. 4)).
Conclusions
It is likely that analytical results collected under repeatability or run-to-run (VIM3 ‘intermediate’) conditions will be—outliers aside—close to normally distributed. While empirical evidence for this is largely lacking, there are no a priori grounds for challenging the assumption. In the consideration of means of several results, the distribution will tend towards the normal even when the parent distribution deviates considerably. Thus simple significance tests of the mean are likely to lead to valid inferences, although no great weight should be placed on the exact value of small probabilities. Results collected under reproducibility conditions often clearly deviate from the normal and sometimes also from symmetry, so each instance should be considered individually.In some statistical applications to chemical measurement it may be necessary to test for deviation from normality, and AMC Technical Briefs no. 82 (ref. 5) in this issue of Analytical Methods provides an account of the available methods.
References
- R. J. Herrnstein and C. Murray, The Bell Curve: Intelligence and Class Structure in American Life, Simon & Schuster Ltd, 1996, ISBN: 978–0684824291 Search PubMed.
- N. N. Taleb, The Black Swan: The Impact of the Highly Improbable, Penguin, 2008, ISBN: 978–0141034591 Search PubMed.
- Analytical Methods Committee, Anal. Methods, 2015, 7, 8508–8510 RSC.
- Analytical Methods Committee, Anal. Methods, 2016, 8, 5553–5555 RSC.
- Analytical Methods Committee, Anal. Methods, 2017 10.1039/c7ay90126g.
| This journal is © The Royal Society of Chemistry 2017 |


