 Open Access Article
Creative Commons Attribution 3.0 Unported Licence
A one-step rapid screening test of Listeria monocytogenes in food samples using a real-time loop-mediated isothermal amplification turbidity assay
Sirirat
Wachiralurpan
a,
Thayat
Sriyapai
b,
Supatra
Areekit
c,
Pichapak
Sriyapai
d,
Dueantem
Thongphueak
a,
Somchai
Santiwatanakul
e and
Kosum
Chansiri
 *a
*a
aDepartment of Biochemistry, Faculty of Medicine, Srinakharinwirot University, Sukhumvit 23, Bangkok 10110, Thailand. E-mail: kchansiri@yahoo.com
bFaculty of Environmental Culture and Ecotourism, Srinakharinwirot University, Sukhumvit 23, Bangkok 10110, Thailand
cInnovative Learning Center, Srinakharinwirot University, Sukhumvit 23, Bangkok 10110, Thailand
dDepartment of Biology, Faculty of Science, Srinakharinwirot University, Sukhumvit 23, Bangkok 10110, Thailand
eDepartment of Pathology, Faculty of Medicine, Srinakharinwirot University, Sukhumvit 23, Bangkok 10110, Thailand
First published on 9th November 2017
Abstract
A rapid and specific, hly-based, loop-mediated isothermal amplification (LAMP) was applied for the detection of Listeria monocytogenes in food and food products, using a real-time turbidimeter platform (LAMP-turbidity). The principle behind this method relies on an increase in a DNA yield, which correlates with the production of magnesium pyrophosphate, and the results can be determined via an amplification curve within 1 h. The specificity test revealed that L. monocytogenes (DMST 17303) was observed from 34.1 to 38.3 min, while thirty strains of non-L. monocytogenes demonstrated no cross-reactions. The limits of detection for purified genomic DNA and pure culture were 800 pg μL−1 and 2.82 × 10³ CFU mL−1, respectively. Investigation on 200 raw chicken meat samples indicated that the specificity, sensitivity, and accuracy of LAMP-turbidity were 100%, 62.75%, and 90.50%, respectively. These data suggest that an hly-based, real-time, quantitative LAMP-turbidity assay can be an applicable tool for the epidemiological screening of L. monocytogenes in food and food products.
1. Introduction
Listeria monocytogenes (L. monocytogenes) is an important food-borne pathogen that is found in raw and processed foods. Currently, there is increasing demand for ready-to-eat (RTE) foods, which are possible sources of Listeria infection.1 Thus far, at least seven different species of the genus Listeria have been reported in the food industry.2 Among them, three Listeria species, including L. monocytogenes, Listeria ivanovii, and Listeria innocua, are pathogenic. L. monocytogenes, which is a major Gram-positive food-borne pathogen in both human beings and animals, has already raised great concerns in several countries as a cause of meningitis, neonatal listeriosis, septicemia, and abortion of infected fetuses.3 Although the occurrence of listeriosis is quite low, the hospitalization and fatality rates are high, at 94% and 12.8–17%, respectively.4 Traditional culture-based methods for isolating and enumerating L. monocytogenes from raw food samples generally involve the most probable number (MPN) technique. Although widely used, these methods involve labor-intensive steps and are very time-consuming (4–7 days). Some rapid detection methods for L. monocytogenes,5,6 such as multiplex polymerase chain reaction (PCR) assay,7 involve gel electrophoresis for analysis of PCR amplicons, which is tedious and time-consuming. Real-time PCR assays have been developed for the detection of L. monocytogenes, allowing for increased speed and sensitivity.8 Nonetheless, these assays require a dedicated real-time PCR machine, which is rather expensive and complicated. Alternatively, a lateral flow, dipstick-based immunoassay has been developed and is available but results in a cross-reaction that may yield false-positive results.1,9 These methods can achieve a high specificity and a low minimum detection limit for the detection of L. monocytogenes, but some of them may still produce false-positive results.1 Therefore, the development of fast and specific detection approaches that enable the identification of food-borne pathogens is necessary.Loop-mediated isothermal amplification (LAMP) has been applied for the detection and identification of many bacterial and viral agents.10,11 The main advantages of the LAMP assay are the use of isothermal amplification and that no special apparatus is needed. A regular laboratory water bath or heating block is adequate for generating the single temperature needed for the synthesis of a large amount of DNA. In the LAMP reaction, a large amount of pyrophosphate ion by-product binds to magnesium ions, forming a white precipitate of magnesium pyrophosphate. This results in turbidity that increases in correlation with the DNA yield and can be quantified by a real-time measurement of turbidity.12
For gene-based detection, hly gene encoding for listeriolysin O (LLO) toxin is unique and is present as a single copy gene in genome of pathogenic for L. monocytogenes. The LLO toxin is necessary for virulence that shows LLO activity on blood agar and is used for species identification.13
Herein, the unique hly gene has been employed in the primer design to detect the presence of L. monocytogenes, using a real-time LAMP-turbidity platform. The limit of detection, sensitivity, specificity, and accuracy were investigated in comparison to standard culture and PCR methods.
2. Materials and methods
2.1. Bacterial isolates and culture conditions
A total of 35 bacterial isolates (Table 1) were obtained from the Department of Medical Science, the Ministry of Public Health, Thailand (DMST), the Department of Pathology, the Faculty of Medicine, Srinakharinwirot University, HRH Princess Maha Chakri Sirindhorn Medical Center, Thailand (DPSWU), and the Department of Biology, the Faculty of Science, Srinakharinwirot University, Thailand (DBSWU). These bacterial isolates were used for LAMP assay specificity tests. L. monocytogenes (DMST 17303) was used as the positive control in each test involving the sensitivity of LAMP and PCR.| Bacterial isolate | Source |
|---|---|
| Listeria monocytogenes (n = 5) | |
| L. monocytogenes DMST 17303 | DMST |
| L. monocytogenes DMST 20093 | DMST |
| L. monocytogenes DMST 21164 | DMST |
| L. monocytogenes DMST 23145 | DMST |
| L. monocytogenes DMST 31802 | DMST |
![[thin space (1/6-em)]](https://www.rsc.org/images/entities/char_2009.gif) |
|
| Non-Listeria monocytogenes (n = 3) | |
| L. innocua DMST 9011 | DMST |
| L. ivanovii DMST 9012 | DMST |
| L. welshimeri DMST 20559 | DMST |
![[thin space (1/6-em)]](https://www.rsc.org/images/entities/char_2009.gif) |
|
| Non-Listeria strains (n = 27) | |
| Salmonella serovar (n = 10) | |
| S. typhimurium | DMST |
| S. enteritidis | DMST |
| S. stanley | DMST |
| S. agona | DMST |
| S. rissen | DMST |
| S. anatum | DMST |
| S. kedougou | DMST |
| S. paratyphi A | DMST |
| S. weltevreden | DMST |
| S. typhi | DMST |
| Shigella species (n = 4) | |
| S. boydii | DMST |
| S. flexneri | DMST |
| S. sonnei | DMST |
| S. dysenteriae | DMST |
| Campylobacter species (n = 4) | |
| C. jejuni ATCC 33291 | DMST |
| C. coli NCTC 11353 | DMST |
| C. lari ATCC 43675 | DMST |
| C. fetus ATCC 27374 | DMST |
| Escherichia coli ATCC 25922 | DPSWU |
| Bacillus cereus | DBSWU |
| Staphylococcus aureus ATCC 25923 | DPSWU |
| Pseudomonas aeruginosa ATCC 27853 | DPSWU |
| Micrococcus luteus | DBSWU |
| Citrobacter diversus | DBSWU |
| Serratia marcescens | DBSWU |
| Enterobacter aerogenes | DBSWU |
| Klebsiella oxytoca | DBSWU |
The cultures of the aforementioned isolates were grown overnight in brain heart infusion (BHI) broth (BBL, Becton Dickinson Microbiology Systems, Cockeysville, MD, USA) at 37 °C.
2.2. DNA extraction
DNA was extracted from an overnight culture of the organism. Briefly, bacterial cells were pelleted by centrifugation at 13![[thin space (1/6-em)]](https://www.rsc.org/images/entities/char_2009.gif) 000 rpm for 5 min and were re-suspended in 100 μL of sterile, deionized, nanopure water. Then, 100 μL of the suspension was heated at 100 °C for 10 min to extract DNA. After centrifugation at 13
000 rpm for 5 min and were re-suspended in 100 μL of sterile, deionized, nanopure water. Then, 100 μL of the suspension was heated at 100 °C for 10 min to extract DNA. After centrifugation at 13![[thin space (1/6-em)]](https://www.rsc.org/images/entities/char_2009.gif) 000 rpm for 1 min, the supernatant was saved for use as the DNA template.
000 rpm for 1 min, the supernatant was saved for use as the DNA template.
2.3. Primer design
The nucleotide sequences of L. monocytogenes listeriolysin O (hly [accession number HE999704]) were retrieved from GenBank. LAMP primers were designed through the Primer Explorer program (version 4; Fujitsu Limited, Tokyo, Japan). A set of four LAMP primers, including two inner primers (forward inner primer [FIP] and backward inner primer [BIP]) and two outer primers (F3 and B3) that recognized six distinct consensus regions of the target gene sequence, was used. The hly gene sequences of 12 L. monocytogenes serotypes (GenBank Accession numbers: FR733647, FR733646, FR733648, FR733650, FR733645, FR733649, FM211688, FR733642, FR733651, FR733643, FR733644, and FR720325) were aligned using the Clustal Omega program (http://www.ebi.ac.uk/Tools/msa/clustalo/). All primers were patented (Petty patent submission number 1601004755) and synthesized by Bio Basic Inc., Canada.2.4. Real-time quantitative LAMP reaction
The LAMP reaction mixture (25 μL) consisted of 1× ThermoPol reaction buffer (New England Biolabs, USA), 5.6 mM MgSO4 (New England Biolabs, USA), 1.6 mM dNTPs (New England Biolabs, USA), 0.5 M Betaine (Sigma-Aldrich, USA), 2 μM LAMP inner primers (LmHly FIP and LmHly BIP), 0.2 μM LAMP outer primers (LmHly-F3 and LmHly-B3), 8U of Bst DNA polymerase (New England Biolabs, USA), and 2 μL of DNA template.One positive control and one negative control were included in each LAMP run. The LAMP reaction mixtures were heated at 60 ± 2 °C for 60 min in a real-time LAMP turbidimeter (Mobilis Automata Co., Ltd., Thailand). Turbidity readings at 650 nm were obtained every second, and the time threshold (Tt; in min) was determined when turbidity measurements increased (differential values of moving averages of turbidity). After 60 min, aliquots (3 μL) of the LAMP products were electrophoresed on a 2% agarose gel (AGE) for 60 min at 80 volts. A negative control reaction was performed using sterile, deionized, nanopure water instead of the DNA template.
2.5. PCR reaction
To compare the specificity of the LAMP assay, a conventional PCR assay was performed using LAMP outer primers. The PCR reagent mixture (25 μL) contained 1× supplied buffer, 1.0 mM MgCl2 (Vivantis, Malaysia), 0.2 mM dNTPs, 0.3 μM LAMP outer primers, 5U of Taq DNA polymerase (Vivantis, Malaysia), and 2 μL of template DNA. The assay was conducted through an initial denaturation at 95 °C for 5 min, followed by 35 cycles of denaturation at 95 °C for 30 s, primer annealing at 50 °C for 30 s, extension at 72 °C for 30 s, and post-extension at 72 °C for 10 min in a C1000™ Thermal Cycler (Bio-Rad, USA). The PCR products were analyzed via 2% agarose gel electrophoresis.2.6. LAMP specificity and sensitivity
DNA templates of the 30 bacterial isolates (Table 1) were prepared by heating at 100 °C for 10 min, as described previously. Aliquots (2 μL) of each template were subjected to the LAMP assay.LAMP sensitivity (the limit of detection) was determined by performing 10-fold serial dilutions of pure culture and purified genomic DNA of L. monocytogenes (DMST 17303). Aliquots (2 μL) of each template were tested via both LAMP and PCR assays, and repeated three times each.
2.7. Real-time turbidity detection in raw food samples
200 raw chicken meat samples were randomly purchased from local delicatessens in Bangkok, Thailand. Twenty-five gram test portions of the raw chicken meat samples were placed in sterile filter bags (BagFilter®, Interscience, France) containing 225 mL of deionized, ultrapure water (sterile). The bagged samples were crushed and homogenized. The solution was then collected, followed by a 5 min centrifugation to pellet bacterial cells. After removing the supernatants, pellets were resuspended in 2 mL of deionized, ultrapure water (sterile). Aliquots (1 mL) of the mixtures were heated at 100 °C for 10 min and centrifuged again at 13![[thin space (1/6-em)]](https://www.rsc.org/images/entities/char_2009.gif) 000 rpm for 1 min. Two microliters of the sample DNA extracts were subjected to both LAMP and PCR assays, which were repeated in triplicate. The suspended samples (1 mL) were identified as L. monocytogenes using the method outlined by the Bacteriological Analytical Manual (BAM) of the Food and Drug Administration (FDA).14 Briefly, the Listeria enriched sample in selective medium broth was plated on Chromogenic agar. The positive colony was selected, isolated and identified by using Gram staining test, CAMP test on sheep blood agar, catalase test, motility test and biochemical test.
000 rpm for 1 min. Two microliters of the sample DNA extracts were subjected to both LAMP and PCR assays, which were repeated in triplicate. The suspended samples (1 mL) were identified as L. monocytogenes using the method outlined by the Bacteriological Analytical Manual (BAM) of the Food and Drug Administration (FDA).14 Briefly, the Listeria enriched sample in selective medium broth was plated on Chromogenic agar. The positive colony was selected, isolated and identified by using Gram staining test, CAMP test on sheep blood agar, catalase test, motility test and biochemical test.
2.8. Data analysis
Turbidity profiles were recorded by using the LAMP-turbidity Plotter-MEMS LAB-NECTEC program on the monitor of a real-AMP turbidimeter. Means and standard deviations of Tt (time threshold for the real-time turbidimeter platform) for LAMP were calculated in Microsoft Excel (Microsoft, Seattle, WA). The detection limits were repeated three times and presented as the lowest DNA concentrations or lowest number of specific L. monocytogenes (DMST 17303) cells that could be detected by the assay. The statistic sensitivity, specificity, and accuracy of each assay as well as the prevalence of L. monocytogenes in raw chicken meat were calculated against the gold standard method with regard to the MEDCALC® easy-to-use statistical software (https://www.medcalc.org/calc/diagnostic_test.php) for 2 × 2 cross tabulated diagnostic tests15 (Table 2).| Number of reference samples | |||
|---|---|---|---|
| Known positive | Known negative | ||
| Test results | Positive | True positive (TP) | False positive (FP) |
| Negative | True negative (TN) | False negative (FN) | |
| Diagnostic sensitivity TP/(TP + FN) | Diagnostic specificity TN/(TN + FP) | ||
3. Results
3.1. LAMP optimization
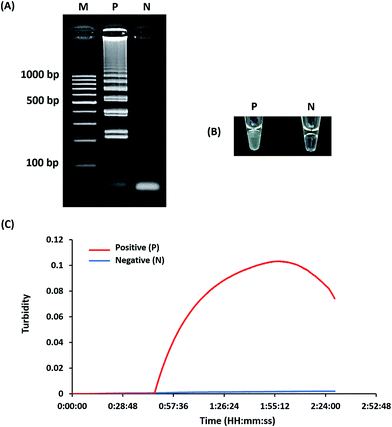
Optimization of LAMP-turbidity was conducted at 60 ± 2 °C for 60 min as a comparative analysis with 2% agarose gel electrophoresis (AGE). A positive LAMP-turbidity reaction was determined from an increase in a white magnesium precipitate generating a turbidity signal, while negative reactions remained clear (Fig. 1A and B). The data also revealed that a 60 min incubation time was sufficient to amplify a small amount of template DNA. This could be observed by the naked eye and via a turbidimeter (Fig. 1C).A white magnesium precipitate was formed in the reaction tube (Fig. 1c) and revealed the typical ladder-like pattern on agarose gel electrophoresis (Fig. 1d), which is a LAMP characteristic.
3.2. LAMP analytical specificity
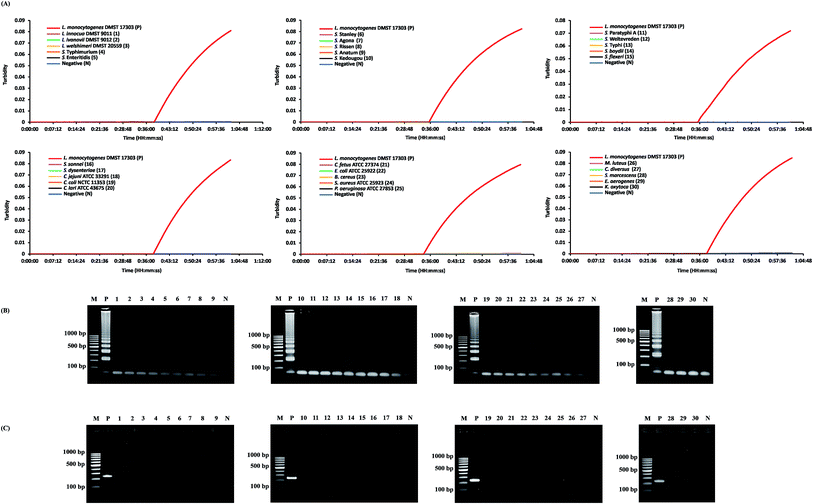
The specificity of the real-time hly-based LAMP-turbidity assay was determined by using L. monocytogenes (DMST 17303) and 30 non-L. monocytogenes strains as the positive and negative controls, respectively. The data indicated that the turbidity signal of L. monocytogenes (DMST 17303) was detectable from 34.1 to 38.3 min (Table 1). The signal was absent in other Listeria species (L. innocua DMST 9011, L. ivanovii DMST 9012, L. welshimeri DMST 20559) and non-Listeria spp. (Salmonella spp., Shigella spp., Campylobacter spp., Escherichia coli ATCC 25922, Bacillus cereus, Staphylococcus aureus ATCC 25923, Pseudomonas aeruginosa ATCC 27853, Micrococcus luteus, Citrobacter diversus, Serratia marcescens, Enterobacter aerogenes, and Klebsiella oxytoca). The data were then correlated with those of LAMP and PCR (Fig. 2).3.3. LAMP analytical sensitivity
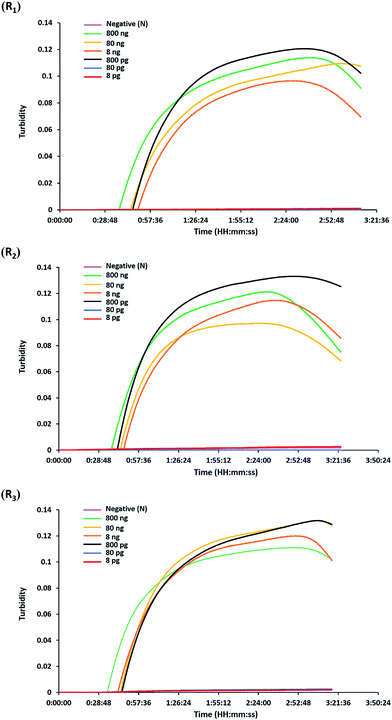
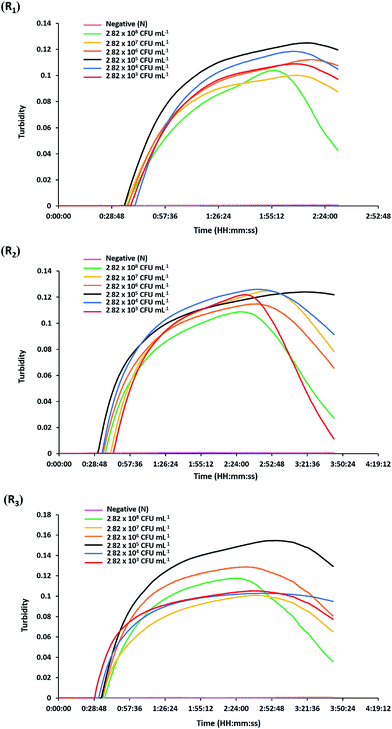
The analytical sensitivity or detection limit of the hly-based LAMP-turbidity assay was determined through using 10-fold serial dilutions of L. monocytogenes (DMST 17303) template DNA and pure culture. The test revealed that the maximum Tt values for detection of minimum purified DNA and culture were 46.0 and 37.3 min, corresponding to 800 pg and 2.82 × 10³ CFU mL−1, respectively (Fig. 3 and 4). No turbidity signal was detected for the negative control.3.4. Detection of L. monocytogenes in raw food samples
Direct examination of the 200 raw chicken meat samples (without enrichment) was performed by comparing LAMP-turbidity assay results to conventional PCR and LAMP results. According to this culture technique, 51 samples were positive, while 149 samples were negative. Among the 51 positive L. monocytogenes samples, 32 tested positive utilizing LAMP and LAMP-turbidity, while 36 samples tested positive utilizing PCR (Table 3).| Diagnosis method | No. of positive results/totala | Sensitivity (%) | Specificity (%) | Prevalence (%) | Accuracy (%) | Total time of detection |
|---|---|---|---|---|---|---|
| a The number of samples giving positive results in the diagnosis methods per the total number of positive results from the enrichment culture method as reference. | ||||||
| hly-PCR-AGE | 36/51 | 70.59 | 100 | 25.50 | 92.50 | ∼2.30 h |
| hly-LAMP-AGE | 32/51 | 62.75 | 100 | 25.50 | 90.50 | ∼2 h |
| hly-LAMP-turbidity | 32/51 | 62.75 | 100 | 25.50 | 90.50 | ∼1.00 h |
The diagnostic specificity, sensitivity, accuracy, and detection time of PCR, LAMP and LAMP-turbidity for detection of L. monocytogenes (based on the hly gene) were calculated in comparison to standard culture. The data clearly demonstrated that all tests showed 100% diagnostic specificity. The diagnostic sensitivity of the PCR, LAMP and LAMP-turbidity assays was 70.59%, 62.75% and 62.75%, respectively (Table 3). The accuracy of the PCR, LAMP and LAMP-turbidity assays was 92.50%, 90.50%, and 90.50%, respectively (Table 3). The prevalence of L. monocytogenes in raw chicken meat collected from local markets in Bangkok during the indicated time period was 25.50%. LAMP-turbidity of thirty representative raw food samples were achieved and displayed in Fig. 5.
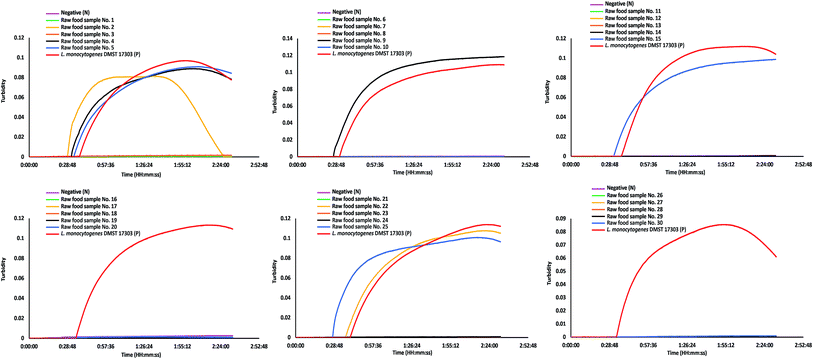 | ||
| Fig. 5 LAMP-turbidity profiles of 30 representative raw food samples. N, negative control (without the DNA template); P, positive control (with the DNA template of L. monocytogenes DMST 17303). | ||
4. Discussion
In this study, a one-step, qualitative, real-time, LAMP-turbidity assay was developed for the detection of L. monocytogenes from purified genomic DNA, in pure culture, and in the raw chicken meat samples. Many studies have evaluated the LAMP assay for large-scale screening of food-borne pathogens such as E. coli O157:H7, Salmonella, Shigella, and Vibrio parahaemolyticus.10,16–18 Generally, amplified products have been evaluated through agarose gel electrophoresis and subsequent staining with ethidium bromide, revealing a ladder pattern of DNA bands under ultraviolet light. However, this assay has several drawbacks, such as the use of highly toxic ethidium bromide, which is hazardous to health and the environment.9 Turbidity analysis of the magnesium pyrophosphate precipitate allowed for persistent monitoring of accumulative DNA synthesis in the LAMP reaction with a single tube.12 Turbidity and dye color changes are normally used to check the progress of the LAMP reaction. Changes in turbidity are mainly due to the white, focal phosphatase precipitate generated during the reaction, but this can be difficult to detect at low levels. A color change is observed after adding calcein and SYBR Green I to the reaction mixture.19,20 Hence, these two methods are employed in analysis to avoid the use of carcinogenic ethidium bromide. However, these dyes require equipment for observing illumination which may be an inconvenience for the user. Hence, LAMP combined with a turbidimeter can be considered as a one-step, qualitative, real-time method that can be manipulated within approximately one hour. Referring to our previous publication, the optimum LAMP was achieved at 60 min.21 As the LAMP reaction progresses, pyrophosphate ions produced from deoxyribonucleotides (dNTPs) bind to magnesium ions and subsequently form a white precipitate of magnesium pyrophosphate.22 The amount of the precipitate can be measured using a real-time turbidimeter, which is more appropriate for monitoring LAMP reactions because it can detect turbidity at low levels and presents no issues with aerosol contamination. In this study, it is noted that the signal and duration of turbidity are the keys of detection. Nevertheless, in certain samples of high DNA concentration or CFU, the turbidity starts to decline after a while. This may affect the excess formation of the magnesium pyrophosphate product which precipitates and settles down to the bottom of the tube after a while.Therefore, this method is more reliable than other similar methods and is recommended for health management applications involving the prevention of food-borne outbreaks. This method is important and necessary to prevent the spread of L. monocytogenes in the food market, decrease mortality rates from human illness, and reduce the economic loss of farms. However, LAMP is less stable than PCR and carries a higher false-positive rate than PCR under a variety of experimental conditions. The cross-amplification of LAMP also produces magnesium pyrophosphate, leading to a false turbidity interpretation.
The hly gene, which encodes listeriolysin O of L. monocytogenes, was employed in the primer design due to its uniqueness, which was key for achieving specificity in the real-time, qualitative LAMP assay. Among 5 isolates of L. monocytogenes, 3 isolates of other Listeria species, and 27 isolates of non-Listeria spp., the one-step, real-time, hly-based LAMP-turbidity assay generated 100% inclusivity and 100% exclusivity. These results suggested that the hly-based LAMP-turbidity assay has both high diagnostic specificity and amplification efficiency. The analytical sensitivity of hly-based PCR was ten times more sensitive than that of hly-based LAMP and real-time LAMP-turbidity. However, LAMP and real-time LAMP-turbidity were rapid when compared to the PCR assay.21 In addition, this closed tube method can minimize the problem of carry-over contamination in less controlled environments and is effective for concurrent testing of several samples.
Considering the direct detection of L. monocytogenes using LAMP-turbidity based on the hly gene without loop primers, the limit of detection was 2.82 × 10³ CFU mL−1 which agrees with that of Shan X and coworkers (2.82 × 10³ CFU mL−1 or 6 CFU per reaction).23 However, the authors noted that the false positive was observed due to the use of loop primers.23 In our experiment, the intensity and length of turbidity are not related to the level of pathogen present. However, the minimum level of L. monocytogenes means that the limit of detection is the lowest quantity of a substance that can be distinguished from its absence. Regarding the limit of detection, hly-LAMP turbidity was almost 3 and 10 times less sensitive than those of Tang M. J. et al. (1.0 × 10³ CFU mL−1 or 2 CFU per reaction)24 and Wang D. et al. (186 CFU mL−1).25
According to Tang M. J. and coworkers, the assay was accomplished by LAMP in the presence of calcein and observation of the calcein–magnesium complex under UV/VIS light encompassing 2 steps of detection.24 Similarly, Wang D. and coworkers also demonstrated the 2-step assay of L. monocytogenes using LAMP of the iap gene and analyzed the LAMP products on agarose gel electrophoresis which involved carcinogenic ethidium bromide in the staining step.25
Referring to BAM of FDA's standard culture method, the 51 out of 200 raw food samples were L. monocytogenes positive. Among them, 32 tested positive utilizing LAMP and LAMP-turbidity, while 36 samples tested positive utilizing PCR. Regarding the hly-LAMP-turbidity of L. monocytogenes in the raw food samples, the diagnostic sensitivity was less than that of hly-PCR. According to our previous publication, the hly-PCR assay was 10 times more sensitive than the hly-LAMP assay.21 It is possible that the 32 samples of both LAMP-turbidity and PCR positive contain bacteria in the range of detection whereas 4 real samples of discrepancy between the two techniques (PCR positive, LAMP negative) may contain the amount of DNA less than the limit of detection of hly-LAMP. However, it was suggested that the pre-enrichment sample prior to the LAMP-turbidity assay can improve the sensitivity of the test. Nevertheless, this may not be suitable for use as a rapid screening test since it is time-consuming. As such, the direct detection of L. monocytogenes using LAMP-turbidity is convenient and easy to manipulate when compared to other assays. Furthermore, this method can be utilized as a point-of-care test since post-amplification analysis is not required. Therefore, this method is suitable for rapid screening of L. monocytogenes in food products and diminishes the risks associated with the consumption of these high-risk foods.
Compliance with ethical standards
Funding
This study was funded by the Thailand Research Fund through the Royal Golden Jubilee Ph.D. Program (Grant No. PHD/0040/2554), the Graduate School of Srinakharinwirot University, and the Agricultural Research Development Agency (public organization), Thailand (No. CRP5705022280).Ethical approval
This article does not contain any studies with human participants or animals performed by any of the authors.Informed consent
Not applicable.Conflicts of interest
Sirirat Wachiralurpan declares that she has no conflict of interest. Thayat Sriyapai declares that he has no conflict of interest. Supatra Areekit declares that she has no conflict of interest. Pichapak Sriyapai declares that she has no conflict of interest. Dueantem Thongphueak declares that she has no conflict of interest. Somchai Santiwatanakul declares that he has no conflict of interest. Kosum Chansiri declares that she has no conflict of interest.Acknowledgements
The research study was supported by the Thailand Research Fund through the Royal Golden Jubilee Ph.D. Program (Grant No. PHD/0040/2554), the Graduate School of Srinakharinwirot University, and the Agricultural Research Development Agency (Public organization) (No. CRP5705022280), Thailand. The authors are grateful to all institutes in Table 1 for kindly providing bacterial species. The authors wish to thank the Pathology Laboratory, the Department of Pathology, the Faculty of Medicine, Srinakharinwirot University, HRH Princess Maha Chakri Sirindhorn Medical Center, Thailand, for their participation in the measurement and analysis of the Bacteriological Analytical Manual (BAM) of the protocol of the Food and Drug Administration (FDA) standard method under the framework of this research. The authors also extend their appreciation to Mrs Arda Pakpitchareon and Mr Pisan Khawsak for technical assistance and the Central Laboratory, the Faculty of Medicine, Srinakharinwirot University, for scientific equipment.References
- A.-L. Välimaa, A. Tilsala-Timisjärvi and E. Virtanen, Food Control, 2015, 55, 103–114 CrossRef
.
- S. Doijad, S. B. Barbuddhe, S. Garg, S. Kalekar, J. Rodrigues, D. D'Costa, S. Bhosle and T. Chakraborty, Food Control, 2011, 22, 1900–1904 CrossRef
.
- J. McLauchlin, R. T. Mitchell, W. J. Smerdon and K. Jewell, Int. J. Food Microbiol., 2004, 92, 15–33 CrossRef CAS PubMed
.
- J. Melo, P. W. Andrew and M. L. Faleiro, Food Res. Int., 2015, 67, 75–90 CrossRef
.
- S. Jadhav, M. Bhave and E. A. Palombo, J. Microbiol. Methods, 2012, 88, 327–341 CrossRef CAS PubMed
.
- D. Liu, J. Med. Microbiol., 2006, 55, 645–659 CrossRef PubMed
.
- G. Amagliani, C. Giammarini, E. Omiccioli, G. Brandi and M. Magnani, Food Control, 2007, 18, 1137–1142 CrossRef CAS
.
- D. Rodriguez-Lazaro, P. Gonzalez-García, A. Gattuso, M. V. Gianfranceschi and M. Hernandez, Int. J. Food Microbiol., 2014, 184, 98–105 CrossRef CAS PubMed
.
- L. A. Rigano, F. Malamud, I. G. Orce, M. P. Filippone, M. R. Marano, A. M. do Amaral, A. P. Castagnaro and A. A. Vojnov, BMC Microbiol., 2014, 14, 86 CrossRef PubMed
.
- Y. Hara-Kudo, M. Yoshino, T. Kojima and M. Ikedo, FEMS Microbiol. Lett., 2005, 253, 155–161 CrossRef CAS PubMed
.
- M. Parida, G. Posadas, S. Inoue, F. Hasebe and K. Morita, J. Clin. Microbiol., 2004, 42, 257–263 CrossRef CAS PubMed
.
- Y. Mori, K. Nagamine, N. Tomita and T. Notomi, Biochem. Biophys. Res. Commun., 2001, 289, 150–154 CrossRef CAS PubMed
.
- R. C. McKellar, Appl. Environ. Microbiol., 1994, 60, 4219–4225 CAS
.
-
A. D. Hitchins, et al., Laboratory Methods – BAM, http://www.fda.gov/Food/FoodScienceResearch/LaboratoryMethods/ucm071400.htm, accessed October 3, 2016 Search PubMed
.
- Access online, http://www.oie.int/en/international-standard-setting/terrestrial-manual/access-online/, accessed October 15, 2017
.
- S. Chen and B. Ge, BMC Microbiol., 2010, 10, 41 CrossRef PubMed
.
- F. Maruyama, T. Kenzaka, N. Yamaguchi, K. Tani and M. Nasu, Appl. Environ. Microbiol., 2003, 69, 5023–5028 CrossRef CAS PubMed
.
- Y. Wang, Y. Wang, L. Luo, D. Liu, X. Luo, Y. Xu, S. Hu, L. Niu, J. Xu and C. Ye, Front. Microbiol. DOI:10.3389/fmicb.2015.01400
.
- J. Fischbach, N. C. Xander, M. Frohme and J. F. Glökler, BioTechniques, 2015, 58, 189–194 CrossRef CAS PubMed
.
- N. Tomita, Y. Mori, H. Kanda and T. Notomi, Nat. Protoc., 2008, 3, 877–882 CrossRef CAS PubMed
.
- S. Wachiralurpan, T. Sriyapai, S. Areekit, T. Kaewphinit, P. Sriyapai, S. Santiwatanakul and K. Chansiri, Food Anal. Methods, 2017, 1–10 Search PubMed
.
- S. Jayawardena, C. Y. Cheung, I. Barr, K. H. Chan, H. Chen, Y. Guan, J. S. M. Peiris and L. L. M. Poon, Emerging Infect. Dis., 2007, 13, 899–901 CrossRef CAS PubMed
.
- X. Shan, Y. Zhang, Z. Zhang, M. Chen, Y. Su, Y. Yuan, M. J. Alam, H. Yan and L. Shi, Food Sci. Biotechnol., 2012, 21, 101–106 CrossRef CAS
.
- M.-J. Tang, S. Zhou, X.-Y. Zhang, J.-H. Pu, Q.-L. Ge, X.-J. Tang and Y.-S. Gao, Curr. Microbiol., 2011, 63, 511–516 CrossRef CAS PubMed
.
- D. Wang, G. Huo, D. Ren and Y. Li, J. Food Saf., 2010, 30, 251–262 CrossRef CAS
.
| This journal is © The Royal Society of Chemistry 2017 |

