 Open Access Article
Creative Commons Attribution 3.0 Unported Licence
FTIR-spectroscopic and LA-ICP-MS imaging for combined hyperspectral image analysis of tumor models†
A.
Balbekova
 a,
M.
Bonta
a,
S.
Török
b,
J.
Ofner
a,
B.
Döme
bcde,
A.
Limbeck
a,
M.
Bonta
a,
S.
Török
b,
J.
Ofner
a,
B.
Döme
bcde,
A.
Limbeck
 a and
B.
Lendl
 *a
*a
aInstitute of Chemical Technologies and Analytics, Technische Universität Wien, Getreidemarkt 9/164, 1060 Vienna, Austria. E-mail: bernhard.lendl@tuwien.ac.at
bNational Korányi Institute of Pulmonology, Pihenő út 1, 1121 Budapest, Hungary
cDivision of Thoracic Surgery, Department of Surgery, Comprehensive Cancer Center, Medical University of Vienna, Wahringer Gurtel 18-20, 1090 Vienna, Austria
dDepartment of Biomedical Imaging and Image-guided Therapy, Division of Molecular and Gender Imaging, Medical University of Vienna, Wahringer Gurtel 18-20, 1090, Vienna, Austria
eDepartment of Thoracic Surgery, Semmelweis University, National Institute of Oncology, Rath Gyorgy ut 7-9, H-1122, Budapest, Hungary
First published on 23rd August 2017
Abstract
Modern chemical imaging techniques provide spatially resolved information on the molecular and elemental composition of samples with both high spatial and spectral resolution. Over the past few decades these techniques, in particular, Fourier transform infrared (FTIR) spectroscopy and laser ablation inductively coupled plasma mass spectrometry (LA-ICP-MS) have been successfully applied in histopathological research. This work demonstrates that the multivariate analysis of combined FTIR and LA-ICP-MS microscopy hyperspectral images can bring additional knowledge to biomedical research. The concept of such analysis was demonstrated while investigating two different tumor samples subjected to anticancer therapy. Combined analysis has revealed a correlation between the lateral distribution of analytes and sample properties within the different techniques. Correlations between alterations in the average protein secondary structure and platinum distribution were found, as well as between changes in the cell nuclear morphology and a reduction of physiologically relevant trace elements. The results of combined analysis suggested different degrees of tumor viability. Univariate analysis and k-means clustering successfully discriminated dead tumor regions and supported the results of combined analysis.
Introduction
Infrared (IR) spectroscopy1 and mass spectrometry (MS)2 have been applied in numerous applications for biomedical diagnosis. IR spectroscopy as a non-destructive and label free technique provides molecular specific information. Resonant interaction of molecules with mid-IR radiation resulting in absorbance spectra allows the detection of molecular vibrations characteristic of chemical bonds. The IR spectrum carries information regarding molecular conformation and aggregation of biomolecules, such as proteins3 and nucleic acids.4 Furthermore, IR spectroscopy allows the characterization of pathological changes in tissues5 and discrimination between viable and dead cells.6–8 Information on an elemental level is, however, not accessible by IR spectroscopy. For gaining access to this sample information, complementary techniques such as laser ablation inductively coupled plasma mass spectrometry (LA-ICP-MS) are needed. During the signal generation process in LA-ICP-MS, all molecules are decomposed into their respective atoms rendering LA-ICP-MS a pure element analytical technique. With sensitivities below the μg g−1 level for metallic analytes LA-ICP-MS is perfectly suited for investigations of trace elements in biological tissues. The concentrations and tissue distributions of endogenous trace metals as well as artificially introduced elements have been shown to be essential to obtain information from physiological processes.9,10 The number of studies employing solely IR spectroscopy or MS techniques is large. However, studies on the use of both techniques on the same sample and analysis of fused datasets have not been reported so far.Multimodal imaging, as a combination of chemical imaging techniques sensitive to complementary information and applied to one and the same sample, has attracted great interest over the last few years.11–16 Most of the introduced multimodal analytical approaches refer to a combination of different modalities of one technique, such as different modalities of optical spectroscopy.11 The so-called multisensor hyperspectral imaging combines different techniques and offers information not accessible by a single technique or a side-by-side analysis.15 The advantage of combined analysis was for the first time demonstrated by hierarchical cluster analysis of principal component loadings (HCA of the loadings of the PCA; HCA-PCA), k-means clustering and vertex component analysis by multisensor hyperspectral imaging of atmospheric particles17 and single tumor cells.16
Combination therapy in cancer treatment is aimed at enhancing the efficacy of the drugs. Based on the vessel normalization theory of Rakes Jain,18,19 antiangiogenic agents such as sunitinib are expected to normalize tumor blood vessels, and thus when combined with conventional chemotherapeutic drugs such as cisplatin they are expected to facilitate drug distribution in the tumor tissue. Several clinical trials have tested the combinatorial application of sunitinib and cisplatin (http://www.clinicaltrials.gov). However, the most important problem in the clinical application of antiangiogenic agents is assessing the tumor response which can be inadequate. Tumor shrinkages characterized by cavitation have been observed and these do not meet the usual standard radiological criteria for response. A relevant clinical challenge is therefore to find the best techniques for monitoring the effects of antivascular drugs.
The investigated samples are model tumors grown in mice which were subjected to combined therapy (sunitinib and cisplatin) differing in treatment length. The spatial distribution of inhomogeneous apoptotic (dead) regions induced during the therapy within two different tumors was investigated by means of multivariate data analysis of the imaged tumor thin sections. The present work demonstrates the advantages of combined imaging of thin cuts of different tumors (in a “proof of concept” manner) using vibrational spectroscopy, in particular, Fourier transform infrared (FTIR) spectroscopy and mass spectrometry (LA-ICP-MS). Multivariate statistical methods are applied to find correlations between spatial distributions of different spectral features associated with molecular and elemental content in order to characterize viable and dead tissue regions within the samples, demonstrating the advantages of combined FTIR and LA-ICP-MS imaging to achieve a deeper understanding of the processes occurring within biological samples.
Experimental
Tumor model and drug treatment
The C26 mouse colon adenocarcinoma cell line (Cell Line Service, Mason Research Institute, Eppelheim, Germany) was cultured in RPMI 1640 medium with 10% fetal bovine serum and 1% penicillin/streptomycin (all from Sigma Aldrich, Steinheim, Germany) in a humidified atmosphere at 37 °C and 5% CO2. Groups of six 8 week-old female Balb/C mice from the colony of the National Oncology Institute, Budapest were inoculated subcutaneously with 2 × 10⁶ C26 cells.All animal-model protocols were developed and conducted in accordance with the ARRIVE guidelines and the animal welfare regulations of the Department of Tumor Biology, National Koranyi Institute of Pulmonology (permission number: 22.1/1268/3/2010). The mice were kept on a daily light (12 h)/dark (12 h) cycle and held in a conventional animal house in microisolator cages with water and laboratory chow ad libitum.
Sunitinib of >99% purity was purchased from LC Laboratories (Woburn, MA, USA, CAS. No. 557795-19-4) and suspended in 2% carboxymethylcellulose with 2 mg mL−1 methyl-4 hydroxibenzoate (both from Sigma Aldrich). Cisplatin was purchased from Accord Healthcare (London, GB, Ma no. OGYI-T-21728/01).
Sunitinib treatment began 7 days after tumor cell injection and was performed orally with a feeding tube once daily at a dose of 80 mg kg−1 each day for 11 days (S1 sample) and 17 days (S2 sample). With the last dosage of sunitinib, the mice also received a bolus of cisplatin intraperitoneally at a dose of 10 mg kg−1. Three hours after the last treatment the animals were sacrificed. The tumors were removed and snap frozen by submerging the tissues in dry ice cooled isopentane. The frozen tissues were stored at −80 °C until utilization.
Sample preparation and materials
To implement IR and MS imaging on the same thin-cut sample, a silicon wafer was chosen as a sample substrate. Silicon is partly transparent to IR radiation and has no spectral features in the middle IR spectral region. By having only one side of the wafer polished, interference fringes, resulting from multiple reflections at the Si/air and Si/sample interfaces due to differences in the respective refractive indexes, could be avoided. Furthermore, the silicon wafer does not produce signals at m/z values of the investigated target analytes during the MS measurements. It is, therefore, a suitable substrate for sample preparation for both techniques.Cryo-cut sections of tumor tissue were prepared using a Shandon™ Cryomatrix™ (ThermoFisher Scientific, Marietta, OH, USA) mounting medium. Sections with thicknesses of 10 μm were deposited on the silicon wafers (CrysTec GmbH, Berlin, Germany) for IR and MS imaging. The silicon substrates were surface modified with (3-aminopropyl)-triethoxysilane in order to optimize the adhesion of the tissue section according to a protocol used in a previous study.9 Before sample deposition, the silicon wafers were sonicated for 10 min in acetone, ethanol (St. Louise, MO, USA) and ultra-pure water (Milli-Q Millipore System). Ultra-pure water (resistivity 18.2 MΩ cm) was dispensed from a Barnstead EASYPURE II water system (ThermoFisher Scientific, Marietta, OH, USA).
FTIR micro-spectroscopy
Fourier transform infrared (FTIR) spectroscopic measurements were carried out using a Bruker Hyperion 3000 microscope equipped with a liquid nitrogen cooled focal plane array (FPA) detector with 64 × 64 pixels and connected to a Bruker Tensor 37 FTIR spectrometer. A 15× Cassegrain objective (0.4 NA) was applied for imaging. Prior to measurements, a light microscope image of each sample was recorded. By scanning samples S1 and S2 using a raster pattern, tiled images consisting of 31 × 23 parts (713 FPA images) and 24 × 53 parts (1272 FPA images) were constructed. Pixels of the detector were binned 4 by 4 obtaining 256 spectra simultaneously per FPA image. The spectra were merged into one FTIR hyperspectral image (dataset) where each pixel of the image corresponds to a single IR spectrum. The spectra were recorded in transmission mode with 4 cm−1 spectral resolution in the range of 3850–900 cm−1 (2.6–11 μm). In order to improve the signal to noise ratio, 64 scans were averaged to yield one single beam spectrum. Artefacts in the spectra caused by atmospheric water vapor were minimized by purging the FTIR microscope system with a constant stream of dry air. Background single beam spectra were measured on an area of the silicon wafer without tissue material by accumulating 128 scans. Processing of the single beam spectra and calculation of the absorbance spectra were performed using the software package OPUS 7.5 (Bruker Optics).LA-ICP-MS measurements
LA-ICP-MS measurements were performed using a commercially available laser ablation system (New Wave 213, ESI, Fremont, CA) equipped with a frequency quintupled Nd:YAG laser operating at a wavelength of 213 nm and a fast-washout ablation cell. The laser ablation device was coupled to a quadrupole ICP-MS system (iCAPQc, ThermoFisher Scientific, Bremen, Germany) using PTFE tubing. Helium was used as the ablation gas; before entering the ICP, argon was admixed as the make-up gas. Detailed instrumental parameters of the LA-ICP-MS measurements together with a list of the monitored isotopes can be found in Table 1. Isotope 64Zn was chosen for measurements because its signal is not influenced by the signals from isotope 64Ni due to its high natural abundance (49.2% vs. 0.9%). The polyatomic interferent 12C12C40Ar did not influence the signal from 64Zn. This was tested on a polymer which does not contain Zn. No possible interference at m/z = 56 from the silicon substrate (formation of a 28Si28Si polyatomic interferent) has been observed. This was tested on Si substrates without tissue samples on them.| Laser ablation | ICP-MS | ||
|---|---|---|---|
| Wavelength | 213 nm | Plasma power | 1550 W |
| Pulse duration | 4 ns | Cool gas flow | 14.0 L min−1 |
| Laser repetition rate | 20 Hz | Auxiliary flow | 0.8 L min−1 |
| Laser beam diameter | 25 μm | Cones | Ni |
| Laser energy | 1.38 mJ | Scanning mode | Peak hopping |
| Laser scan speed | 75 μm s−1 | Dwell time per isotope | 10 ms |
| Laser beam geometry | Circular | Monitored isotopes | 13C, 23Na, 24Mg, 25Mg, 31P, 34S, 39K, 55Mn, 56Fe, 57Fe, 58Ni, 60Ni, 63Cu, 64Zn, 65Cu, 66Zn, 194Pt, 195Pt, 197Au |
| He gas flow | 1.0 L min−1 | Mass resolution | 300 m per Δm |
| Ar make-up flow | 0.8 L min−1 | ||
Prior to measurement, the samples were coated using a thin gold layer according to a procedure reported previously to be used as a pseudo-internal standard.20 The samples were rasterized using a line-scan pattern covering the complete tissue slice. The laser output energy was adjusted to ablate the complete tissue material in one run to enable accurate quantification of the elemental concentrations in the tissue. The calculation of trace element concentrations from the gold-normalized signal intensities was performed by external calibration with dried droplet standards as reported earlier.21
Data preprocessing, data fusion and spectral descriptors
The IR spectra were baseline corrected by applying the multiplicative scattering correction algorithm available in the OPUS 7.5 (Bruker Optics) spectrometer software and subsequently normalized to the intensity of the amide II band (1587–1482 cm−1). The remaining data processing, fusion, and multivariate analysis were performed using the software package ImageLab 1.89 (Epina GmbH; http://www.imagelab.at).The second derivative spectra of the IR datacube were calculated and smoothed using a Savitzky–Golay filter (13 point window size, second order polynomial) and vector normalized. The preprocessed IR datacube was appended to the raw IR dataset.
The MS datacube was normalized to the internal standard (the gold layer) and trace element concentrations were calculated using calibration functions for each measured isotope.
To analyze the IR and MS of the same sample area in common, the single datacubes had to be fused to an overall multisensor hyperspectral dataset. First, individual datasets (IR and MS) are separately aligned to the same reference image (visible light microscope image). Here the anchor points are defined on the distinct areas of a common reference image and a related chemical image of the single datacube. Precisely defined anchor points facilitate an accurate dataset alignment. Using the defined anchor points a dataset is aligned via a linear affine transformation. Subsequently, the aligned datasets are merged into a combined hyperspectral dataset. The whole procedure is done using the Imagelab software package and discussed elsewhere in detail.15,17
Pixels corresponding to the outer sample area (background) and to spectra lacking signal to noise ratios were eliminated from the data analysis. Additionally, a small number of pixels related to the border between the tumor and the substrate were excluded since they possess IR spectra affected by Mie scattering (commonly present in biological samples).22 To reduce the dimensionality of the multisensor hyperspectral dataset, raw and second derivative IR datasets as well as the MS dataset were described by using the spectral descriptor (SPDC) concept (Fig. 1).15 SPDCs extract different spectroscopic information by applying distinctive methods (e.g., baseline-corrected integration of bands, template peaks, and centroid descriptors) from the overall dataset. In this work, two kinds of SPDCs were applied to IR data: peak area and peak ratio descriptors. The peak area descriptor reflects changes in band intensity and represents the sum of the intensities within a spectral range with the subtracted baseline. The peak ratio descriptor is applied to the second derivative IR spectrum and represents a ratio between local minima in a selected band, helping to define changes in band shapes.
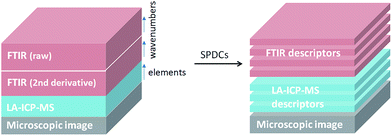 | ||
| Fig. 1 General scheme of a dataset representation by introducing SPDCs into the combined dataset for combined analysis. | ||
In the case of the MS data, intensity descriptors were defined to describe the intensities of the elements of interest. MS signal intensities were quantified and transformed into concentrations using external calibrations. Prior to any multivariate analysis, all SPDCs were subjected to standardization (with a mean value of zero and a standard deviation of one).
Multivariate analysis
For the HCA of the PCA loadings, an accurate number of principal components (PCs) has to be chosen. The number of PCs was chosen according to the Kaiser criterion23 to optimize the inter-cluster distance of the related HCA. The correlation of SPDCs across the different sub-datasets is demonstrated by the related dendrogram (Fig. 2). Horizontal lines on the dendrogram show the similarity between SPDCs expressed in terms of the Euclidian distance between them in the loadings of the PC space. Small values of Euclidian distance are related to high correlation between variables and vice versa.
Results and discussion
Definition of SPDCs
The concept of multivariate analysis using SPDCs15 presumes the definition of SPDCs. Due to the fact that in the tumors apoptotic regions are present (as supported by histological studies, e.g. Fig. S1†), IR SPDCs trimmed to biochemical changes related to apoptosis were defined (Table 2, SPDCs 1–4). According to the literature, during apoptosis primary changes occur in the secondary structure of proteins and the phosphate stretching vibrational mode.6,7,29 The amide I vibrational band is composed of sub-bands assigned to different sub-structures of proteins (alpha-helices, beta-sheets, random coils, and turns).3 The second derivative spectrum of this band is commonly used for quantification of the protein secondary structures by following the local intensity minima.30 For both samples, the most significant alterations in the amide I band were found for an alpha-helix (1654 cm−1) and parallel beta-sheet (1627 cm−1). To highlight the reciprocal changes of these sub-bands, a SPDC describing the ratio of beta sheets to alpha helices was introduced (Table 2, SPDC 1).| SPDC number | SPDC type | IR: spectral range, cm−1 MS: isotope | Vibrational mode | Assignment |
|---|---|---|---|---|
| 1 | Peak ratio | 1627/1655 |
ν(C![[double bond, length as m-dash]](https://www.rsc.org/images/entities/char_e001.gif) O) & δ(N–H) (amide I) O) & δ(N–H) (amide I) |
Protein backbone (β-sheet/α-helix) |
| 2 | Peak area | 1146–1070 | ν s(P–O) of PO2− | Nucleic acids |
| 3 | Peak area | 1761–1722 |
ν(C![[double bond, length as m-dash]](https://www.rsc.org/images/entities/char_e001.gif) O) of ester O) of ester |
Lipids and phospholipids |
| 4 | Peak area | 1477–1429 | δ(C–H) of CH2 | Lipids and proteins |
| 5 | Peak intensity | 195Pt | Active component of cisplatin | |
| 6 | Peak intensity | 31P | Biologically relevant element | |
| 7 | Peak intensity | 64Zn | Biologically relevant element | |
| 8 | Peak intensity | 24Mg | Biologically relevant element | |
The band of the phosphate symmetric stretching vibration with its maximum at 1080 cm−1 is mainly related to the nucleic acid content. A decrease of the intensity of this band is considered as a sign of apoptosis by numerous studies.7,31 Therefore, a related SPDC was introduced (Table 2, SPDC 2).
At the border of sample S2, areas with increased IR intensities in the range of 1743 cm−1 (ν(C![[double bond, length as m-dash]](https://www.rsc.org/images/entities/char_e001.gif) O) of ester) to 1454 cm−1 (δ(C–H) of CH2) were found. These bands originate from the embedding material (polyvinyl alcohol and polyethylene glycol), which was used to hold the tumor during the micro-sectioning. According to these spectral features, additional SPDCs were introduced (Table 2, SPDCs 3–4).
O) of ester) to 1454 cm−1 (δ(C–H) of CH2) were found. These bands originate from the embedding material (polyvinyl alcohol and polyethylene glycol), which was used to hold the tumor during the micro-sectioning. According to these spectral features, additional SPDCs were introduced (Table 2, SPDCs 3–4).
SPDCs for the MS sub-dataset, describing the distribution of some endogenous elements such as P, Zn, and Mg (Table 2, SPDCs 6–8), were defined. Additionally a SPDC for platinum (Table 2, SPDC 5) was defined as a tracer for the drug cisplatin. The following sets of descriptors were used for multivariate analysis: SPDCs 1 and 2 and 5–8 for sample S1 and SPDCs 1–8 for sample S2.
HCA of the loadings of the PCA
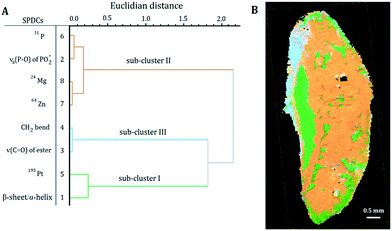
Correlations between the SPDCs describing the most prominent changes in the investigated samples were found by the HCA of the loadings of the PCA (Fig. 3A and 4A). Based on the Kaiser criterion,23 the first two and three PCs for samples S1 and S2 respectively were chosen for calculating the HCA. Fig. 3A reveals two groups of correlated SPDCs. In sub-cluster I, a strong correlation is found between the MS SPDC 5 (195Pt) and the IR SPDC 1 (protein secondary structure). Sub-cluster II is formed by one IR SPDC 2 (nucleic acids) and three MS SPDCs 6–8 (31P, 64Zn, and 24Mg).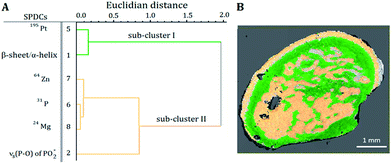 | ||
| Fig. 3 (A) Dendrogram of the HCA of the loadings of the SPDC-based PCA of sample S1. (B) Related sub-cluster images overlaid with the microscope image. | ||
 | ||
| Fig. 4 (A) Dendrogram of the HCA of the loadings of the SPDC-based PCA of sample S2. (B) Related sub-cluster images overlaid with the microscope image. | ||
HCA of the loadings of the PCA of sample S2 revealed three distinct sub-clusters within the dendrogram (Fig. 4A). Sub-clusters I and II are identical to the ones obtained during the analysis of sample S1. In sub-cluster II of sample S2 all SPDCs are strongly correlated, in contrast to sample S1 where SPDC 2 is less correlated with the other SPDCs (Fig. 3A). Additionally, sub-cluster III was extracted during the analysis of sample S2. SPDCs in sub-cluster III describe the lipid content associated with the mounting media used during the sample preparation.
To evaluate the results of the HCA of the loadings of the PCA, chemical images generated from the values of the introduced SPDCs were extracted and compared. The chemical images obtained from the SPDCs are related to an intensity value of the selected SPDCs (Fig. 5 and 6).
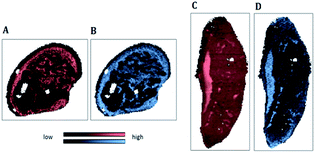 | ||
| Fig. 5 IR map of the beta-sheet to alpha-helix ratio (SPDC 1) applied to samples S1 (A) and S2 (C); MS elemental map of 195Pt (SPDC 5) applied to samples S 1 (B) and S2 (D). | ||
Fig. 5A and C demonstrate the increased ratio of beta-sheet to alpha-helical protein structures in apoptotic tissue areas for samples S1 and S2 respectively. Similar observations were reported previously.6,7 Furthermore, an increase of the Pt signal in dead tissue areas was detected (Fig. 5B and D). The chemical maps of Pt and the beta-sheet/alpha-helix ratio are similar for both samples.
The similarity of the chemical images is in agreement with results of the HCA of the loadings of the PCA (Fig. 3A and 4A: sub-cluster I). This correlation is supported by previous studies reporting cisplatin–protein interaction.32
The chemical images of SPDC 2 of the symmetric phosphate vibration demonstrate a decreased signal in apoptotic areas of both samples (Fig. 6A and D). This agrees well with other spectroscopic studies of apoptotic cells.7,31 This spectral change is related to two stages of apoptosis; first, it reflects nuclear condensation (early apoptosis), and second, it can also be the result of nucleic acid degradation and the diffusion of phosphate ions to neighboring viable tissue (late apoptosis). At earlier stages of apoptosis the decrease in the intensity of the absorbance band is explained by nonlinear IR light absorption of nuclei due to the enormously increased concentration of molecules and therefore the increase of optical density.33
According to the chemical images, reduced phosphor (Fig. 6B and E) and zinc (Fig. 6C and F) concentrations were found in apoptotic areas. The loss of biologically relevant ions occurs essentially during cellular death. Several studies demonstrated that in dead cells the ions migrate to the surrounding environment. The loss of phosphor was considered as an indicator of apoptosis in previous studies.34 The decrease of the essential biological elements (P and Zn) was also related to the presence of dead cancerous tissue areas.35
The chemical images of the SPDCs of sub-cluster II are similar in sample S2 (Fig. 6D–F), whereas in sample S1 these images partially coincide (Fig. 6A–C). The IR absorption map for the band characterizing symmetric phosphate vibration demonstrates the decreased signal of the peripheral circular and central areas (Fig. 6A). Phosphorus (Fig. 6B) and zinc (Fig. 6C) exhibit decreased signals mostly in the peripheral circular area. This finding can also be stated for another physiologically relevant element: magnesium. Differences in the spatial distributions between IR SPDC 2 and MS SPDCs 6–8 are correlated with the results of HCA of the loadings of the PCA (Fig. 3A: sub-cluster II). According to the dendrogram IR SPDC 2 is less correlated with MS SPDCs 6–8.
These differences in spatial distribution between IR and MS SPDCs confirm different stages of apoptosis occurring within sample S1. Areas with both decreased signal intensities of IR SPDC 2 and MS SPDCs 6–8 were related to a later stage of apoptosis, when apoptotic cells are degenerated and the migration of biologically relevant ions takes place. Tumor regions with decreased intensities of the phosphate-related SPDC 2 but not yet showing a distinct decrease of other elements (P, Zn, and Mg) are related to an earlier stage of apoptosis which is accompanied by nuclear condensation.
According to the chemical images (Fig. 6D–F) and HCA of the loadings of the PCA (Fig. 4A: sub-cluster II) the decay of the intensity of the band assigned to phosphate symmetric stretching vibrational mode and loss of endogenous elements occurred in the same areas of sample S2. This fact confirms that in this sample a later stage of apoptosis has occurred.
Thus, in sample S1 both early and late apoptotic tissue types are present, whereas in sample S2 only a later stage of apoptosis has occurred. This observation is supported by the fact that sample S2 was treated for a longer time (17 days) compared to S1 (11 days), assuming that the longer treatment of sample S2 facilitated the degradation of more apoptotic cells.
k-means clustering
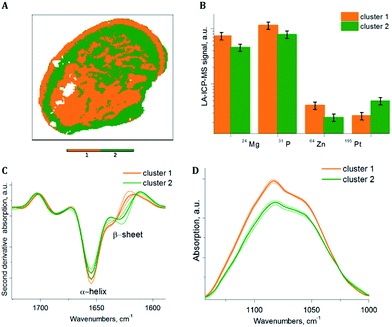
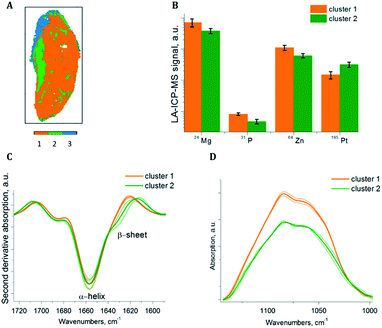
To extract sub-cluster spectra related to the results of the HCA of the loadings of the PCA, k-means clustering was performed. The “Kaiser” criterion23 suggested the number k equal to two and three for samples S1 and S2 respectively. The first two PCs revealed 66.98% of the whole variance of sample S1 and the first three PCs revealed 78.36% of the whole variance of sample S2. Additionally, the “Elbow” criterion supported the results of the “Kaiser” criterion suggesting clustering into two and three clusters for samples S1 and S2 respectively. These estimated numbers of clusters are in agreement with the results of the HCA of the PCA loadings, where two and three main clusters respectively are demonstrated, based on the inter-cluster distances in the dendrograms (Fig. 3A and 4A). Fig. 7A and 8A display the results of SPDC-based k-means clustering of the two samples.Chemical cluster images (Fig. 7A and 8A) obtained by k-means clustering exhibit a good correlation with the cluster images obtained from the HCA of the loadings of the PCA (Fig. 3B and 4B). In order to access the spectral properties and differences between clusters, mean spectra from each cluster were extracted. The increase of the β-sheet vibration (Fig. 7C and 8C) and the concentration of 195Pt (Fig. 7B and 8B) is correlated in cluster 2 and demonstrated by the mean spectra. Furthermore, a decrease of the intensity of the band assigned to phosphate symmetric stretching vibrational mode (Fig. 7D and 8D) and a lower concentration of endogenous elements (Fig. 7B and 8B) is observed in this cluster. For both samples the results of clustering correlate with the chemical images (Fig. 5 and 6), where in apoptotic regions analogous qualitative changes were observed. In general, cluster 1 (of both samples) is related to viable tissue, while cluster 2 can be attributed to apoptotic tissue. Cluster 3 in sample S2 is supposed to be caused by the mounting media used during the sample preparation.
Conclusions
In this work, two different tumor samples with viable and apoptotic regions were imaged with IR and MS spectroscopic techniques. Chemical images obtained by hyperspectral imaging were fused to multisensor hyperspectral datacubes. Subsequently, multivariate analysis was performed on these datacubes. By applying HCA of the loadings of the PCA, correlations between vibrational and elemental features were uncovered. A correlation between protein secondary structure changes and the accumulation of the drug containing element (Pt) was found in both samples. Additionally, the correlation of decays of biologically relevant elements (P, Zn, and Mg) and the symmetrical phosphate absorption band associated with changes in nucleic acids was observed. Based on these findings, obtained by the combined analysis of the multisensor hyperspectral datasets, it was postulated that the degree of correlation is related to the degree of apoptosis occurring in the samples: strong correlations of multisensor descriptors are related to a later apoptosis, whereas weak correlations indicate the presence of both early and late apoptosis. This result is supported by the fact that the sample possessing late apoptotic regions was subjected to a longer drug therapy. The multivariate analysis of the multisensor hyperspectral datasets was performed by univariate side by side analysis of extracted chemical maps obtained by using single spectral descriptors. In this study, the advantages of combined chemical imaging to facilitate a deeper understanding of biochemical processes were demonstrated.Conflicts of interest
There are no conflicts to declare.Acknowledgements
A. B. and M. B. are thankful for the MEIBio doctoral project of TU Wien for providing a scholarship in the period 2013 to 2017. Furthermore, A. B. and B. L. acknowledge funding from the Austrian FFG within the project 842471. B. D. was supported by the Hungarian Scientific Research Fund (SNN114490, K109626, and K108465), the Semmelweis University Start-Up grant (40148-11658) and the Vienna Fund for Innovative Interdisciplinary Cancer Research. The authors thank Prof. H. Lohninger for fruitful discussions and valuable assistance in ImageLab handling. The authors acknowledge the TU Wien University Library for financial support through its Open Access Funding Program.Notes and references
- D. Naumann, Infrared Spectroscopy in Microbiology, 2006 Search PubMed.
- D. Pozebon, G. L. Scheffler, V. L. Dressler and M. a. G. Nunes, J. Anal. At. Spectrom., 2014, 29, 2204–2228 RSC.
- A. Barth, Biochim. Biophys. Acta, 2007, 1767, 1073–1101 CrossRef CAS PubMed.
- D. R. Whelan, K. R. Bambery, P. Heraud, M. J. Tobin, M. Diem, D. McNaughton and B. R. Wood, Nucleic Acids Res., 2011, 39, 5439–5448 CrossRef CAS PubMed.
- C. Petibois and G. Deleris, Trends Biotechnol., 2006, 24, 455–462 CrossRef CAS PubMed.
- U. Zelig, J. Kapelushnik, R. Moreh, S. Mordechai and I. Nathan, Biophys. J., 2009, 97, 2107–2114 CrossRef CAS PubMed.
- A. Lamberti, C. Sanges and P. Arcari, J. Spectrosc., 2010, 24, 535–546 CrossRef CAS.
- H. D'inca, J. Namur, S. H. Ghegediban, M. Wassef, F. Pascale, A. Laurent and M. Manfait, Am. J. Pathol., 2015, 185, 1877–1888 CrossRef PubMed.
- M. Bonta, J. J. Gonzalez, C. D. Quarles, R. E. Russo, B. Hegedus and A. Limbeck, J. Anal. At. Spectrom., 2015, 31, 252–258 RSC.
- J. Sabine Becker, J. Mass Spectrom., 2013, 48, 255–268 CrossRef CAS PubMed.
- N. Vogler, S. Heuke, T. W. Bocklitz, M. Schmitt and J. Popp, Annu. Rev. Anal. Chem., 2015, 8, 359–387 CrossRef PubMed.
- D. Perez-Guaita, K. Kochan, M. Martin, D. W. Andrew, P. Heraud, J. S. Richards and B. R. Wood, Vib. Spectrosc., 2016, 91, 46–58 CrossRef.
- A. Gowen and R. Dorrepaal, Molecules, 2016, 21, 870–887 CrossRef PubMed.
- A. G. Ivano Alessandri, I. Vassalini, M. Bertuzzi, N. Bontempi and M. Memo, Sci. Rep., 2016, 6, 34521–34528 CrossRef PubMed.
- H. Lohninger and J. Ofner, Spectrosc. Eur., 2014, 26, 6–10 CAS.
- J. Ofner, F. Brenner, K. Wieland, E. Eitenberger, C. Eisenmenger-sittner, S. Török, B. Döme, A. Kasper-giebl, H. Hutter, G. Friedbacher, B. Lendl and H. Lohninger, Sci. Rep., 2017, 7, 1–11 CrossRef PubMed.
- J. Ofner, K. A. Kamilli, E. Eitenberger, G. Friedbacher, B. Lendl, A. Held and H. Lohninger, Anal. Chem., 2015, 87, 9413–9420 CrossRef CAS PubMed.
- P. Carmeliet and R. K. Jain, Nat. Rev. Drug Discovery, 2011, 10, 417–427 CrossRef CAS PubMed.
- R. K. Jain, Science, 2005, 307, 58–62 CrossRef CAS PubMed.
- M. Bonta, H. Lohninger, M. Marchetti-Deschmann and A. Limbeck, Analyst, 2014, 139, 1521–1531 RSC.
- M. Bonta, B. Hegedus and A. Limbeck, Anal. Chim. Acta, 2016, 908, 54–62 CrossRef CAS PubMed.
- J. Bukowska, P. Piotrowski and M. Baranska, Optical Spectroscopy and Computational Methods in Biology and Medicine, 2014 Search PubMed.
- I. T. Jolliffe, Principal Component Analysis, 2nd edn, 2002, vol. 30 Search PubMed.
- J. Macqueen, Proc. Fifth Berkeley Symp. Math. Stat. Probab., 1967, vol. 1, pp. 281–297 Search PubMed.
- M. J. Baker, J. Trevisan, P. Bassan, R. Bhargava, H. J. Butler, K. M. Dorling, P. R. Fielden, S. W. Fogarty, N. J. Fullwood, K. a. Heys, C. Hughes, P. Lasch, P. L. Martin-Hirsch, B. Obinaju, G. D. Sockalingum, J. Sulé-Suso, R. J. Strong, M. J. Walsh, B. R. Wood, P. Gardner and F. L. Martin, Nat. Protoc., 2014, 9, 1771–1791 CrossRef CAS PubMed.
- P. Lasch, W. Haensch, D. Naumann and M. Diem, Biochim. Biophys. Acta, Mol. Basis Dis., 2004, 1688, 176–186 CrossRef CAS PubMed.
- P.-N. Tan, M. Steinbach and V. Kumar, Introduction to Data Mining, Addison-Wesley Longman Publishing Co., Inc., Boston, MA, USA, 1st edn, 2005 Search PubMed.
- D. Steinley, Br. J. Math. Stat. Psychol., 2006, 59, 1–34 CrossRef PubMed.
- K. Z. Liu, L. Jia, S. M. Kelsey, A. C. Newland and H. H. Mantsch, Apoptosis, 2001, 6, 269–278 CrossRef CAS PubMed.
- J. Kong and S. Yu, Acta Biochim. Biophys. Sin., 2007, 39, 549–559 CrossRef CAS PubMed.
- Y. Gao, X. Huo, L. Dong, X. Sun, H. Sai, G. Wei, Y. Xu, Y. Zhang and J. Wu, Mol. Med. Rep., 2015, 11, 2585–2591 CrossRef CAS PubMed.
- J. Neault and H. Tajmir-Riahi, Biochim. Biophys. Acta, Protein Struct. Mol. Enzymol., 1998, 1384, 153–159 CrossRef CAS.
- B. Mohlenhoff, M. Romeo, M. Diem and B. R. Wood, Biophys. J., 2005, 88, 3635–3640 CrossRef CAS PubMed.
- C. D. Bortner and J. A. Cidlowski, J. Biol. Chem., 1999, 274, 21953–21962 CrossRef CAS PubMed.
- Y. K. Hsieh, P. S. Jiang, B. S. Yang, T. Y. Sun, H. H. Peng and C. F. Wang, Anal. Bioanal. Chem., 2011, 401, 909–915 CrossRef CAS PubMed.
Footnote |
| † Electronic supplementary information (ESI) available. See DOI: 10.1039/c7ay01369h |
| This journal is © The Royal Society of Chemistry 2017 |


