Gold nanoparticle/hexaammineruthenium/Nafion® modified glassy carbon electrodes for trace heavy metal detection in commercial hair dyes
Shirley
Palisoc
 ab,
Alnira Mei
Causing
 a and
Michelle
Natividad
 *ab
*ab
aCondensed Matter Physics Laboratory, De La Salle University, 2401 Taft Avenue, Malate, Manila, Philippines 922. E-mail: michelle.natividad@dlsu.edu.ph
bCondensed Matter Research Unit, CENSER, De La Salle University, 2401 Taft Avenue, Malate, Manila, Philippines 922
First published on 6th June 2017
Abstract
Gold nanoparticle (AuNP)/hexaammineruthenium(III) ([Ru(NH3)6]3+)/Nafion® modified glassy carbon electrodes (GCEs) were fabricated and used as working electrodes in the determination of lead and cadmium in commercial hair dyes. The reversibility and stability of the modified electrodes were examined using cyclic voltammetry in which the voltammograms showed reversible peaks. Lead (Pb2+), and cadmium (Cd2+) were detected through anodic stripping voltammetry. The AuNP–[Ru(NH3)6]3+ amount chosen to detect lead and cadmium in hair dyes was 3 mg and 1 mg, respectively, since it was able to simultaneously detect the said metal ions. Furthermore, the peak current and metal concentration displayed a linear relationship with strong correlation values from 0.30 part per million (ppm) to 0.75 ppm for Pb2+ and Cd2+. The limits of detection are 0.0450 ppm and 0.20 ppm for lead and cadmium, respectively. Atomic absorption spectrometry was used to verify the concentrations in each solution.
1. Introduction
Hair dye has been around since ancient times and has been used by different civilizations around the world. Hair dyes were processed during the Bronze Age from plants and metallic compounds. Heavy metals such as lead, iron and silver nitrate were mixed with pre-modern dyes that were derived from plants to extend their shelf life and to add texture to the shades.1 Today, pigments used in making hair dyes are metal oxides, such as titanium dioxide and iron oxide, and dye chemicals or amino compounds such as 4-amino-2-hydroxytoluene and m-aminophenol.2 The addition of metal based compounds in hair dyes causes adverse effects such as temporary skin irritation (from phenylenediamine) and allergy, hair breakage, skin discoloration and undesirable hair color. Moreover, toxicity from hair dyes result in health problems such as reproductive abnormality from lead acetate trihydrate and some forms of cancer such as leukemia, non-Hodgkin's lymphoma, bladder cancer, blood cancer and multiple myeloma.2 With the proliferation of commercially available hair dyes, abetted by the latest trends in fashion, there is indeed an urgent need to determine their toxic metal content.Lead and cadmium are examples of heavy metals that are toxic even in trace levels.3 They pose a high risk to human health.4 Exposure to high concentrations of these metals through cosmetics can bring about serious health effects such as coma, convulsions or even death. They enter the body and are distributed to organs such as the brain, kidneys, liver and bones.5,6 Lead salts, particularly lead acetate with sulfur, are still used in hair dyes. They are common ingredients in progressive hair dyes or those that are applied numerous times to achieve a certain color.7 According to Ozbek et al.,8 to make henna dyes stronger and to generate different shades aside from the color of the plant (red orange), different substances and herbs are added. The brown and black dyes that they studied had 610–920 ppb and 560 to 810 ppb, respectively. Lekouch et al.9 investigated lead in henna and kohl and reported that elaborate henna (that mixed with other products) contained higher concentrations of lead compared to pure henna. Khani et al.10 reported that the brown hair coloring they obtained contained 158.50 ppb of Cd2+. Metals deposit on the hair and build up in the body which can cause abdominal pain, male reproductive problems, memory loss, weakness and pain, kidney failure or tingling in the extremities.7,8
One of the methods of detecting metals is anodic stripping voltammetry (ASV) which utilizes three electrodes: a working electrode, a reference electrode and a counter electrode. The working electrode functions as a sensor in the analysis of different organic and inorganic analytes in different matrices. There is now a big thrust in the fabrication and synthesis of chemically modified working electrodes to determine toxic metals and other contaminants, biological and otherwise, which have characteristic electrochemical properties. Modification of the bare working electrode enhances its physical, chemical, electrochemical, optical and transport properties.9 Electrodes can be modified by depositing a polymer film on the electrode surface. In this method, a polymer is doped with an electrochemical mediator such as hexaammineruthenium ([Ru(NH3)6]3+ or RuHex). Electron transfer is then facilitated upon the immobilization of the mediator within the film. Nafion® is typically used as the polymer film coating because of its ability to resist chemical attack which consequently protects the electrode.10–16 Nanomaterials such as gold nanoparticles (AuNPs) are also incorporated in the polymer film to enhance the sensitivity of the electrode.17–19 Glassy carbon electrodes were modified with gold nanoparticles, graphene and Nafion® for the detection of cadmium (Cd2+), copper (Cu2+), and lead (Pb2+) in tobacco and tobacco products.20 Tseliou et al.21 synthesized low dimensional Bi2Te3–graphene oxide hybrid film-modified electrodes for ultra-sensitive stripping voltammetric detection of Pb(II) and Cd(II). Jin et al.22 prepared electrochemically mediated chelating polymer brushes at paraffin-impregnated graphite electrodes for Pb2+ sensing. Xiao et al. developed an efficient electrochemical sensor based on three-dimensionally interconnected mesoporous graphene framework for simultaneous determination of Cd(II) and Pb(II).23
In this study, gold nanoparticle/hexaammineruthenium(III)/Nafion® modified glassy carbon electrodes (GCEs) were fabricated via the drop coating technique. The modified electrodes were used to detect traces of heavy metal ions in commercial hair dyes. Anodic stripping voltammetry was used to determine the heavy metals present in the samples.
2. Methodology
2.1. Glassware and equipment
Cyclic voltammetry and anodic stripping voltammetry measurements were carried out using a BST8 potentiostat/galvanostat. A three-electrode electrochemical cell was equipped with the modified electrode as the working electrode, platinum coil and saturated calomel as counter and reference electrodes, respectively. All mass measurements were made using a BOSCH SAE200 electronic balance. Coating solutions were dropped onto the surface of the electrode using a Transferpette® micropipette. Cleaning of glassware was done using a BANDALIN SONOREX ultrasonic bath. Atomic absorption spectrometry was done using an AA-6300 Shimadzu Atomic Absorption Spectrophotometer.2.2. Chemicals and reagents
Gold nanopowder (particle size < 100 nm), hexaammineruthenium chloride and cadmium chloride were purchased from Sigma Aldrich. Nafion® (10 wt%), obtained from Fuel Cell Store, diluted in ethanol was used in this study. Lead chloride was purchased from Techno Pharmchem and cadmium chloride was purchased from Sigma-Aldrich. The chemicals were of analytical reagent grade and all aqueous solutions were prepared using deionized water.2.3. Preparation of electrode modifier solution
AuNP and [Ru(NH3)6]3+ amounts were varied at 1 mg, 2 mg and 3 mg in order to obtain the electrode modifier combination which would produce the best electrode. The amount of Nafion solution was held constant at 1%. To prepare the casting solution, Nafion® and methanol were measured using a 100 mL graduated cylinder. The measurements of AuNP and [Ru(NH3)6]3+ amounts were done separately using a BOSCH SAE200 electronic balance. These were then placed in a 50 mL beaker, along with the Nafion®–ethanol solution. The casting solution was sonicated for 1.5 hours for homogenization.2.4. Preparation of modified GCEs
Prior to dropwise addition of the casting solution, the GCEs were polished on a glass slide using alumina slurry (0.03 μm and 0.5 μm) until a smooth and lustrous finish was obtained. They were then ultrasonically cleaned in a Petri dish with methanol for five minutes and then rinsed with tap water and distilled water successively. The electrodes were wiped dry and then wrapped with Teflon® tape which covered the sides of the electrode and spared the surface on which the solution was dropped. They were air dried for 2 hours.2.5. Voltammetry
Anodic stripping voltammetry in this study had three steps: accumulation (preconcentration), deposition (equilibration) and stripping. Optimization of the parameters used was done. The deposition and accumulation potential chosen was −0.90 V because it showed the highest anodic current peaks in both steps. Since the intensity of the anodic current peak increased as the deposition time increased, 30 seconds was chosen because it is the most efficient time and 60 seconds was chosen for the accumulation time. Optimization of the modifier amounts was also done. 1 mg RuHex–3 mg AuNPs was used because it was able to simultaneously detect Pb2+ and Cd2+ at the parts per billion (ppb) level. This was also utilized in obtaining the calibration curve and limit of detection (LOD).To achieve the desired concentrations of the analyte, a serial dilution was done. A solution containing 10 mg PbCl2 and 10 mg CdCl2 was dissolved in two separate 100 mL deionized (D.I.) water. Aliquots of these metal solutions were diluted by pipetting them into the supporting electrolyte solution of 0.1 M. Lead (Pb2+) and cadmium (Cd2+) were simultaneously detected. All measurements were done with N2 sparging of the solution.
2.6. Sample preparation
9 different samples were examined. Three replicates or packs with various manufacturing batches per brand were obtained which made 27 samples in total. Those which were in powder form were digested by weighing 10 mg each and dissolving into 10 mL nitric acid (HNO3). Those which were in cream form, 10 mL of the coloring dye was mixed with 10 mL HNO3. The digested samples were hot-plated or heated up to the boiling point of HNO3 (∼80 °C) until all the HNO3 evaporated.2.7. Real sample analyses
To carry out real sample analyses, the residue from the acid digestion was dissolved in the electrolyte solution. This solution was sonicated for two hours to ensure homogenization. The heavy metal ions in the hair dye solution were then measured via ASV.2.8. Atomic absorption spectrometry (AAS)
Atomic absorption spectrometry (AAS) was carried out by preparing standard solutions with the following concentrations: 300 ppb, 350 ppb, 400 ppb, 450 ppb, 500 ppb, 550 ppb, 600 ppb, 650 ppb, 700 ppb and 750 ppb of lead and cadmium. These were chosen from the calibration curve obtained in ASV. The standard solutions used were also the ones scanned in ASV for the determination of the calibration curve. The AA-6300 Shimadzu Atomic Absorption Spectrophotometer apparatus was used. The nozzle was first submerged in a beaker containing distilled water to clean it and then used in the bottles containing the prepared standard solutions. With each concentration, the apparatus was allowed to stabilize for 10 seconds. A calibration curve was obtained. After scanning the standard solutions, the sample solutions were evaluated using AAS.3. Results and discussion
3.1. Reversibility and stability of the electrodes
The electrodes were characterized using cyclic voltammetry. Fig. 1 shows the cyclic voltammograms of the modified electrode. Both [Ru(NH3)6]3+ and AuNP amounts were varied to find the optimum concentration. The voltammograms showed reversible scans which can be attributed to the ability of [Ru(NH3)6]3+ to produce sigmoidal shaped cyclic voltammograms.24 Furthermore, it could also be inferred that the [Ru(NH3)6]3+ particles were successfully immobilized on the surface of the electrode which eased the transport of the electrons.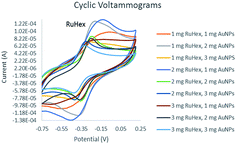 | ||
| Fig. 1 Cyclic voltammograms (CV) for varying amounts of electrode modifiers, AuNP and RuHex. Supporting electrolyte: 0.1 M NaCl solution; CV scan rate: 100 mV s−1. | ||
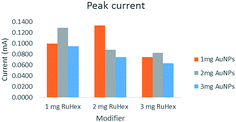
Fig. 2 shows the behavior of the anodic peak current versus the RuHex concentration where the 2 mg RuHex–1 mg AuNPs displayed the highest anodic current peak. The latter combination was deemed the best RuHex–AuNP ratio, i.e., 2![[thin space (1/6-em)]](https://www.rsc.org/images/entities/char_2009.gif) :
:![[thin space (1/6-em)]](https://www.rsc.org/images/entities/char_2009.gif) 1.
1.
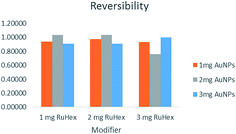
Reversibility of the voltammograms was computed by dividing the anodic peak (forward scan) by the cathodic peak (backward scan). The closest the quotient is to 1, the better because it means that the anodic and cathodic peaks are completely reversible. Fig. 3 shows that the concentrations that yielded the most reversible scans were 1 mg Ru[(NH3)6]3+–2 mg AuNPs, 2 mg Ru[(NH3)6]3+–2 mg AuNPs, and 3 mg Ru[(NH3)6]3+–3 mg AuNPs.
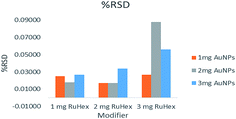
The stability of the fabricated electrodes (Fig. 4) could be determined by getting the relative standard deviation of the scans that were performed. 10 consecutive scans were done per modifier combination. These were then averaged. The relative standard deviation is equal to the standard deviation divided by the average of the ten scans. The closer the value is to zero, the better because it means that there were no or, if ever, only minimal changes in the observed data. The graphs show that the electrodes that have the least relative standard deviation are the 2 mg Ru[(NH3)6]3+–1 mg AuNPs, the 1 mg Ru[(NH3)6]3+–2 mg AuNPs, and the 2 mg Ru[(NH3)6]3+–2 mg AuNPs.
3.2. Anodic stripping voltammetry
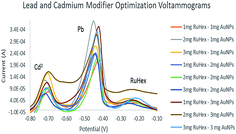
Fig. 5 shows the voltammograms obtained from ASV. Simultaneous detection of the heavy metals, lead and cadmium, was done with 10 ppm. It is evident that there were three peaks: Cd2+ (−0.65 V to −0.75 V), Pb2+ (−0.40 V to −0.50 V) and Ru[(NH3)6]3+ (−0.10 V to −0.30 V) when simultaneously detected. Lead has the highest peak which means that the electrodes are more sensitive in detecting lead than cadmium.The Pb2+ and Cd2+ metal solutions were scanned with electrodes of different electrode modifiers. 2 mg Ru[(NH3)6]3+–1 mg AuNPs was initially chosen to be the electrode that would be used in detecting lead and cadmium at lower concentrations since it was also the electrode chosen according to the cyclic voltammograms. However, upon scanning, the electrode was not able to detect Cd2+ at concentrations in the ppb level. Because of this, 1 mg Ru[(NH3)6]3+–3 mg AuNPs was chosen to be used for optimization. This concentration was able to detect Pb2+ as low as 50 ppb and Cd2+ at 200 ppb. It was used to obtain the calibration curve.
For the optimization of the deposition potential, deposition time, and accumulation potential, 1 mg Ru[(NH3)6]3+–3 mg AuNPs for Pb2+ and Cd2+ was used. These modifier concentrations for the said metals were employed for real sampling. Table 1 shows the anodic peak comparison with different combinations obtained in ASV.
| Modifier | Cadmium | Lead |
|---|---|---|
| Peak current (mA) | Peak current (mA) | |
| 1 mg RuHex–1 mg AuNPs | 0.077 | 0.212 |
| 2 mg RuHex–1 mg AuNPs | 0.125 | 0.377 |
| 3 mg RuHex–1 mg AuNPs | 0.155 | 0.271 |
| 1 mg RuHex–2 mg AuNPs | 0.091 | 0.241 |
| 2 mg RuHex–2 mg AuNPs | 0.095 | 0.220 |
| 3 mg RuHex–2 mg AuNPs | 0.069 | 0.235 |
| 1 mg RuHex–3 mg AuNPs | 0.112 | 0.352 |
| 2 mg RuHex–3 mg AuNPs | 0.162 | 0.316 |
| 3 mg RuHex–3 mg AuNPs | 0.094 | 0.330 |
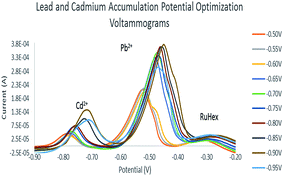
The accumulation potential was optimized in order to choose which potential will be applied in the scans. The best electrode that was obtained from the modifier optimization in ASV was used to determine which potential will give the highest peak current. Fig. 6 shows that −0.90 V exhibited the highest anodic current in Cd2+ and Pb2+. As the potential becomes more negative, the peak current increases and shifts to a more positive potential. This explains that more protons are being involved in the process. However, at −0.95 V cadmium and lead peaks decrease which means that the metal ions become saturated on the surface of the electrode.25 For accumulation time, 60 seconds was used. Table 2 shows the accumulation potentials with their corresponding peak current values.
| Accumulation potential (V) | Cadmium | Lead |
|---|---|---|
| −0.50 | 0.045 | 0.206 |
| −0.55 | 0.039 | 0.213 |
| −0.60 | 0.038 | 0.196 |
| −0.65 | 0.053 | 0.326 |
| −0.70 | 0.053 | 0.342 |
| −0.75 | 0.071 | 0.332 |
| −0.80 | 0.075 | 0.364 |
| −0.85 | 0.100 | 0.365 |
| −0.90 | 0.133 | 0.374 |
| −0.95 | 0.096 | 0.291 |
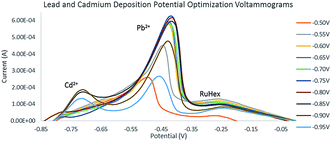
The minimum deposition potential was chosen to be −0.90 V. At potentials more positive than −0.85 V, no or small peaks of Cd2+ were found which could be attributed to the inability of more positive potentials to strip cadmium. The intensity of Pb2+ anodic peak began to decrease at potentials more positive than −0.90 V. Fig. 7 shows the deposition potential optimization voltammograms. The deposition potential was chosen to be −0.90 V since at more positive potentials, small peaks of Cd2+ were found (Table 3) which could be attributed to the inability of more positive potentials to strip cadmium. Since the relationship between the deposition time and peak current exhibited a linear relationship, 30 seconds was chosen for time efficiency.
| Deposition potential (V) | Cadmium | Lead |
|---|---|---|
| −0.50 | 0.000 | 0.259 |
| −0.55 | 0.000 | 0.448 |
| −0.60 | 0.018 | 0.582 |
| −0.65 | 0.014 | 0.589 |
| −0.70 | 0.025 | 0.581 |
| −0.75 | 0.025 | 0.627 |
| −0.80 | 0.055 | 0.615 |
| −0.85 | 0.173 | 0.595 |
| −0.90 | 0.186 | 0.477 |
| −0.95 | 0.133 | 0.266 |
3.3. Calibration curve
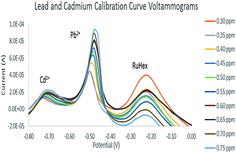
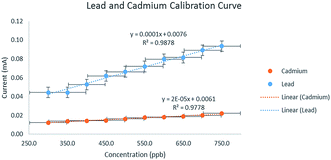
The voltammograms for the calibration curves are shown in Fig. 8. A simultaneous scan of the Pb2+–Cd2+ solution was done and ten concentration points were obtained (Fig. 9). There were no concentrations lower than 0.30 ppm because the electrode could only exhibit a well-defined Cd2+ peak from 0.30 ppm and above. The concentration increases monotonically with the peak current within the range of 0.30 ppm to 0.75 ppm. The calibration curves also displayed a correlation value of 0.9878 and 0.9778 for Pb2+ and Cd2+, respectively. This shows that there is a strong linear correlation between the heavy metal solution concentration and oxidation current.3.4. Electrode sensitivity
The calibration sensitivity for Pb2+ and Cd2+ are 1.16 × 10⁻⁴ and 2.04 × 10⁻⁴, respectively. Of the three metals, Pb2+ has the steepest slope which means that the electrode fabricated in this study is most sensitive in detecting this heavy metal as opposed to Cd2+. Analytical sensitivity of the electrode can be seen in Table 4.| Conc. (ppb) | Mean value of S (mA) | Slope of the line (mA ppb−1) | Standard deviation (mA) | Analytical sensitivity (ppb−1) | ||||
|---|---|---|---|---|---|---|---|---|
| Cd | Pb | Cd | Pb | Cd | Pb | Cd | Pb | |
| 300.00 | 0.0013 | 0.0443 | 2.04 × 10⁻⁵ | 1.16 × 10⁻⁴ | 0.00220 | 0.000471 | 0.00926 | 0.2462 |
| 350.00 | 0.0138 | 0.0444 | 2.04 × 10⁻⁵ | 1.16 × 10⁻⁴ | 0.00362 | 0.00368 | 0.0056 | 0.0315 |
| 400.00 | 0.0143 | 0.0528 | 2.04 × 10⁻⁵ | 1.16 × 10⁻⁴ | 0.00166 | 0.00249 | 0.0123 | 0.0465 |
| 450.00 | 0.0146 | 0.0619 | 2.04 × 10⁻⁵ | 1.16 × 10⁻⁴ | 0.00256 | 0.00262 | 0.00797 | 0.0442 |
| 500.00 | 0.0163 | 0.0663 | 2.04 × 10⁻⁵ | 1.16 × 10⁻⁴ | 0.00163 | 0.00531 | 0.0125 | 0.0218 |
| 550.00 | 0.0176 | 0.0719 | 2.04 × 10⁻⁵ | 1.16 × 10⁻⁴ | 0.000721 | 0.00125 | 0.0283 | 0.0930 |
| 600.00 | 0.0183 | 0.0796 | 2.04 × 10⁻⁵ | 1.16 × 10⁻⁴ | 0.00292 | 0.00419 | 0.00699 | 0.0277 |
| 650.00 | 0.0189 | 0.0814 | 2.04 × 10⁻⁵ | 1.16 × 10⁻⁴ | 0.00161 | 0.00205 | 0.0126 | 0.0565 |
| 700.00 | 0.0199 | 0.0891 | 2.04 × 10⁻⁵ | 1.16 × 10⁻⁴ | 0.00197 | 0.00772 | 0.0103 | 0.0150 |
| 750.00 | 0.0222 | 0.0935 | 2.04 × 10⁻⁵ | 1.16 × 10⁻⁴ | 0.00220 | 0.00205 | 0.00927 | 0.0565 |
3.5. Real sample analyses
Nine triplicate samples with various batches were analyzed using ASV. The concentration of Pb2+ is shown in Table 5. All the samples manufactured in country I, i.e., samples I1, I2, and I3, contained Pb2+ with concentrations lower than the standard set by the Bureau of Indian Standards (BIS) under Rule 134 of the Drugs and Cosmetics Rules which states that any cosmetic products containing dyes, colors and pigment should have Pb2+ concentrations lower than 20![[thin space (1/6-em)]](https://www.rsc.org/images/entities/char_2009.gif) 000 ppb [20 parts per million (ppm)] and 100
000 ppb [20 parts per million (ppm)] and 100![[thin space (1/6-em)]](https://www.rsc.org/images/entities/char_2009.gif) 000 ppb (10 ppm) of other metals.25
000 ppb (10 ppm) of other metals.25
| Sample | Color | Rep. | Batch no. | Lead | Cadmium | ||||
|---|---|---|---|---|---|---|---|---|---|
| Current (mA) | ASV conc. (ppb) | AAS conc. (ppb) | Current (mA) | ASV conc. (ppb) | AAS conc. (ppb) | ||||
| C | Black | A | AC-FPZ-785 | 0.0805 | 468.16 | 265.85 | N.D. | — | |
| B | AC-FPZ-787 | 0.0489 | 265.27 | 263.85 | |||||
| C | AC-FPZ-789 | 0.0514 | 280.94 | 266.25 | |||||
| F | Black | A | 2K024 | 0.0390 | 201.83 | 261.84 | N.D. | — | |
| B | 74M800 | 0.0413 | 216.41 | 266.25 | |||||
| C | 53P463 | 0.0274 | 127.23 | 260.24 | |||||
| I1 | Black henna | A | 861 | 0.0295 | 140.39 | 226.58 | N.D. | — | |
| B | 860 | 0.0325 | 159.78 | 228.98 | |||||
| C | 862 | 0.0306 | 147.77 | 230.19 | |||||
| I2 | Black henna | A | 31 | 0.0500 | 272.01 | 231.39 | N.D. | — | |
| B | 30 | 0.0000 | 179.36 | 231.39 | |||||
| C | 33 | 0.0275 | 127.61 | 230.19 | |||||
| I3 | Black henna | A | 25 | 0.0939 | 312.27 | 237.80 | N.D. | — | |
| B | 27 | 0.0718 | 412.17 | 492.26 | |||||
| C | 30 | 0.0328 | 162.09 | 488.65 | |||||
| K | Black | A | SS0129 | 0.0562 | 365.05 | 354.51 | N.D. | — | |
| B | SS0509 | 0.0386 | 198.94 | 239.80 | |||||
| C | SS0694 | 0.0286 | 134.80 | 234.99 | |||||
| P1 | Black | A | 160201A | 0.0704 | 403.51 | 251.42 | N.D. | — | |
| B | 160603B | 0.0259 | 117.53 | 251.82 | |||||
| C | 160835C | 0.0394 | 203.89 | 257.84 | 26.65 | 618.06 | −121.31 | ||
| P2 | Burgundy | A | MK/IG/05 | 0.1321 | 799.40 | 326.36 | N.D. | — | |
| B | MK/IG/11 | N.D. | 333.57 | ||||||
| C | MK/IG/25 | 0.0434 | 230.08 | 321.55 | 17.81 | 352.02 | −97.41 | ||
| T | Brown black | A | 5212 | 0.0323 | 158.75 | 212.15 | N.D. | — | |
| B | 7255 | 0.0394 | 204.47 | 215.76 | |||||
| C | 9636 | 0.0239 | 104.75 | 212.15 | |||||
From Table 5, the sample with the highest lead content was sample P2 with 700 ppb with sample C1 coming in second with 464 ppb. Cadmium was detected in sample P1 with 618 ppb and in sample P2 with 352 ppb.
Lead and its compounds are banned in the European Union according to Regulation (EC) No 1123/2009 of the European Parliament and of the Council of 30 November 2009 on cosmetics products under Annex II: List of Substances Prohibited in Cosmetic Products.26 A compound of lead, lead acetate, is prohibited in hair dyes in ASEAN countries under ASEAN Cosmetics Directory (ACD) Annex II, but in Thailand it is listed as a restricted ingredient only and according to The Thai National Cosmetic Committee, it is allowed at concentrations lower than 0.6% or 6000 ppm.27 The China Food and Drug Administration (CFDA) limits the use of lead in cosmetics at concentrations higher than 20 ppm.28 In the Philippines, lead is listed as a substance which must not form part of the composition of cosmetic products. Lead acetate which is used as a colorant should not exceed 6000 ppm according the Bureau of Food and Drugs under Bureau Circular No. 19-A series of 1997, Section III; Table 1: Restricted Ingredients.29 Korea prohibits the manufacturing of cosmetics with lead content.30 The World Health Organization (WHO) established the tolerable level of lead intake as 10 ppb.31
4. Conclusion
Hexaammineruthenium(III), gold nanoparticles, and Nafion® solution were successfully deposited on the surface of a glassy carbon electrode. The modified GCE was sensitive enough to detect traces of lead and cadmium in hair dye samples using ASV. To obtain the calibration curve for lead and cadmium, 1 mg Ru[(NH3)6]3+–3 mg AuNPs and 2 mg Ru[(NH3)6]3+–2 mg AuNPs were used in all the measurements. The peak current and heavy metal concentration showed a linear relationship from 0.30 ppm to 0.75 ppm for Pb2+ and Cd2+. The limits of detection for Pb2+ and Cd2+ were 0.045 ppm and 0.20 ppm, respectively. Lead was detected in all the samples in this study which were manufactured in five countries, four in Asia and one in Europe.References
- S. Palanisamy, A. P. Shanmugam and S. Subramaniam, Int. J. Med. Sci. Public Health, 2013, 2, 757, DOI:10.5455/ijmsph.2013.2.480-482.
- Z. L. Wei, Y. K. Rui and L. Shen, Effects of hair dye on heavy metal content of hair, September 2008, retrieved from http://www.ncbi.nlm.nih.gov/pubmed.19093590%26ved=0CBoQFjAA%26usg=AFQjCNEIRFbHLApcYsT26ulZeNx7hKyVIA Search PubMed.
- A. Fauci, Harrison's Principle of Internal Medicine, McGraw-Hill Professional, New York, USA, 2008 Search PubMed.
- P. Tchounwou, C. Yedjou, A. Patlolla and D. Sutton, EXS, 2014, 101, 133 Search PubMed.
- Lead poisoning and health, World Health Organization (2016), Geneva, Switzerland, Retrieved August 8, 2016 from http://www.who.int/mediacentre/factsheets/fs379/en/.
- A. Bernard, Indian J. Med. Res., 2008, 128, 557 CAS.
- D. Tobin, Hair in Toxicology: An Important Bio-monitor, The Royal Society of Chemistry, Cambridege, United Kingdom, 2005 Search PubMed.
- N. Ozbek and S. Akman, Regul. Toxicol. Pharmacol., 2016, 79, 49 CrossRef CAS PubMed.
- N. Lekouch, Sci. Total Environ., 2001, 280, 39 CrossRef CAS PubMed.
- R. Khani, E. Ghiamati, R. Boroujerdi, A. Rezaeifard and M. Zaryabi, Spectrochim. Acta, Part A, 2016, 163, 120 CrossRef CAS PubMed.
- R. Alkire, D. Kolb and J. Lipkowski, Chemically Modified Electrodes, Wiley-VCH, Weinheim, Germany, 2009 Search PubMed.
- Chemically Modified Electrodes (1994), Retrieved February 24, 2014 from http://www.oai.dtic.mil/oai/oai?verb=getRecord%26metadataPrefix=html%26identifier=ADA279821.
- S. Palisoc, B. Tuason and M. Natividad, Optoelectron. Adv. Mat., 2015, 9, 1435 CAS.
- K. Kaw, S. Palisoc and M. Natividad, Philipp. Sci. Lett., 2014, 7, 171 Search PubMed.
- S. Palisoc, M. Natividad, F. Co and K. Kaw, Optoelectron. Adv. Mat., 2015, 9(2015), 1010 CAS.
- S. Palisoc, M. Natividad, N. Martinez, R. Ramos and K. Kaw, e-Polym., 2015, 16, 117 Search PubMed.
- S. Palisoc, M. Natividad, P. DeVera and B. Tuason, Philipp. Sci. Lett., 2014, 7, 372 Search PubMed.
- S. Palisoc, M. Natividad, P. DeVera and B. Tuason, J. New Mater. Electrochem. Syst., 2014, 17, 205 CAS.
- S. Palisoc, M. Natividad, D. Calde and E. Rosopa, J. New Mater. Electrochem. Syst., 2016, 19, 223 Search PubMed.
- S. Palisoc, N. Valeza and M. Natividad, Int. J. Electrochem. Sci., 2017, 12, 3859 CrossRef.
- F. Tseliou, A. Avgeropoulos, P. Falaras and M. Prodromidisteratures, Electrochim. Acta, 2017, 231, 230 CrossRef CAS.
- G. Jin, S. Xu, P. Lei, Y. Fu, X. Feng, Z. Wu, M. Yu, S. Dai and G. Li, Electrochim. Acta, 2014, 130, 526 CrossRef CAS.
- L. Xiao, B. Wang, L. Ji, F. Wang, Q. Yuan, G. Hu, A. Dong and W. Gan, Electrochim. Acta, 2016, 222, 1371 CrossRef CAS.
- S. Siraj, C. McRae and D. Wong, Electrochem. Commun., 2016, 64, 35 CrossRef CAS.
- S. Mukdasai, V. Langsi, M. Pravda, S. Srijanaranai and J. Glennon, Sens. Actuators, B, 2016, 236, 126 CrossRef CAS.
- European Union Law. (2009), Regulation (EC) No 1223/2009 of the European Parliament and of the council of 30 November 2009 on cosmetic products, Retrieved August 10, 2016 from http://www.eur-lex.europa.eu/eli/reg/2009/1223/2014-08-29.
- N. Jinachai and P. Anantachoti, IOSR Journal of Humanities and Social Science, 2014, 19, 46 CrossRef.
- R. Ng and H. Beedham, The journal of the LEAD (Lead Education and Abatement Design), Group Inc, 2011, vol. 11, p. 3 Search PubMed.
- Department of Health, Bureau of Food and Drugs, (4 September 1997), 1997 Updated Listing of Cosmetic Ingredients, Retrieved August 10, 2016 from http://www.fda.gov.ph/attachments/article/28771/bc%2012%20s%201997.pdf.
- National Chemicals Information System, (2008) Restricted Chemicals, Retrieved August 10, 2016 from http://www.ncis.nier.go.kr/totinfo/TotInfoList.jsp?pageNo=1%26sub=02%26searchMode=0%26searchCategory=cate%26searchType=%26searchValue=%26mode=%26searchCategory_ko=02.
- Exposure to Lead: A Major Public Health Concern, World Health Organization (2010), Geneva, Switzerland, Retrieved August 10, 2016 from http://www.who.int/ipcs/features/lead.pdf.
| This journal is © The Royal Society of Chemistry 2017 |

