 Open Access Article
Creative Commons Attribution 3.0 Unported Licence
Highly sensitive poisoning-resistant optical carbon dioxide sensors for environmental monitoring
Eva
Fritzsche
a,
Pia
Gruber
a,
Susanne
Schutting
a,
Jan P.
Fischer
b,
Martin
Strobl
a,
Jens D.
Müller
c,
Sergey M.
Borisov
*a and
Ingo
Klimant
a
aInstitute of Analytical Chemistry and Food Chemistry, Graz University of Technology, Stremayrgasse 9/II, 8010 Graz, Austria. E-mail: sergey.borisov@tugraz.at
bPyroScience GmbH, Hubertusstraße 35, 52064 Aachen, Germany. E-mail: fischer@pyro-science.com
cDepartment of Marine Chemistry, Leibniz Institute for Baltic Sea Research Warnemünde, Seestraße 15, 18119 Rostock, Germany. E-mail: jens.mueller@io-warnemuende.de
First published on 29th November 2016
Abstract
A new optical carbon dioxide sensor for environmental monitoring is presented. It combines a robust and long-term stable sensing material with a compact read-out device. The sensing material relies on a NIR pH indicator immobilized into ethyl cellulose along with a quaternary ammonium base. The perfluorinated polymer Hyflon AD 60 used as a protection layer significantly enhances the long-term and mechanical stability of the sensor foils, as well as the robustness against poisoning gases, e.g. hydrogen sulfide. The sensor can be stored under ambient conditions for more than six weeks, whereas sensors covered with silicone rubber deteriorate within one week under the same conditions. The complete sensor device is applicable after a three-point (re)calibration without a preconditioning step. The carbon dioxide production and consumption of the water plant Egeria densa was measured in the laboratory. Furthermore, results of profiling carbon dioxide measurements during a research cruise on the Baltic Sea at water depths up to 225 m are presented.
1. Introduction
Carbon dioxide is an analyte with great impact on the marine ecosystem. Since the industrialization, started in the late 18th century, the atmospheric level of carbon dioxide increased by about 40% due to fossil-fuel burning or deforestation. More than a half of the anthropogenically produced CO2 is taken up by the ocean.1 The rising amount of carbon dioxide in seawater causes a reduction of the pH (ocean acidification) and lower carbonate saturation in surface waters.2 The air–sea-exchange is driven by the difference in the partial pressure of carbon dioxide. The dissolved CO2 equilibrates with bicarbonate and carbonate ions. The carbonate system itself is characterized by four measurable parameters: pH, TA (total alkalinity), DIC (dissolved inorganic carbon) and fCO2 (fugacity of carbon dioxide). The complete system is determined when two of these parameters and the equilibrium constants, which are salinity and temperature dependent, are known.3Common analytical techniques for measuring carbon dioxide in seawater directly are IR spectroscopy, the Severinghaus electrode and optical chemosensors. The sensors based on IR spectroscopy rely on diffusion of the analyte molecules through a gas-permeable membrane into an internal gas chamber and the direct measurement of the absorption of the analyte. The sensors are very robust but show interference by water vapour,4 condensation of which can present a serious problem. Nevertheless, several IR carbon dioxide sensors have been commercialized for marine applications (CO2-Pro CV™, Pro-Oceanus Systems Inc., Canada; HydroC® CO2, Kongsberg Maritime Contros GmbH, Germany).
The Severinghaus electrode shows interferences from electromagnetic fields and is prone to drifts due to osmotic pressure effects.5 A similar design was adapted for use of an optical transducer representing a solution of a pH indicator in a bicarbonate buffer. A commercially available sensor for aquatic CO2 measurements (SAMI CO2, Sunburst Sensors, LLC, USA) consists mainly of a membrane equilibrator connected to a fiber optic flow cell. The ambient seawater carbon dioxide diffuses through a gas-permeable membrane (silicone rubber) and changes the color of the bromothymol blue indicator due to a change in the pH of the buffer.6–8 However, the device is bulky since the indicator solution has to be renewed for each measurement, which can be particularly critical for long-term trials due to the high volume of the reagent needed and the waste which has to be stored or released to the environment. Moreover it demonstrates high energy consumption due to pumping and moving parts, which are prone to breakage. On the other hand, the advantage of the approach includes high resistance to drift due to renewal of the solution.
In the last decades optical carbon dioxide chemosensors (optodes) became increasingly popular.9–12 Although several new concepts of optical carbon dioxide sensors have been proposed recently such as using viscosity or polarity-sensitive dyes as transducers,11,13,14 the so-called “plastic type” sensors remain most popular.15–19 These sensors are based on a pH-sensitive indicator dye embedded in a polymer matrix along with a lipophilic quaternary ammonium base. The dye changes its spectral properties according to the degree of protonation induced by carbon dioxide. A wide range of indicators have been reported but only a few show favorable optical properties, high photostability and sensitivity sufficient for measuring accurately at atmospheric levels of CO2. Fluorescent sensors also require a reference luminophore to obtain reliable results. In most cases an analyte-insensitive reference dye which possesses a different emission spectrum (ratiometric 2-wavelength measurement) or a different luminescence decay time (Dual Lifetime Referencing) is used.20–23 By far, hydroxypyrene trisulfonate (HPTS) has been the most popular fluorescent indicator.9,22,24,25 Unfortunately, the brightness, photostability and the sensitivity of these sensors are far from being optimal.
Recently reported BF2-chelated tetraarylazadipyrromethene indicators (aza-BODIPYs) represent a promising alternative.26–28 These highly photostable dyes absorb and emit in the near-infrared region of the electromagnetic spectrum which is beneficial due to low levels of autofluorescence and availability of low cost excitation sources and photodetectors. Colorimetric aza-BODIPY indicators were demonstrated to be very promising for the design of carbon dioxide sensors with a tunable dynamic range.28
These (and other) promising indicators published recently enable greater flexibility of choice with respect to optical properties, photostability and sensitivity. However, comparably little effort has so far been put into improving the long-term stability of the CO2 optodes. Low stability of the sensing materials hinders application of this promising technology in oceanography and many other fields.
For example, the optode presented by Atamanchuk et al. 2014 (ref. 23) showed sufficient stability only after preconditioning over several months during which the indicator lost most of the original signal. Moreover, the calibration was time consuming and complicated, the sensor has to be stored in an aqueous solution and complete poisoning by hydrogen sulfide (cH2S = 175 μmol L−1) was observed within 3 hours.
In this contribution we present a chemically and photochemically robust, long-term stable sensing material, based on a highly sensitive di-OH-aza-BODIPY indicator dye. It will be shown that the new sensing material is highly promising for in situ applications in marine biology and oceanography.
2. Materials and methods
2.1. Chemicals and materials
Ethyl cellulose (EC49, ethoxyl content 49%), m-cresol purple (indicator grade), tetraoctylammonium hydroxide solution (TOAOH, 20% in methanol), and sodium sulfate (anhydrous) were received from Sigma-Aldrich. Toluene, potassium carbonate, potassium dihydrogen phosphate (99%, water free) and tetrahydrofuran (THF) were purchased from Carl Roth GmbH + Co. KG. 1H,1H,2H,2H-Perfluorooctyldimethylchlorosilane (97%), vinyldimethylsiloxy-terminated polydimethylsiloxane (viscosity 1000 cSt), methylhydrosiloxane–dimethylsiloxane copolymer (25–35 cSt), 1,3,5,7-tetravinyl-1,3,5,7-tetramethyl-cyclotetrasiloxane (97%) (delayer) and platinum–divinyltetramethyldisiloxane complex in vinyl terminated polydimethylsiloxane (3–3.5% Pt) (catalyst) were obtained from ABCR GmbH. Hyflon AD 60 was acquired from Solvay GmbH, Teflon AF 1600 from DuPont de Nemours GmbH and Cytop 809 A from AGC Chemicals. Anhydrous ethanol was purchased from Merck. Sodium bicarbonate and cyclohexane were received from VWR. A poly(ethylene naphthalate) (PEN) support Teonex Q51 and poly(ethylene terephthalate) (PET) support Melinex 505 were received from Pütz GmbH + Co. Folien KG. The FireStingO2 and an oxygen sensor (OXR 230-0, oxygen retractable microsensor) were acquired from PyroScience GmbH. Optical plastic fibres were obtained from Ratioplast-Optoelectronics GmbH. Perfluorodecalin (PFD, 98%; cis and trans, ABCR) was washed with a 1 M aqueous solution of K2CO3 prior to use. Synthesis of 4,4′-(5,5-difluoro-1,9-diphenyl-5H-4λ4,5λ4-dipyrrolo-[1,2-c:2′,1′-f][1,3,5,2]triazaborinine-3,7-diyl)diphenol (di-OH-aza-BODIPY) and staining of polystyrene-microparticles (PS-particles) with 3,7-bis(4-butoxyphenol)-5,5-difluoro-1,9-diphenyl-5H-4λ4,5λ4-dipyrrolo-[1,2-c:2′,1′-f] [1,3,5,2]triazaborinine (di-butoxy-complex) were performed according to Schutting et al. 2015.28 Silanized Egyptian blue was produced analogously to the literature procedure29 but using 1H,1H,2H,2H-perfluorooctyldimethylchlorosilane instead of trimethylchlorosilane. The engraving pen used was a MICROMOT 50/E with a 2 mm mounted point made of fused aluminium oxide from PROXXON GmbH. The temperature control was performed with a cryostat F12 from Julabo GmbH. The pH was determined with a pH meter SevenEasy combined with a pH electrode InLab Routine Pro from METTLER-TOLEDO GmbH.2.2. Preparation of sensor foils
![[thin space (1/6-em)]](https://www.rsc.org/images/entities/char_2009.gif) :
:![[thin space (1/6-em)]](https://www.rsc.org/images/entities/char_2009.gif) ethanol mixture (6
ethanol mixture (6![[thin space (1/6-em)]](https://www.rsc.org/images/entities/char_2009.gif) :
:![[thin space (1/6-em)]](https://www.rsc.org/images/entities/char_2009.gif) 4 w/w). The viscous solution was flushed with carbon dioxide and 100 μL of tetraoctylammonium hydroxide solution (20% w/w TOAOH in methanol) was added. The “cocktail” was knife coated onto a PET foil to obtain a sensing film with a thickness of ∼3 μm after evaporation of the solvents. The protection layers (thickness ∼ 8 μm) were prepared by coating solutions of the corresponding polymers (100 mg of Teflon AF 1600 or Hyflon AD 60 in 1.9 g PFD or Cytop 809 A solution (9% wt.) in an unspecified perfluorinated solvent used as received from AGC Chemicals). Silicone rubber was prepared by mixing of 500 μL vinyl-terminated polydimethylsiloxane, 500 μL cyclohexane, 20 μL methylhydrosiloxane–dimethylsiloxane copolymer, 2 μL delayer and 3.5 μL catalyst and polymerization of this mixture after coating and evaporation of the solvent. For the stability tests, the thickness of the silicone rubber layer was 13.5 μm.
4 w/w). The viscous solution was flushed with carbon dioxide and 100 μL of tetraoctylammonium hydroxide solution (20% w/w TOAOH in methanol) was added. The “cocktail” was knife coated onto a PET foil to obtain a sensing film with a thickness of ∼3 μm after evaporation of the solvents. The protection layers (thickness ∼ 8 μm) were prepared by coating solutions of the corresponding polymers (100 mg of Teflon AF 1600 or Hyflon AD 60 in 1.9 g PFD or Cytop 809 A solution (9% wt.) in an unspecified perfluorinated solvent used as received from AGC Chemicals). Silicone rubber was prepared by mixing of 500 μL vinyl-terminated polydimethylsiloxane, 500 μL cyclohexane, 20 μL methylhydrosiloxane–dimethylsiloxane copolymer, 2 μL delayer and 3.5 μL catalyst and polymerization of this mixture after coating and evaporation of the solvent. For the stability tests, the thickness of the silicone rubber layer was 13.5 μm.
![[thin space (1/6-em)]](https://www.rsc.org/images/entities/char_2009.gif) :
:![[thin space (1/6-em)]](https://www.rsc.org/images/entities/char_2009.gif) ethanol mixture (6
ethanol mixture (6![[thin space (1/6-em)]](https://www.rsc.org/images/entities/char_2009.gif) :
:![[thin space (1/6-em)]](https://www.rsc.org/images/entities/char_2009.gif) 4 w/w) was flushed with carbon dioxide. This was followed by the addition of 100 μL tetraoctylammonium hydroxide solution (20% w/w TOAOH in methanol). 0.75 μL of this “cocktail” was pipetted on pre-cut spots (diameter of 5 mm) of a roughened, dust-free PEN support. After evaporation of the solvent, a sensing film with ∼2 mm in diameter and ∼14 μm thickness was obtained. For the second “cocktail” 50 mg Hyflon AD 60 was dissolved in 0.935 g PFD and 25 mg Egyptian blue powder and 25 mg stained PS-particles were added and dispersed homogenously. 0.75 μL of the second “cocktail” was pipetted right on top of the sensing film. The estimated thickness after evaporation of the solvent was ∼6 μm. Finally, the sensor spot was covered with a protective layer (thickness of ∼1.7 μm) prepared from the solution of 100 mg Hyflon AD 60 in 2.22 g perfluorodecalin (washed with a solution of K2CO3 prior to use).
4 w/w) was flushed with carbon dioxide. This was followed by the addition of 100 μL tetraoctylammonium hydroxide solution (20% w/w TOAOH in methanol). 0.75 μL of this “cocktail” was pipetted on pre-cut spots (diameter of 5 mm) of a roughened, dust-free PEN support. After evaporation of the solvent, a sensing film with ∼2 mm in diameter and ∼14 μm thickness was obtained. For the second “cocktail” 50 mg Hyflon AD 60 was dissolved in 0.935 g PFD and 25 mg Egyptian blue powder and 25 mg stained PS-particles were added and dispersed homogenously. 0.75 μL of the second “cocktail” was pipetted right on top of the sensing film. The estimated thickness after evaporation of the solvent was ∼6 μm. Finally, the sensor spot was covered with a protective layer (thickness of ∼1.7 μm) prepared from the solution of 100 mg Hyflon AD 60 in 2.22 g perfluorodecalin (washed with a solution of K2CO3 prior to use).
2.3. Comparison of protection polymers
The response and protective properties of planar optodes with different layers (silicone rubber, Teflon AF 1600, Hyflon AD 60, Cytop 809 A) and m-cresol purple as the indicator were investigated in 0.1 mol L−1 phosphate buffer. The absorption measurements were recorded on a Cary 50 UV-Vis spectrophotometer (Varian) at 600 nm. The response and recovery times of the optodes were determined between an air saturated phosphate buffer (0.04% CO2 ≈ 13.5 μmol L−1) and 10% CO2 (≈3320 μmol L−1) at 23 °C. The protective properties of the polymers were investigated by placing the planar optode in a closed cuvette and adding 200 μL of 12 M hydrochloric acid to the bottom of the cell. The poisoning experiments with hydrogen sulfide were performed in a constantly stirred cuvette, filled with 0.1 mol L−1 aqueous phosphate buffer (pH 7.75, S = 35‰) equilibrated with the ambient air and 270 μmol L−1 total sulfide.2.4. Instrumentation
The read-out of the sensors based on the aza-BODIPY indicator was performed with a compact four channel FireStingO2 reader (PyroScience GmbH, Aachen). The sensors were attached to the distal end of 10 cm-long plastic optical fibres (10 cm). The measurements were performed with the following settings of the FireSting instrument: LED intensity of 30%, an amplification of 400×, a measuring time of 16 ms and a modulation frequency of 2000 Hz. The measuring interval varied between 3 and 10 seconds, corresponding to the experiment and temperature. Field experiments were made with a modified FireStingO2 reader in a pressure resistant housing provided by PyroScience.2.5. Calibration procedure
For the calibration of the carbon dioxide sensors a 0.1 mol L−1 phosphate buffer with a pH of 7.7 was used. The sensors were inserted into a temperature-controlled, constantly stirred vessel (Glasfachhandel Ochs, Germany) and connected to the read-out device. To obtain a calibration curve, individual sensors were measured at 8 different pCO2 levels. A calibration was determined for two temperature ranges: (1) 4–10 °C and (2) 10–35 °C. The rising levels of carbon dioxide were obtained by adding hydrogen bicarbonate solution to the phosphate buffer. The amount of pCO2 was calculated with the following equation: | (1) |
The equilibrium constants were determined according to Roy et al. 1993.30 These constants were suitable for temperatures between 0 and 45 °C, as well as for salinities between 5 and 45. For the calculation it was necessary to consider the pH, temperature, salinity, the sample volume and the concentration of the sodium bicarbonate solution. The calibration was acquired for carbon dioxide levels between 3 μmol L−1 (∼52 μatm) and 8300 μmol L−1 (∼145![[thin space (1/6-em)]](https://www.rsc.org/images/entities/char_2009.gif) 000 μatm). Prior to calibration, the phosphate buffer was flushed with nitrogen for several hours until a stable signal was reached. In the next step sodium bicarbonate solution was added and the spots interrogated until a plateau was obtained. This procedure was repeated for each point of the calibration curve. A three-point calibration (∼18 μmol L−1, ∼87 μmol L−1, ∼10
000 μatm). Prior to calibration, the phosphate buffer was flushed with nitrogen for several hours until a stable signal was reached. In the next step sodium bicarbonate solution was added and the spots interrogated until a plateau was obtained. This procedure was repeated for each point of the calibration curve. A three-point calibration (∼18 μmol L−1, ∼87 μmol L−1, ∼10![[thin space (1/6-em)]](https://www.rsc.org/images/entities/char_2009.gif) 000 μmol L−1T = 8 °C) was performed before the in situ experiments.
000 μmol L−1T = 8 °C) was performed before the in situ experiments.
2.6. Response and recovery time
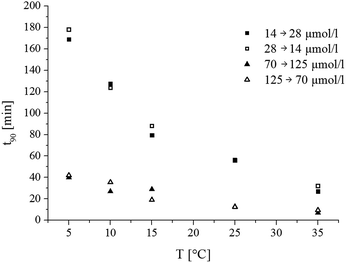
The response and recovery times were determined for a low and a high carbon dioxide concentration at five different temperatures (5–35 °C). The sensors were moved from a temperature-controlled, constantly stirred (∼540 rpm) vessel with ∼14 μmol L−1 CO2 to a vessel with ∼28 μmol L−1 and back, as well as from a flask with ∼70 μmol L−1 CO2 to one with ∼125 μmol L−1 CO2 and back.2.7. Long-term stability
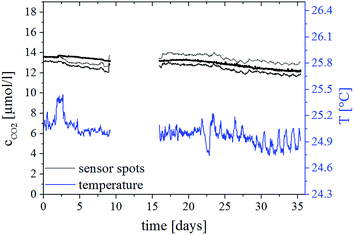
The long-term stability was investigated in the gas phase and in water using the planar optodes with m-cresol purple as an indicator. The poisoning effects of ambient air under different storage conditions were compared. The foils were stored in the dark to avoid photobleaching and were photographed each day and the absorption spectrum of the indicator was measured every 7 days. The long-term stability of carbon dioxide sensors based on di-OH-aza-BODIPY was investigated in aqueous phosphate buffer (constantly stirred, temperature ∼ 24 °C), which was equilibrated with ambient air with a measurement interval of 1 h over 35 days.2.8. Applications
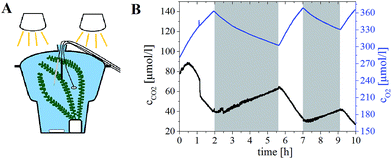
The applicability of the new pCO2 sensing material was investigated in a lab experiment with the water plant Egeria densa. The respiration behaviour in the absence and presence of light was measured. The plant, an oxygen sensor, a temperature sensor and a carbon dioxide sensor based on di-OH-aza-BODIPY with a glass support were inserted in a constantly stirred desiccator completely filled up with tap water. The illumination was provided by two halogen lamps (photosynthetic photon flux density ∼ 250 μmol s−1 m−2).The carbon dioxide sensors were also applied in the research cruise ‘PROSID 2014’, which took place at the Gulf of Finland and Central Baltic Sea in October 2015. The depth profiles were acquired with a continuous and a stepwise movement of the carrier. The pCO2 values were calculated only for the stepwise profiles. Two stations were investigated: Gotland deep (TF_271, 57.32088°N/20.05341°E) and Gulf of Finland (GoF_7, 59.56354°N/24.88670°E). The sampling depths were chosen to cover large pCO2 gradients, which were inferred from the hydrographical conditions at each site. The depths were at TF_271 20 m, 100 m, 125 m, 200 m, 225 m and at GoF_7 20 m, 40 m, 55 m and 70 m. The carbon dioxide sensors were recalibrated during the cruise.
2.9. Reference data for the profiling experiments
For the validation of the results obtained from the deployed carbon dioxide sensors discrete water samples were taken manually from a Niskin water sampler at both stations. At each depth two samples (250 mL) were taken. The samples were poisoned with saturated mercury chloride (100 μL) right after sampling. For each water probe TA, DIC and pH were determined. The pH was measured spectrophotometrically at 25 °C with m-cresol purple as the indicator dye.31 DIC was obtained by using the SOMMA system (Single Operator Multi-parameter Metabolic Analyzer) at 15 °C.32 TA of the water probe was determined by an open-cell titration at 20 °C.32 A software (CO2SYS) developed by Lewis and Wallace 1998 (ref. 33) was chosen to calculate the partial pressure of carbon dioxide from DIC and pH values.3. Results and discussion
3.1. Measurement principle
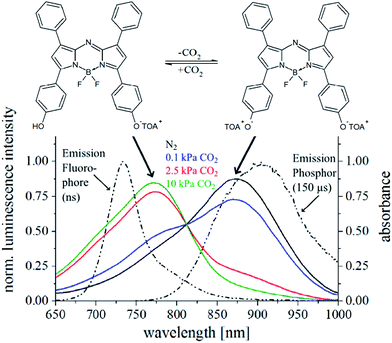
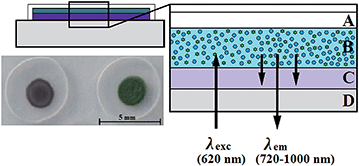
The recently reported di-OH-aza-BODIPY indicator dyes28 are promising candidates for the measurement of carbon dioxide, especially at low concentrations (below the atmospheric level). Particularly the absorption in the near infrared region and the well separated absorption maxima for the mono-anionic and di-anionic forms (Fig. 1) allow the use of the compact FireSting phase fluorometer for read-out of the sensors. To convert this colorimetric system into a luminescence-based system, the inner-filter effect was used. A two layer system (Fig. 2) consists of: (i) the indicator dye and quaternary ammonium base TOAOH embedded in ethyl cellulose (CO2-sensitive layer) and (ii) the polymer layer with inert light emitting reference particles (combination of phosphorescent Egyptian blue29 microparticles and PS-particles doped with the fluorescent pH-insensitive di-butoxy-aza-BODIPY dye). The emission spectra of Egyptian blue (λmax 900 nm) and the fluorescent dye (λmax 725 nm) overlap with the absorption maxima of the di- (λmax 805 nm) and mono-anionic (λmax 745 nm) forms of the di-OH-aza-BODIPY indicator dye, respectively (Fig. 1). Both the phosphor and the fluorophore are excited by a red LED (620 nm) and the emitted phosphorescence or fluorescence is absorbed by the indicator dye depending on the concentration of carbon dioxide (Fig. 1 and 2). Since at 2000 Hz, the luminescence phase shift of the phosphor is 55° and that of the fluorophore is 0°, the change in pCO2 is converted to the changes in the luminescence phase shift thus enabling ratiometric referenced read-out.3.2. Support material
The selection of the support and its pretreatment mainly influence the recovery time and the mechanical robustness of the planar optode. The chosen materials should have low permeability for carbon dioxide to accelerate the recovery time. A transparent poly(ethylene terephthalate) (PET) foil is frequently a support of choice for optodes. Another promising material is poly(ethylene naphthalate) (PEN), which has similar mechanical properties. Both polymers have similar solubilities for carbon dioxide (S0 = 8.3 ± 2.9 cm3 (STP) cm−3 bar−1 for isotropic PET; S0 = 7.2 ± 1.2 cm3 (STP) cm−3 bar−1 for isotropic PEN34), but mainly differ in their diffusion properties (D0 = 0.479 ± 0.016 cm2 s−1 for isotropic PET; D0 = 0.180 ± 0.003 cm2 s−1 for isotropic PEN34). The lower permeability of PEN for carbon dioxide (P0 = 4.0 ± 1.4 cm3 (STP) cm−3 bar−1 cm2 s−1 for isotropic PET; P0 = 1.3 ± 0.2 cm3 (STP) cm−3 bar−1 cm2 s−1 for isotropic PEN34) results in slower diffusion of carbon dioxide accumulated in the support into the sensing foil, which minimizes the impact of the support material on the sensor signal.The surface of the PEN foil was roughened to improve the adhesion between ethyl cellulose and the support. In addition, the foil was cut before the application of the sensor layers to minimize the mechanical forces during the production of the sensor spots.
Glass is another promising material for design of sensitive CO2 optodes due to its high chemical stability and extremely low CO2 storage capacity. However, the production process, especially the pretreatment of a glass disk, was more time consuming than for a PEN foil. Additionally, we found that a direct contact between the sensitive layer and rough glass surface should be avoided to prevent the reaction between the base and the glass surface. This required deposition of another layer of inert perfluorinated polymer on the glass discs.
The complex architecture of the sensing chemistry in combination with the pretreatment of the supporting material (PEN foil) makes manufacturing of individual spots time-consuming, but automatization is certainly possible. Faster spot production is likely to be achieved by using such techniques as inkjet-printing, spray-coating etc.
3.3. Effect of protective coating on response times and long-term stability
The long-term stability of sensors is an important factor in oceanographic applications. Investigation of the acidification of the ocean requires a stable and robust carbon dioxide sensor. The research of the last years has mostly been focused on the development of new indicators for carbon dioxide sensors whereas their stability was often not addressed in detail. The shelf life and long-term applicability of the optical carbon dioxide chemosensors is governed by the stability of the indicator, the polymer (which is generally rather good) and the base. The base not only reacts with carbon dioxide but also with other acidic gases present in the environment. The reaction with the gases corresponding to strong acids is irreversible; however, poisoning of the sensor will also be observed with such gases as SO2 or H2S, which form strong sulfuric acid upon oxidation. The protective polymer should fulfil the following requirements: (i) be highly permeable for carbon dioxide; (ii) be hydrophobic to avoid interference from protons and other ionic species and (iii) represent a good barrier for acidic gases.Silicone rubber (cross-linked polydimethylsiloxane, PDMS) is often the polymer of choice for protection layers.8,35–37 It has good mechanical stability and is highly permeable for carbon dioxide38 but not permeable to protons and other ionic species due to its hydrophobic character. Unfortunately, silicone rubber is also highly permeable for other gases such as SO2/SO3, NOx or H2S (Table 1) which poisons the base in the CO2 sensor.
| Structure | PDMS | Teflon AF 1600 | Hyflon AD 60 | Cytop |
|---|---|---|---|---|
| P O2 | 781 (ref. 48) | 340 (ref. 49) | 51 (ref. 49) | 16 (ref. 43) |
| P NH3 | 6552 (ref. 50) | 229 (ref. 50) | 41 (ref. 50) | — |
| P CO2 | 4400 (ref. 51) | 680 (ref. 51) | 124 (ref. 52) | 17 (ref. 51) |
| P H2S | 6670 (ref. 51) | 100 (ref. 51) | — | 0.6 (ref. 51) |
| P CO2/PH2S | 0.66 (ref. 51) | 6.8 (ref. 51) | — | 27 (ref. 51) |
Recently perfluorinated polymers became popular for gas separation applications.39–44 Commercially available representatives are Teflon AF (DuPont), Hyflon AD (Solvay Solexis) and Cytop (Asahi Glass). Amorphous perfluorinated polymers are extraordinarily thermally and chemically stable, are resistant against common organic solvents, but can be dissolved in perfluorinated solvents to fabricate thin layers. Moreover, they have low permeability for polar and sulphur-containing molecules. Of special interest are the transport properties of hydrogen sulfide, which appears in many marine environments.45–47 The study of Merkel and Toy (2006)51 revealed CO2/H2S selectivities much larger than 1 for perfluorinated polymers in contrast to silicone rubber (Table 1). The reason for this effect is low H2S solubility, caused by unfavourable interactions between the penetrant and the fluorinated polymer. The permeability for carbon dioxide decreases in the following order Teflon AF 1600 > Hyflon AD 60 > Cytop, whereas the selectivity towards H2S increases.
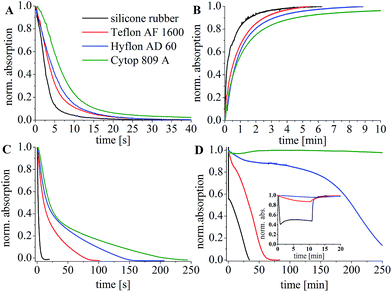
Investigations of the protective properties of these perfluorinated polymers as well as the dynamic response and recovery times were performed with a planar optode based on m-cresol purple in ethyl cellulose with TOAOH.16 This commercially available dye shows a visible colour change (blue-yellow), is characterized in detail and has been extensively used for seawater applications.31,53–56 It represents a good model system for preliminary experiments. A layer of the perfluorinated polymer was coated over the sensing layer. As expected, the response and recovery times increase with decrease in the permeability of the polymer for carbon dioxide (Fig. 3A and B, Table 2).
| Polymer | Response time (t90, sec) | Recovery time (t90, sec) | Time of complete poisoning (HCl) | Poisoning by H2S after 3 h (%) |
|---|---|---|---|---|
| Silicone rubber | 6 | 93 | 9 | 100% (35 min) |
| Teflon AF 1600 | 10 | 139 | 87 | 100% (75 min) |
| Hyflon AD 60 | 12 | 180 | 159 | 36% |
| Cytop 809 A | 15 | 208 | 230 | 0% |
The protective properties of the coatings towards poisoning by acidic gases have been investigated by introducing conc. hydrochloric acid into the cuvette with a planar optode. The poisoning kinetics can be determined via measurement of the absorption of the deprotonated form of m-cresol purple since the hydrophobic quaternary ammonium base is converted to the corresponding chloride salt (Fig. 3C). It is evident that the protective properties of silicone rubber are very poor (Table 1). On the other hand, ∼10-fold, 18-fold and 25-fold improvement is observed for Teflon AF 1600, Hyflon AD 60 and Cytop, respectively. The protective properties of the polymers for other acidic gases are likely to be similar to those towards poisoning by HCl. Furthermore, the poisoning process with hydrogen sulfide in the presence of oxygen (air saturation) was investigated for each polymer (Fig. 3D). Silicone rubber showed the least protection, followed by Teflon AF 1600, Hyflon AD 60 and Cytop 809 A. Cytop 809 A showed almost no poisoning even after 5 h of exposure to H2S. It should be noted that the chosen total sulfide concentration for the experiment is slightly higher than that found in Baltic Sea after a long stagnation period (Godland Sea deep water (200 m): ∼200 μmol kg−1 (ref. 57)) so that poisoning by H2S in the in situ experiments is expected to be similar or slower, because of the salt water inflow in December 2014.
It should also be considered that H2S can cause a reversible cross-talk of the sensor due to its acidic properties. Under anoxic conditions such a cross-talk may be the major error source despite the fact that H2S is not expected to irreversibly poison the sensor. Indeed, we observed a decrease in the absorption of the deprotonated form of m-cresol purple in the presence of H2S which was reversible if the gas was removed promptly. As can be seen, the cross-talk is more pronounced for silicone rubber and almost negligible in the case of Cytop 809 A and Hyflon AD, whereas Teflon AF 1600 occupies an intermediate position (Fig. 3D inset). Thus, due to the fact that perfluorinated polymers do not allow fast equilibration of the sensor with H2S they efficiently reduce the cross-talk to this substance in the case of short term exposure. This can be highly beneficial for profiling experiments.
Although Cytop shows the best protective properties, the sensors show significantly longer response and recovery times due to the rather low permeability for carbon dioxide (Tables 1 and 2). Evidently, Cytop coatings will not be suitable for most applications. However, it may be possible to use this perfluorinated polymer as the protection polymer for the systems where the changes in the carbon dioxide concentration are much slower than the response time of the sensor. Compared to Cytop, the permeability of Teflon AF 1600 for carbon dioxide and hydrogen sulfide is 40-fold and 160-fold higher, respectively, which enables much faster response times but also reduces the shelf life and long-term stability due to faster poisoning. Although no literature data are available for the permeability of Hyflon AD 60 for hydrogen sulfide, the poisoning experiments with HCl and especially H2S showed better protective properties compared to Teflon AF 1600 (Fig. 3C and D). Therefore, we decided to use this polymer as a protective layer as the best compromise between dynamic response and protective properties, which provide long shelf-life and operational life. Other advantages of Hyflon AD 60 make it even more attractive for sensing applications. The material is resistant to swelling58 and is highly transparent to light from far UV to near infrared.49 It has high resistance against abrasion or friction and low affinity to dust and other contamination. Additionally, low biofouling on the perfluorinated surface is expected.
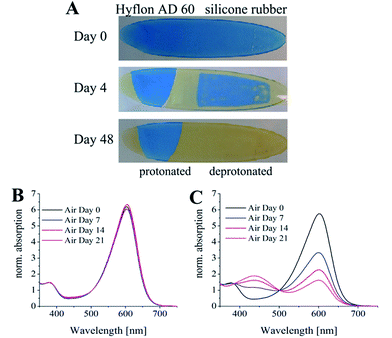
The above system (m-cresol purple and TOAOH in ethylcellulose) was also used for investigation of the long-term protective properties of Hyflon AD 60 in comparison with silicone rubber. The sensors covered with silicone rubber showed continuous drift if stored under ambient conditions. It lost about 50% of the signal already after 1 week of storage (Fig. 4C) and was poisoned completely after 1.5 months. On the other hand, the indicator remained deprotonated in the sensors covered with Hyflon AD 60, indicating excellent stability during this period (Fig. 4B).
3.4. Manufacturing of the luminescent carbon dioxide optode
Due to the use of Hyflon AD 60 as the polymer for the reference and protection layers, a new design of the sensing material was necessary. The adhesion of the highly hydrophobic Hyflon AD 60 on significantly more hydrophilic ethyl cellulose was very weak and the sensor material lacked mechanical stability. For example, the protective layer detached during punching-out of the sensor spots. Even a reduction of mechanical stress during the spot production by laser cutting was not successful, leading to a separation of the sensor layers after several measurements. Therefore, a new sensor design and manufacturing procedure were developed (Fig. 2). The sensor “cocktail” composed of the solution of the dye, TOAOH and ethyl cellulose in an organic solvent was pipetted in the middle of a pre-cut PEN support treated with a sand-paper to improve the adhesion. The sensing layer was covered by the reference layer (luminescent particles dispersed in Hyflon AD 60). Finally, the upper layer of Hyflon AD 60 was introduced, covering both the reference layer on top and the sensing layer on sides and having direct contact with the support material. The advantages of the method include complete protection of the sensing layer from all the sides and absence of mechanical or thermal stress during manufacturing.To evaluate the long-term stability of the new sensors in aqueous media, three sensor spots were inserted in a constantly stirred vessel with a 0.1 mol L−1 phosphate buffer (pH 7.9), equilibrated with ambient air over 35 days (Fig. 5). The sensor spots showed no indication of an intrusion of protons or other poisoning molecules, which would result in increase of the luminescence phase shift, and therefore in overestimation of the carbon dioxide concentration.
3.5. Response and recovery times
The response and recovery times of the luminescent carbon dioxide sensor in the aqueous phase have been estimated for two relevant concentration ranges (Fig. 6). The response and recovery times are very similar. They are significantly faster (about 4-fold) in the upper range of CO2 concentrations (70–125 μmol L−1) than in the lower range (14–28 μmol L−1). As expected, temperature significantly affects the response time. Whereas the response (particularly at a higher concentration range) is sufficiently fast at higher temperatures, it becomes very slow at 4 °C. This is due to the relatively low carbon dioxide permeability of Hyflon AD 60 used in the reference and protective layers. The above limitation of the sensor should be considered when designing profiling experiments. Further optimization of the thicknesses of the reference and protective layers is likely to improve the response times.The response times of the planar optodes based on m-cresol purple (model system) are much faster than those of the presented fluorescent carbon dioxide sensor. It can be explained by a higher carbon dioxide concentration gradient (13 μmol l−1 (ambient air) to 3320 μmol l−1 (10% CO2)) and the effect of the reference particles on the permeability of the second layer to carbon dioxide. It is also possible that the thickness of the reference and protective layers in the case of the presented fluorescent sensors in some parts of the spot is significantly higher than estimated due to an inhomogeneous evaporation pattern. Thus, optimization of the coating procedure may be beneficial for improving the sensor response. Furthermore, the use of the more carbon dioxide-permeable Teflon AF instead of Hyflon AD is also possible. Fiber-optic microsensors are known to respond much faster than the planar sensor spots due to better diffusion of the analyte. Although manufacturing of the microsensors with the current inner-filter effect-based “sensing chemistry” is challenging, the approach is likely to be useful in the case of fluorescent dyes.
3.6. Sensor calibration
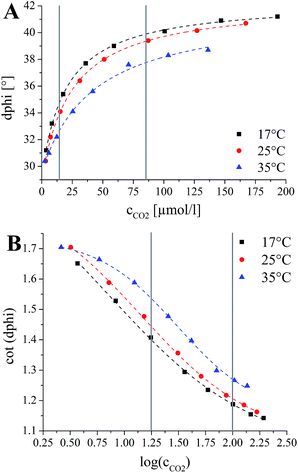
Calibration of the sensors in the aqueous phase was performed by addition of sodium hydrogen carbonate solution to 0.1 mol L−1 phosphate buffer (pH 7.7) to adjust the pCO2 levels. A non-linear increase in the luminescence phase shift with increasing pCO2 is observed (Fig. 7A). The plots of the cotangent of the phase angle against the logarithm of the CO2 concentration reflect the protonation equilibrium of the indicator. Thus, similar to optical pH probes, such dependency can be almost ideally described by a sigmoidal function with four parameters (R2 > 99.8%). | (2) |
The response of all optical chemosensors including pCO2 sensors is temperature-dependent. Temperature not only affects the permeability of the ethyl cellulose for carbon dioxide and the respective pH equilibria but also the luminescence properties of the reference luminophores. This results in a rather complex dependency (Fig. 7). A pronounced decrease in the sensitivity at higher temperature is evident which is explained by decrease of gas solubility under these conditions. Thus, the sigmoidal function was extended by the temperature coefficients (A1_t, A2_t, x0_t, dx_t) to perform a three-dimensional fit of the data (Fig. 7). The resulting equation, which was used to obtain the calibration area was:
 | (3) |
To minimize the degree of freedom and to simplify the recalibration, all temperature coefficients and the values of x0 and dx were fixed. The parameters were set at A1_t = −0.016541, A2_t = 0.0069325, x0_t = 0.037465, dx_t = −0.040605, x0 = 0.953701, dx = 1.445015 for the temperature range between 17 °C and 35 °C.
It should be noted that each sensor is slightly different due to variation in the thickness of the sensing layer and variation in the thickness of the reference layer as well as in the ratio of phosphorescent and fluorescent reference particles. Therefore the cot(dphi) values for each sensor spot are not identical, whereas the slope and the inflection point of the sigmoidal function are equal but temperature dependent. Throughout a three-point calibration, right before the application, the calibration area can be adjusted by shifting it to higher or lower cot(dphi) values. The chosen concentrations of carbon dioxide are at the beginning and the end of the linear part of the calibration curve (18 μmol L−1 ambient air [log(cCO2) = 1.25], 84 μmol L−1 [log(cCO2) = 2.0]; T ≈ 8 °C) and at the plateau at the end achieved by using carbonized mineral water (log(cCO2) = 4.25).
3.7. Applications
The applicability of the new carbon dioxide sensors was tested by measuring the respiration behaviour of Egeria densa. E. densa are water plants originally common in Brazil, Argentina and Uruguay with a high rate of growth under ideal conditions.59 The plant, an oxygen optode, the new carbon dioxide sensor spot placed on a distal end of an optical fibre, as well as the temperature probe were inserted in a desiccator filled with tap water (Fig. 8A). The plant was illuminated with two halogen lamps for one to two hours (photosynthetic photon flux density ∼250 μmol s−1 m−2). The darkness periods varied between 90 minutes and two hours. The production and consumption of carbon dioxide during dark and light periods, respectively, is clearly visible (Fig. 8B). Oxygen dynamics mimics that of carbon dioxide but with an opposite trend: oxygen consumption is observed due to respiration during the dark period and oxygen production due to photosynthesis during the illumination period.The absolute consumption of oxygen is higher than the measured production of carbon dioxide (normally 1![[thin space (1/6-em)]](https://www.rsc.org/images/entities/char_2009.gif) :
:![[thin space (1/6-em)]](https://www.rsc.org/images/entities/char_2009.gif) 1 ratio). Since we used unbuffered tap water, the produced carbon dioxide is partly transformed into bicarbonate, which was not measured.
1 ratio). Since we used unbuffered tap water, the produced carbon dioxide is partly transformed into bicarbonate, which was not measured.
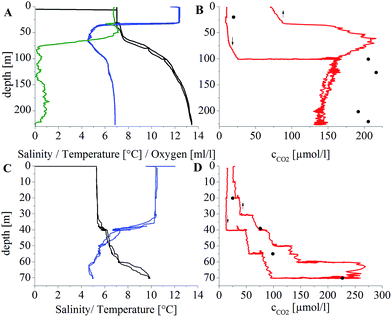
The sensing device was further applied for in situ carbon dioxide monitoring during the research trip ‘PROSID2014’ in the Gotland deep (TF_271) and the Gulf of Finland (GoF_7). Due to the long response time of the sensor, stepwise profiles were measured. The CTD-rosette was held on a certain depth for 45–105 minutes. A stable signal was observed before the next depth was reached. The pCO2 was calculated by using A1 and A2 parameters obtained from the three-point (re-)calibration. The obtained data correspond well to the estimated behaviour of the carbon dioxide concentration based on the previously measured dissolved oxygen concentrations (Fig. 9A). The upper layer (<40 m) was mixed very well because of the weather conditions and was equilibrated with the atmosphere. This was followed by a pronounced increase of pCO2 below the halocline (from 13 μmol L−1 to 135 μmol L−1), which can be found permanently in the Baltic Sea.60,61 Due to the saltwater inflow in December 2014 (ref. 62) a slight decrease of CO2 was expected at 200 m depth. This could be observed by the reference measurements and the oxygen profile. The predicted amounts of carbon dioxide could be confirmed with the new sensor device at both stations.
The measured pCO2 was verified by using the reference samples taken at the corresponding depths. Due to the use of Hyflon AD 60 as the polymer for the reference and protection layers and low temperatures during the experiment, the response times are very long. This leads to three main problems: (i) the recalibration at temperatures between 4 °C and 10 °C is time consuming (up to 6 hours), (ii) the measurement of the profile takes several hours, during which the research vessel has to stay at almost the same position and (iii) the long response time is responsible for hysteresis, which is clearly observed during the fast profiling. For instance, hysteresis for the depths from 0 to 100 m (station TF_271, Fig. 9B) is very distinct due to the fact that the CTD-rosette was heaved continuously back to the surface because of the weather conditions. A longer equilibration time is required to achieve a stable signal for more precise measurements which was hardly possible within the limited time available during the test. For comparison, at station GoF_7 it was possible to extend the time for measuring the profile and heaving the CTD-rosette (10 min for every 10 m). The observed hysteresis was much smaller (Fig. 9D).
The values measured with the new carbon dioxide sensor for the Gotland deep (TF_271) were often lower than those obtained in the reference method for discrete probes (∼25% relative error). The likely reason for this deviation is an offset in calibration, due to very long response times of the sensor at the low temperatures and low carbon dioxide concentrations.
The data obtained at GoF_7 are in good agreement with the reference data. The measured profile in the Gulf of Finland shows an increase of the carbon dioxide concentration between 20 and 70 m, in which the main rise was measured between 55 and 70 m water depth. The reference measurements are in the range between the data obtained during lowering and heaving of the CTD-rosette. This indicates that a longer equilibration time is necessary to generate more accurate data. Therefore, optimization of the sensor design aiming at reduction of the response time will be indispensable for profiling applications.
4. Conclusions
We presented the quantification of carbon dioxide in the marine environment with a highly sensitive, mechanically and (photo-) chemically robust sensing material, which is compatible with the phase fluorometers from PyroScience GmbH. The new sensor spots based on a colorimetric indicator and inner-filter effect read-out feature a multi-layer architecture which is necessary to ensure high long term and mechanical stability. The use of a protective layer made of the perfluorinated polymer Hyflon AD 60 dramatically enhances the resistance against poisoning compared to the commonly used silicone rubber. Importantly, such coating also dramatically reduces the reversible cross-talk to hydrogen sulfide under low oxygen conditions. The trade-off is a much longer response time, particularly at low carbon dioxide concentrations and at low temperatures. This significantly complicates the sensor calibration and profiling in situ. Preparation of thinner layers via carefully controlled layer deposition is likely to improve the response times. Furthermore, the use of a different perfluorinated polymer with a higher permeability for carbon dioxide (Teflon AF) is another possibility to improve the response and recovery times. By the use of additional long term field tests more data can be obtained to reveal possible interferences or limitations, like biofouling.Acknowledgements
Financial support by the European Union FP7 Project SenseOCEAN-Marine Sensors for the 21st century (Grant Agreement Number 614141) is gratefully acknowledged. The research cruise “PROSID 2014” has received funding from the European Union Seventh Framework Programme (FP7/2007–2013) EUROFLEETS 2 (Grant Agreement number 312762). Dr Michael Naumann (field cruise leader), Dr David Meyer (organizer), Dr Urmas Lips (MSI Tallinn) and the research vessel crew are thanked for their assistance.Notes and references
- C. L. Sabine, R. A. Feely, N. Gruber and others, Science, 2004, 305, 367–371, DOI:10.1126/science.1097403.
- S. C. Doney, V. J. Fabry, R. A. Feely and J. A. Kleypas, Annu. Rev. Mater. Sci., 2009, 1, 169–192, DOI:10.1146/annurev.marine. 010908.163834.
- F. J. Millero, Geochim. Cosmochim. Acta, 1995, 59, 661–677, DOI:10.1016/0016-7037(94)00354-O.
- A. Mills, A. Lepre and L. Wild, Sens. Actuators, B, 1997, 39, 419–425, DOI:10.1016/S0925-4005(96)02116-8.
- J. W. Severinghaus and A. F. Bradley, J. Appl. Physiol., 1958, 13, 515–520 CAS.
- M. D. DeGrandpre, Anal. Chem., 1993, 65, 331–337, DOI:10.1021/ac00052a005.
- M. D. DeGrandpre, T. R. Hammar, S. P. Smith and F. L. Sayles, Limnol. Oceanogr., 1995, 40, 969–975, DOI:10.4319/lo. 1995. 40.5.0969.
- M. D. DeGrandpre and M. M. Baehr, Anal. Chem., 1999, 71, 1152–1159, DOI:10.1021/ac9805955.
- O. S. Wolfbeis, B. Kovács, K. Goswami and S. M. Klainer, Mikrochim. Acta, 1998, 129, 181–188, DOI:10.1007/bf01244739.
- C. von Bültzingslöwen, A. K. McEvoy, C. McDonagh, B. D. MacCraith, I. Klimant, C. Krause and O. S. Wolfbeis, Analyst, 2002, 127, 1478–1483, 10.1039/b207438a.
- R. Ali, T. Lang, S. M. Saleh, R. J. Meier and O. S. Wolfbeis, Anal. Chem., 2011, 83, 2846–2851, DOI:10.1021/ac200298j.
- S. Pandey, S. N. Baker, S. Pandey and G. A. Baker, Chem. Commun., 2012, 48, 7043–7045, 10.1039/c2cc32164e.
- Y. Liu, Y. Tang, N. N. Barashkov, I. S. Irgibaeva, J. W. Y. Lam, R. Hu, D. Birimzhanova, Y. Yu and B. Z. Tang, J. Am. Chem. Soc., 2010, 132, 13951–13953, DOI:10.1021/ja103947j.
- L. Chen, D. Huang, S. Ren, Y. Chi and G. Chen, Anal. Chem., 2011, 83, 6862–6867, DOI:10.1021/ac201067u.
- Y. Kawabata, T. Kamichika, T. Imasaka and N. Ishibashi, Anal. Chim. Acta, 1989, 219, 223–229, DOI:10.1016/s0003-2670(00)80353-0.
- A. Mills, Q. Chang and N. McMurray, Anal. Chem., 1992, 64, 1383–1389, DOI:10.1021/ac00037a015.
- O. Oter, K. Ertekin and S. Derinkuyu, Talanta, 2008, 76, 557–563, DOI:10.1016/j.talanta.2008.03.047.
- R. N. Dansby-Sparks, J. Jin, S. J. Mechery, U. Sampathkumaran, T. W. Owen, B. D. Yu, K. Goswami, K. Hong, J. Grant and Z.-L. Xue, Anal. Chem., 2010, 82, 593–600, DOI:10.1021/ac901890r.
- A. Mills and G. A. Skinner, Analyst, 2010, 135, 1912–1917, 10.1039/c000688b.
- G. Liebsch, I. Klimant, C. Krause and O. S. Wolfbeis, Anal. Chem., 2001, 73, 4354–4363, DOI:10.1021/ac0100852.
- M. Čajlaković, A. Bizzarri and V. Ribitsch, Anal. Chim. Acta, 2006, 573–574, 57–64, DOI:10.1016/j.aca.2006.05.085.
- C. S. Burke, A. Markey, R. I. Nooney, P. Byrne and C. McDonagh, Sens. Actuators, B, 2006, 119, 288–294, DOI:10.1016/j.snb. 2005.12.022.
- D. Atamanchuk, A. Tengberg, P. J. Thomas, J. Hovdenes, A. Apostolidis, C. Huber and P. O. J. Hall, Limnol. Oceanogr.: Methods, 2014, 12, 63–73, DOI:10.4319/lom.2014.12.63.
- M. Uttamlal and D. R. Walt, Nat. Biotechnol., 1995, 13, 597–601, DOI:10.1038/nbt0695-597.
- C.-S. Chu and Y.-L. Lo, Sens. Actuators, B, 2008, 129, 120–125, DOI:10.1016/j.snb.2007.07.082.
- A. Loudet, R. Bandichhor, K. Burgess, A. Palma, S. O. McDonell, M. J. Hall and D. F. O'Shea, Org. Lett., 2008, 10, 4771–4774, DOI:10.1021/ol8018506.
- T. Jokic, S. M. Borisov, R. Saf, D. A. Nielsen, M. Kühl and I. Klimant, Anal. Chem., 2012, 84, 6723–6730, DOI:10.1021/ac3011796.
- S. Schutting, T. Jokic, M. Strobl, S. M. Borisov, D. de Beer and I. Klimant, J. Mater. Chem. C, 2015, 3, 5474–5483, 10.1039/c5tc00346f.
- S. M. Borisov, C. Wuerth, U. Resch-Genger and I. Klimant, Anal. Chem., 2013, 85, 9371–9377, DOI:10.1021/ac402275g.
- R. N. Roy, L. N. Roy, K. M. Vogel, C. Porter-Moore, T. Pearson, C. E. Good, F. J. Millero and D. M. Campbell, Mar. Chem., 1993, 44, 249–267, DOI:10.1016/0304-4203(93)90207-5.
- L. M. Mosley, S. L. G. Husheer and K. A. Hunter, Mar. Chem., 2004, 91, 175–186, DOI:10.1016/j.marchem.2004.06.008.
- A. G. Dickson, C. L. Sabine and J. R. Christian, Guide to best practices for ocean CO2 Measurements, North Pacific Marine Science Organisation, 2007 Search PubMed.
- E. Lewis and D. Wallace, Program developed for CO2 system calculations, Carbon dioxide information analysis center, Oak Ridge National Laboratory, 1998 Search PubMed.
- J. B. Brolly, D. I. Bower and I. M. Ward, J. Polym. Sci., Part B: Polym. Phys., 1996, 34, 769–780, DOI:10.1002/(sici)1099-0488(199603)34:4.
- B. H. Weigl and O. S. Wolfbeis, Anal. Chim. Acta, 1995, 302, 249–254, DOI:10.1016/0003-2670 (94)00473-y.
- G. Neurauter, I. Klimant and O. S. Wolfbeis, Fresenius. J. Anal. Chem., 2000, 366, 481–487, DOI:10.1007/s002160050097.
- S. M. Borisov, R. Seifner and I. Klimant, Anal. Bioanal. Chem., 2011, 400, 2463–2474, DOI:10.1007/s00216-010-4617-4.
- J. C. Lötters, W. Olthuis, P. H. Veltink and P. Bergveld, J. Micromech. Microeng., 1997, 7, 145–147, DOI:10.1088/0960-1317/7/3/017.
- L. M. Robeson, J. Membr. Sci., 2008, 320, 390–400, DOI:10.1016/j.memsci.2008.04.030.
- P. Bernardo, E. Drioli and G. Golemme, Ind. Eng. Chem. Res., 2009, 48, 4638–4663, DOI:10.1021/ie8019032.
- P. M. Budd and N. B. McKeown, Polym. Chem., 2010, 1, 63–68, 10.1039/b9py00319c.
- C. A. Scholes, G. W. Stevens and S. E. Kentish, Fuel, 2012, 96, 15–28, DOI:10.1016/j.fuel.2011.12.074.
- Y. Okamoto, H. Zhang, F. Mikes, Y. Koike, Z. He and T. C. Merkel, J. Membr. Sci., 2014, 471, 412–419, DOI:10.1016/j.memsci.2014.07.074.
- T. Graunke, K. Schmitt, S. Raible and J. Wöllenstein, Sensors, 2016, 16, 1605, DOI:10.3390/s16101605.
- S. Z. Baykara, E. H. Figen, A. Kale and T. Nejat Veziroglu, Int. J. Hydrogen Energy, 2007, 32, 1246–1250, DOI:10.1016/j.ijhydene.2006.07.021.
- R. J. Diaz and R. Rosenberg, Science, 2008, 321, 926–929, DOI:10.1126/science.1156401.
- M. Naumann and G. Nausch, Chem. Unserer Zeit, 2015, 49, 76–80, DOI:10.1002/ciuz. 201400695.
- S. A. Stern, J. Membr. Sci., 1994, 94, 1–65, DOI:10.1016/0376-7388(94)00141-3.
- V. Arcella, A. Ghielmi and G. Tommasi, Ann. N. Y. Acad. Sci., 2003, 984, 226–244, DOI:10.1111/j.1749-6632.2003.tb060 02.x.
- C. Makhloufi, D. Roizard and E. Favre, J. Membr. Sci., 2013, 441, 63–72, DOI:10.1016/j.memsci.2013.03.048.
- T. C. Merkel and L. G. Toy, Macromolecules, 2006, 39, 7591–7600, DOI:10.1021/ma061072z.
- V. Arcella, P. Colaianna, P. Maccone, A. Sanguineti, A. Gordano, G. Clarizia and E. Drioli, J. Membr. Sci., 1999, 163, 203–209, DOI:10.1016/s0376-7388(99)00184-2.
- T. D. Clayton and R. H. Byrne, Deep Sea Res., Part I, 1993, 40, 2115–2129, DOI:10.1016/0967-0637(93)90048-8.
- M. Chierici, A. Anderson, A. Fransson and L. G. Anderson, Mar. Chem., 1999, 65, 281–290, DOI:10.1016/S0304-4203(99) 00020-1.
- M. P. Seidel, M. D. DeGrandpre and A. G. Dickson, Mar. Chem., 2008, 109, 18–28, DOI:10.1016/j.marchem.2007.11.013.
- X. Liu, M. C. Patsavas and R. H. Byrne, Environ. Sci. Technol., 2011, 45, 4862–4868, DOI:10.1021/es200665d.
- E. Gustafsson, T. Wällstedt, C. Humborg, C.-M. Mörth and B. G. Gustafsson, Global Biogeochem. CyclesBiogeochemical, 2014, 28, 1358–1370, DOI:10.1002/2014gb004888.
- J. C. Jansen, F. Taselli, E. Tocci and E. Drioli, Desalination, 2005, 192, 207–213, DOI:10.1016/j.desal.2005.04.134.
- M. Yarrow, V. H. Marin, M. Finlayson, A. Tironi, L. E. Delgado and F. Fischer, Rev. Chil. Hist. Nat., 2009, 82, 299–313 Search PubMed.
- M. Samuelsson, Cont. Shelf Res., 1996, 16, 1463–1477, DOI:10.1016/0278-4343(95)00082-8.
- M. Meier, Estuarine, Coastal Shelf Sci., 2007, 74, 610–627, DOI:10.1016/j.ecss.2007.05.019.
- U. Gräwe, M. Naumann, V. Mohrholz and H. Burchard, J. Geophys. Res.: Oceans, 2015, 120, 7676–7697, DOI:10.1002/2015jc 011269.
| This journal is © The Royal Society of Chemistry 2017 |

