 Open Access Article
Creative Commons Attribution 3.0 Unported Licence
Development of a full micro-scale spatially offset Raman spectroscopy prototype as a portable analytical tool
Marco
Realini
a,
Claudia
Conti
 *a,
Alessandra
Botteon
a,
Chiara
Colombo
a and
Pavel
Matousek
*b
aConsiglio Nazionale delle Ricerche, Istituto per la Conservazione e la Valorizzazione dei Beni Culturali (ICVBC), Via Cozzi 53, 20125, Milano, Italy. E-mail: c.conti@icvbc.cnr.it
bCentral Laser Facility, Research Complex at Harwell, STFC Rutherford Appleton Laboratory, Harwell Oxford, OX11 0QX, UK. E-mail: pavel.matousek@stfc.ac.uk
First published on 14th December 2016
Abstract
We present, for the first time, a portable full micro-Spatially Offset Raman Spectroscopy (micro-SORS) prototype permitting the in situ analysis of thin, highly turbid stratified layers at depths not accessible to conventional Raman microscopy. The technique is suitable for the characterisation of painted layers in panels, canvases and mural paintings, painted statues and decorated objects in cultural heritage or stratified polymers, and biological, catalytic and forensics samples where invasive analysis is undesirable or impossible to perform. The new device is characterised conceptually in polymer and paint layer systems. The provision of portability with full micro-SORS delivers subsurface micro-SORS capability unlocking the non-invasive and non-destructive potential of micro-SORS at its most effective form permitting it to be applied to large and non-portable objects in situ without recourse to removing micro-fragments for laboratory analysis on benchtop Raman microscopes.
Introduction
Raman microscopy is frequently a technique of choice for characterising surface layers of paints in art for its high chemical specificity.1,2 However subsurface stratigraphy (often only a few tens of micrometres thick), which can often be present, is typically beyond the reach of this technique due to high turbidity (diffuse scattering) of such layers. This precludes the provision of detailed chemical information on sublayer makeup otherwise available generally from Raman spectroscopy. Such sub-surface information is, however, important in a number of situations, for example, in conservation processes or when learning about an artist's technique. Often cross-sectional analysis is resorted to with subsequent Raman characterisation to provide such sub-surface information.3,4 Cross-sectional analysis is, however, invasive in nature and naturally highly undesirable or frequently not even permissible with objects of art due to their uniqueness and high cultural value. Examples of such objects include panels, canvases and mural paintings, painted statues and other decorated objects. A similar requirement for non-invasive and non-destructive analyses can arise in other disciplines such as polymer, catalytic, biological, biomedical and forensics sciences where highly turbid stratified layers can be present and where invasive analysis may be undesirable or impossible.Recently a new concept in Raman microscopy with considerably higher penetration depth than that of conventional Raman microscopy and capable of reaching such sub-layers has emerged – micro-Spatially Offset Raman Spectroscopy (micro-SORS).5,6 This method is a conceptual evolution of its parent technique, (macro-scale) SORS7,8 combining it with microscopy to provide capability of resolving thin, micrometre scale stratified layers. To determine the chemical composition of a sublayer, for a two layer sample, only a very simple mathematical manipulation of the zero spatial offset and non-zero spatially offset Raman spectra needs to be performed. This process comprises a scaled subtraction of the zero-spatially offset spectrum from the non-zero one cancelling the contribution of the top layer. More offset spectra need to be acquired and processed linearly for the separation of layers in a system consisting of more than 2 layers.5 The most basic variant of micro-SORS is defocusing micro-SORS, which can be practised without any modifications on a conventional Raman microscope.9
This concept is, however, an approximation of SORS as it does not involve fully separated laser illumination and Raman collection zones. As such, defocussing micro-SORS lacks the efficacy of its much more effective counterpart, full micro-SORS,10 which does include fully separated illumination and collection zones.
In the cultural heritage field there is increasingly high demand for portable instruments enabling the study of larger samples and artworks in situ. Together with portable X-ray fluorescence, portable Raman represents one of the most used portable devices in this field shedding light on the chemical composition of artworks.11,12
To date the micro-SORS technique has been demonstrated in portable form only with defocusing micro-SORS;13 all the other studies have been performed on benchtop Raman microscopes. As such the method has not fully delivered on its potential for studies in cultural heritage; in fact, defocusing micro-SORS has considerably lower penetration depth and lower discrimination power against surface layers.9
The work presented here concerns the facilitation of portability to full micro-SORS. As such full micro-SORS could be used, for the first time, outside a specialized laboratory and with larger objects that would not otherwise fit under a microscope. This article describes the instrument prototype and proof-of-concept studies on selected representative samples.
Experimental
Portable full micro-SORS
The measurements were carried out using a portable Xantus-2™ (Rigaku, Boston, USA) Raman spectrometer with 2000 × 256 pixels, thermoelectrically cooled CCD (Charge-Coupled Device) and a selected excitation wavelength of 785 nm. The instrument was modified by removing the front collection and focusing lens with its tubular housing. The laser beam was first separated from the Raman collection optical path using a dichroic beamsplitter (Semrock, LPD02-785RU-25) and brought into a microscope objective (×50, NA 0.50) mounted on a motorised stage shown in Fig. 1. The Raman optical path was equipped with a microscope objective (×10, NA 0.22).The laser impacted the sample at 45° and the Raman signal was collected at 45° with respect to the sample and 90° with respect to the laser beam axis (see Fig. 1). The laser beam size on the sample was estimated using a razor blade edge to be 40 μm from 10 to 90% intensity change. Due to the skewed incidence of the laser beam on the sample surface, the beam footprint on the sample surface was further elongated in one direction by a factor of 1.4. The elongation direction was in the direction of the spatial offset. The Raman collection area diameter was estimated to be 70 μm. As for the laser footprint, the Raman collection area footprint on the sample surface was further elongated too (by 1.4), also in the direction of the spatial offset.
The sample was mounted on a manual micropositioning stage to enable the sample to be brought to the collection plane at the zero spatial offset at the start of each measurement. After the collection of the zero spatially offset Raman spectrum, additional spectra at the non-zero spatial offset were acquired by moving the motorised stage carrying the laser beam microscope objective.
The micro-SORS spectra were acquired with a laser power on the sample from 70 to 300 mW and a spectral resolution of 7–10 cm−1. The total acquisition time for each spatial offset ranged from 10 to 30 s.
The raw spectra of mock-up painted systems (S2 and S3, see below) are presented with background correction; except for the real case sample (S4), the spectra were normalized to a Raman band of the respective top or bottom layer. A large ‘wavy’ artefact background was generated across the spectrum by the instrument with the real case sample (S4). To deal with this issue the presented spectra recorded with a spatial offset of 100 and 200 μm are processed by subtracting away also a scaled 300 μm spatially offset spectrum cancelling the distorted ‘wavy’ pattern – this also led to some diminishment of sublayer signals in the presented spectra.
Samples
The first specimen (S1) conceptually represents samples from the field of micro-stratified polymer systems. Here two layers, highly turbid and opaque in appearance, were artificially superimposed on top of each other. The top layer was polytetrafluoroethylene (PTFE) tape (75 μm thick) placed over a plastic bottle made of polyethylene (PE) (3.5 mm thick).The second and third examples (S2 and S3 respectively) consist of painted layers simulating a real artistic stratigraphy: in S2 two pigments were used, red ochre (hematite-Fe2O3) (60 μm thick) on top of phthalocyanine blue (C32H16N8Cu – 50 μm thick). In S3 three pigments were superimposed, red ochre (40 μm thick), titanium white (rutile-TiO2 – 40 μm thick) and bismuth vanadate yellow (BiVO4 – 300 μm thick). In both specimens the pigment layers were deposited on a sheet of paper. The preparation of the last two specimens represents a critical need in conservation of cultural heritage to obtain information on the composition of painted stratigraphy applied on panels, canvases or plasters.
Besides the three mock-up samples, the last example is a real case study originating from the medieval Masegra Castle (Sondrio). It is a painted plaster consisting of a few tens of micrometers thick layer of yellow ochre mixed with an organic binder on top of a 500 μm thick layer of gypsum and calcite (Table 1).
| Sample | Top layer | Bottom layer(s) |
|---|---|---|
| Stratified plastic (S1) | Polytetrafluoroethylene (PTFE – 75 μm) | Polyethylene (PE – 3.5 mm) |
| Two layers painted stratigraphy (S2) | Red ochre (60 μm) | Phthalocyanine blue (50 μm) |
| Three layers painted stratigraphy (S3) | Red ochre (40 μm) | Titanium white (40 μm) followed by bismuth vanadate yellow (300 μm) |
| Painted plaster from Masegra Castle (Sondrio) (S4) | Yellow ochre (30 μm) | Gypsum and calcite (500 μm) |
Results and discussion
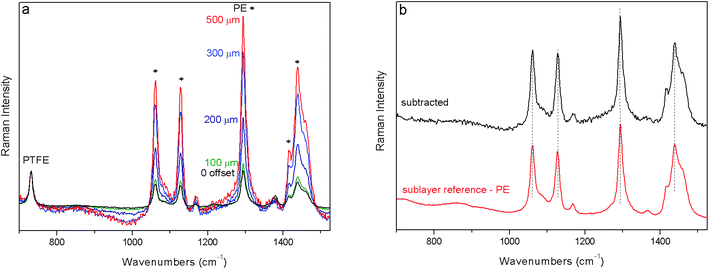
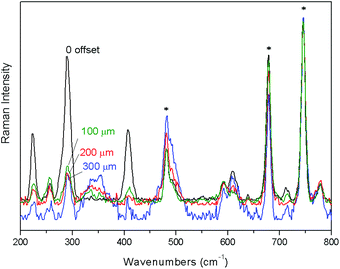
First, the performance of a portable full micro-SORS method was illustrated in a stratified plastic system (S1) consisting of a PE layer covered with PTFE tape. Selected Raman spectra from the zero offset position to the 500 μm spatial offset are shown in Fig. 2a where the evolution of the signals of individual layers with the increase of spatial offsets is depicted. The spectra are all normalised to the top layer (PTFE) Raman signal. The change in relative intensity between the top and bottom layer Raman signals is apparent from the evolution of the strong bands of PE at 1438, 1294, 1127 and 1061 cm−1. The contrast between the two layers has improved by a factor of ∼5 between the zero and 500 μm spatial offset spectra. To recover the pure Raman spectrum of the sub-layer, the zero spatial offset spectrum was subtracted scaled from the 500 μm offset spectrum cancelling the Raman contribution from the top layer (Fig. 2b). The result of the subtraction compares very well with the reference spectrum of PE.The second demonstration of the applicability of full portable micro-SORS was carried out on a painted stratigraphy consisting of two layers, red ochre on top of phthalocyanine blue (Fig. 3). The zero offset spectrum shows the most characteristic bands of both pigments. Phthalocyanine blue has a good Raman scattering cross section and, in spite of the bottom position, its intensity in the ‘0’ spatial offset spectrum is quite high. By incrementing the spatial offset the decrease of the top layer bands (224, 290, and 409 cm−1) is unequivocal and the relative intensity between red ochre and phthalocyanine blue dramatically changes leading to the improvement of contrast for the sublayer by a factor of ∼4. Actually, the optimum micro-SORS effect is visible between the zero and 200 μm offset spectra; after that, the difference in the relative intensity between the two layers does not change appreciably.
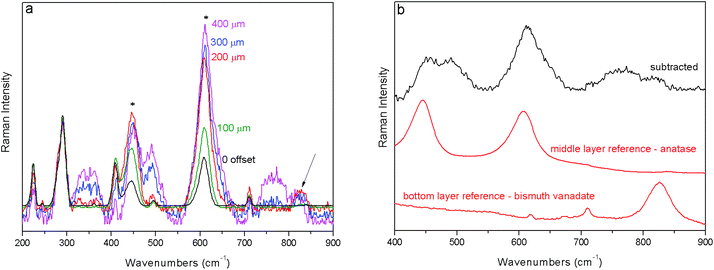
In the third example (S3) red ochre is positioned at the top position of the three layer system followed by a micrometric-thick layer of titanium white (anatase) on top of a yellow layer (bismuth vanadate yellow). The ‘0’ spatial offset spectrum is dominated by Raman bands associated with the top layer; the Raman bands of the second layer are also clearly visible at 445 and 611 cm−1 (Fig. 4a). The gradual incrementation of the spatial offset leads to a rapid diminishment of the top layer signal relative to that of the second layer. At the 300 μm spatial offset a broad band at 826 cm−1 slightly increases (indicated with an arrow in Fig. 4a), which corresponds spectrally to the most intense band of the third and more internal layer (bismuth vanadate yellow). However, due to the high level of spectral noise, it was not possible to establish conclusively whether this is a real band or an artefact. Other artefacts around 350 and 750 cm−1 are present; as for the former artefact, it is visible in Fig. 3 too, in the spectral region where less intense pigment bands occur. By applying the same previously used scaling method to the raw spectra one is able to recover the estimates of the pure Raman signal of the middle layer, titanium white (Fig. 4b). The presence of the sublayer, bismuth vanadate yellow, cannot be, however, completely excluded.
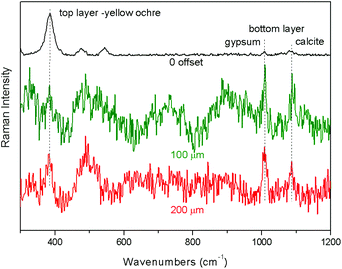
The final example is the demonstration of the applicability of portable full micro-SORS to a real sample (S4). The ‘0’ spatial offset spectrum shows the bands of the top layer, consisting of yellow ochre, and low intensity bands at 1009 and 1089 cm−1 ascribable to gypsum and calcite, respectively (Fig. 5). Despite the high level of spectral noise, with the increase of the spatial offset the contribution of the bottom layer becomes distinctly larger. The relative intensity between the top and bottom layers changes up to the 300 μm spatial offset, where the artefact ‘wavy’ background became dominant and led to the loss of signal visibility.
 | ||
| Fig. 5 Full micro-SORS spectra of the real painted plaster (S4) acquired with the portable instrument. Spatial offsets in μm are indicated below the spectra. | ||
The technique has its inherent limitations including inapplicability to highly absorbing, extremely thin sublayers relative to the surface layer, compounds with very low Raman cross sections at the subsurface position and highly fluorescing samples (although the surface layer fluorescence can be effectively suppressed by this method too14). In addition, samples with high heterogeneity across their surface or within the sublayers are also challenging without recourse to a more complex data acquisition methodology.6
Conclusions
We have developed the first prototype of portable full micro-SORS for the measurements of thin sublayers within stratified diffusely scattering samples. The concept was demonstrated for a number of samples exemplifying a range of potential applications across several disciplines. The portability of full micro-SORS unlocks the non-invasive and non-destructive potential of micro-SORS. Due to the real offset between the beam and collection areas it is more effective compared with the defocusing micro-SORS variant yielding generally higher discrimination levels against top layers and deeper penetration depths.9 The concept is complementary to conventional Raman microscopy by extending its accessible depths and is expected to find a number of applications across areas such as art, archaeology, forensics, catalytic research, and biological and biomedical sciences.References
- F. Casadio, C. Daher and L. Bellot-Gurlet, Top. Curr. Chem. (Z), 2016, 374, 62 CrossRef PubMed.
- D. Bersani, C. Conti, P. Matousek, F. Pozzi and P. Vandenabeele, Anal. Methods, 2016, 8, 8395–8409 RSC.
- S. Valadas, R. Freire, A. Cardoso, J. Mirão, P. Vandenabeele, J. O. Caetano and A. Candeias, Micron, 2016, 85, 15–25 CrossRef CAS PubMed.
- F. Pozzi, J. Arslanoglu, F. Carò and C. Stringari, Appl. Phys. A, 2016, 122(917), 1–15 CAS.
- C. Conti, C. Colombo, M. Realini, G. Zerbi and P. Matousek, Appl. Spectrosc., 2014, 68, 686–691 CrossRef CAS PubMed.
- C. Conti, M. Realini, C. Colombo and P. Matousek, J. Raman Spectrosc., 2015, 46, 476–482 CrossRef CAS.
- P. Matousek, I. P. Clark, E. R. C. Draper, M. D. Morris, A. E. Goodship, N. Everall, M. Towrie, W. F. Finney and A. W. Parker, Appl. Spectrosc., 2005, 59, 393–400 CrossRef CAS PubMed.
- K. Buckley and P. Matousek, Analyst, 2011, 136, 3039–3050 RSC.
- C. Conti, C. Colombo, M. Realini and P. Matousek, Analyst, 2015, 140, 8127–8133 RSC.
- P. Matousek, C. Conti, M. Realini and C. Colombo, Analyst, 2016, 141, 731–739 RSC.
- D. Lauwers, A. Candeias, A. Coccato, J. Mirao, L. Moens and P. Vandenabeele, Spectrochim. Acta, Part A, 2016, 157, 146–152 CrossRef CAS PubMed.
- G. Barone, D. Bersani, A. Coccato, D. Lauwers, P. Mazzoleni, S. Raneri, P. Vandenabeele, D. Mancini, G. Agostino and N. F. Neri, Appl. Phys. A, 2016, 122(838), 1–10 CAS.
- M. Realini, A. Botteon, C. Conti, C. Colombo and P. Matousek, Analyst, 2016, 141, 3012–3019 RSC.
- C. Conti, A. Botteon, C. Colombo, M. Realini and P. Matousek, Analyst, 2016, 141, 5374–5381 RSC.
| This journal is © The Royal Society of Chemistry 2017 |


