 Open Access Article
Creative Commons Attribution 3.0 Unported Licence
Infrared spectral histopathology using haematoxylin and eosin (H&E) stained glass slides: a major step forward towards clinical translation
Michael J.
Pilling
 a,
Alex
Henderson
 a,
Jonathan H.
Shanks
b,
Michael D.
Brown
 c,
Noel W.
Clarke
c and
Peter
Gardner
 *a
*a
aManchester Institute of Biotechnology, University of Manchester, 131 Princess Street, Manchester, M1 7DN, UK. E-mail: peter.gardner@manchester.ac.uk; Fax: +44 (0)161 306 5201; Tel: +44 (0)161 306 4463
bDepartment of Pathology, Christie Hospital, Manchester, UK
cGenito Urinary Cancer Research Group, Division of Molecular & Clinical Cancer Sciences, Faculty of Biology, Medicine and Health, The University of Manchester, Paterson Building, The Christie NHS Foundation Trust, Wilmslow Road, Manchester M20 4BX, UK
First published on 28th November 2016
Abstract
Infrared spectral histopathology has shown great promise as an important diagnostic tool, with the potential to complement current pathological methods. While promising, clinical translation has been hindered by the impracticalities of using infrared transmissive substrates which are both fragile and prohibitively very expensive. Recently, glass has been proposed as a potential replacement which, although largely opaque in the infrared, allows unrestricted access to the high wavenumber region (2500–3800 cm−1). Recent studies using unstained tissue on glass have shown that despite utilising only the amide A band, good discrimination between histological classes could be achieved, and suggest the potential of discriminating between normal and malignant tissue. However unstained tissue on glass has the potential to disrupt the pathologist workflow, since it needs to be stained following infrared chemical imaging. In light of this, we report on the very first infrared Spectral Histopathology SHP study utilising coverslipped H&E stained tissue on glass using samples as received from the pathologist. In this paper we present a rigorous study using results obtained from an extended patient sample set consisting of 182 prostate tissue cores obtained from 100 different patients, on 18 separate H&E slides. Utilising a Random Forest classification model we demonstrate that we can rapidly classify four classes of histology of an independent test set with a high degree of accuracy (>90%). We investigate different degrees of staining using nine separate prostate serial sections, and demonstrate that we discriminate on biomarkers rather than the presence of the stain. Finally, using a four-class model we show that we can discriminate normal epithelium, malignant epithelium, normal stroma and cancer associated stroma with classification accuracies over 95%.
1 Introduction
In 2012 there were approximately 14 million new cancer cases of any type, reported worldwide, and 8.2 million cancer deaths. Over the next two decades the number of new cancer cases is expected to increase to 22 million annually.1 The rise in the incidence of new cancer cases is in part due to the overwhelming success of national cancer screening programs involving blood tests or medical imaging.2 Designed for identifying the manifestation of asymptomatic or latent cancer, screening has undoubtedly led to improved rates of detection.3 In the event of abnormalities a tissue biopsy is usually collected for pathological examination to establish if cancer is present.Tissue biopsies present the pathologist with a high level of morphological detail, and enable the pathologist to not only establish if cancer is present, but also identify the cancer type, grade and even the likely prognosis. Unfortunately the process is time-consuming since each tissue biopsy needs to be examined manually, inevitably leading to delays in patient treatment and care. The problem is only exacerbated by the large number of biopsies which turn out to be benign, all of which still need to undergo pathological examination.4 Despite increased throughput and pre-screening of tissue biopsies being clear drivers for automated histopathology, manual examination of tissue sections remains the norm.
Spectral histopathology (SHP) has developed into a rapidly evolving field which has demonstrated the promise to augment current histopathological tools. Infrared chemical imaging has received particular attention recently5 which has been driven by its ability to interrogate tissue based on its biochemical fingerprint alone in a label-free, non-perturbative manner. Numerous studies have shown that infrared chemical imaging can routinely distinguish cancerous from benign tissue in a non-subjective manner, with both high sensitivity and high specificity, across a wide variety of different tissue types including prostate,6–9 lung,10,11 colon,12–15 breast,16 brain,17 and kidney.18 Despite this the technology remains primarily a biomedical research tool, rather than a diagnostic platform for use in the clinic.
Clinical translation has been hindered by several significant barriers including speed of data acquisition and poor spatial resolution. There have been some exciting developments which have the potential to reduce these barriers. For example, exploiting the multiplex advantage of focal plane array detectors has enabled chemical images of large areas of tissue to be acquired in a matter of minutes.19 Demand for high throughput has led to the development of discrete frequency imaging systems using quantum cascade laser (QCL) technology, capable of producing high resolution images in a fraction of the time of an FTIR system utilising state of the art FPA technology.20 Furthermore recent developments in high resolution infrared microscope optics have led to truly diffraction limited spatial resolution, enabling sub-cellular images to be acquired with a conventional globar source.21 One key barrier which still remains to be addressed is the question of how infrared chemical imaging will fit into the pathologist's workflow. Infrared chemical imaging in transmission mode is performed using a thin section of tissue on a substrate highly transparent in the mid-infrared region. Calcium fluoride (CaF2) or barium fluoride (BaF2) substrates are commonly used but have the disadvantage that they are expensive (£60 per slide) and are quite fragile, requiring careful handling. Unfortunately this fragility makes them unsuitable for use in automated tissue preparation equipment, with each section requiring manual preparation. Furthermore if the sections are haematoxylin and eosin (H&E) stained post infrared imaging they are unsuitable, due to their fragility, to be used within the automated rack systems on both automated strainers, coverslippers and brightfield imaging scanners. The transflection sampling modality utilises a transparent glass slide which has an infrared reflective layer. Tissue is sectioned onto the infrared reflective coating and infrared light is transmitted through the tissue, reflects off the substrate, and then is transmitted back through the tissue a second time. Transflection substrates have the advantage that they are cheap (£2 per slide) and are as robust as standard glass histology slides. Recently, however, concerns have been expressed regarding their suitability for spectral histopathology due to distortions arising from the electric field standing wave effect (EFSW).22–24 The distortion manifests itself as the deviation from Beer–Lambert absorption as a function of wavelength. While it has been argued that the effect can be minimised by ensuring all tissue sections have exactly the same thickness,25 variations in accuracy of microtomes,26 differing skill levels of operators, combined with different working practices between hospitals render this unlikely. The advantages of transflection slides (cost, robustness) needs to be balanced against the reliability of any conclusions drawn from their use, and the potential impact that this may have on patient care.
Recently Bassan et al.27 demonstrated that standard glass histology slides have the potential to be used for infrared chemical imaging of tissue. Despite glass being mostly opaque in the mid-infrared, there is a narrow window between 2500–3800 cm−1 where there is sufficient transmission to enable unrestricted access to the N–H, O–H and C–H stretching region. Utilising a four class histological model, excellent classification accuracies were achievable and good discrimination observed between malignant and non-malignant epithelium using univariate analysis.
While unstained tissue sections on glass substrates are practical for use in the clinic, they are not without disadvantages. Performing SHP utilising a serial section of unstained tissue, adjacent to the H&E stained section, presents image registration problems. Furthermore there is no guarantee that malignant tissue present in stained section will be found in the other. Ultimately, successful clinical translation of infrared chemical imaging for disease diagnosis demands utilisation of the actual H&E stained samples currently used by the pathologist. At the present time no studies have investigated the feasibility of SHP using standard H&E stained histopathology slides.
The effect of the stain on the infrared spectra of tissue has been previously investigated. Pijanka et al.28 has studied cells within tissue in transflection mode and compared the infrared spectra prior to and following H&E staining. The authors noted that the stain resulted in the emergence of a new peak at 1378 cm−1, and the disappearance of two bands in the lipid region at 2850 cm−1 and 2920 cm−1. While the appearance of the new band was attributed to the impact of the staining, the removal of the bands in the lipid region was believed to be due to the ethanol washings used during the staining process. Crucially no further changes to the infrared spectra were observed following staining. In light of this we report on the first case of infrared spectral histopathology using standard H&E stained glass slides as received from the pathologist. Motivated by Bassan et al. original work on glass27 we explore the feasibility of performing tissue type classification using H&E stained tissue and consider the implications for disease diagnosis and the possibility of implementation of automated pre-screening in the clinic.
2 Materials and methods
2.1 Sample preparation
Formalin fixed paraffin embedded tissue was obtained by transurethral resection of the prostate, following informed consent and ethical approval under Trent Multi-centre Research Ethics Committee (01/4/061). 4 μm sections of each block were microtomed and fixed onto standard glass histological slides (75 × 25 × 1 mm). Each section was dewaxed in xylene, rehydrated through graded ethanol and underwent H&E staining. In addition nine 4 μm contiguous sections of benign prostatic hyperplasia (BPH) tissue were microtomed and floated onto separate glass histological slides. Each slide was dewaxed in xylene, rehydrated in graded ethanol and stained to different degrees using a variety of immersion times in haematoxylin and eosin.Each slide was then coverslipped using standard type #1.5 histological cover slips (50 × 24 × 0.16 mm) and mounted on to the tissue using Pertex; CellPath, Newtown, Powys, Wales, United Kingdom, mounting medium. Finally, each slide was allowed to dry in air for a period of 24 hours.
Immediately prior to infrared imaging each slide was wiped on the front and back face using lint free tissue to remove any residual grease and dust which may have been present.
2.2 Infrared chemical imaging
Infrared chemical images were acquired utilising a Varian 670 IR infrared microscope fitted with a liquid nitrogen cooled mercury cadmium telluride (MCT) 128 × 128 focal plane array detector. The microscope utilises ×15 Cassegrain optics with a resultant field of view of 704 × 704 μm and a corresponding pixel size of 5.5 μm, enabling each 1 mm tissue microarray (TMA) core to be imaged as a 2 × 2 mosaic.The prostate tissue used in this study arises from a large sample set of 1473 tissue cores from 244 patients spread over 18 separate H&E stained glass slides. 100 patients were selected from the sample set, and where possible a malignant and normal associated tissue core identified for each. In total 182 cores were selected (95 malignant and 87 normal associated tissue) across 18 H&E stained glass slides. Pathological examination revealed a broadly even distribution of Gleason grades within the malignant cores, with 41 cores having Gleason score ≤7, and 54 having Gleason score ≥8. The Gleason grading system29 describes how glandular prostate tissue is, with grade 1 resembling normal prostate tissue and grade 5 having few or no recognisable glands. The Gleason score is obtained from the sum of the two most dominant grades in the biopsy with a higher score representing a cancer with a poor prognosis.
Infrared spectra were acquired at 5 cm−1 resolution using the co-addition of 256 and 96 scans for background and sample respectively. Since the coverslip is attached to the tissue using mounting media, background images were chosen from a clean area of the glass slide some distance away from the coverslip with the infrared light passing through the glass slide only. Chemical images of each core were acquired as a 2 × 2 mosaic and took approximately 17 minutes to collect. Interferograms were processed into absorption spectra using Happ-Genzel apodisation with 2 levels of zero filling giving a data spacing of 1.929 cm−1, and the spectral region 2200–3800 cm−1 being retained.
2.3 Data pre-processing
All spectra were pre-processed using Matlab (The Mathworks, Natick, MA), and the ProSpect toolbox (London Spectroscopy Ltd, London, UK). Infrared tiles from each core were stitched together in Matlab to form a single (256 × 256 × 831) data cube consisting of 65![[thin space (1/6-em)]](https://www.rsc.org/images/entities/char_2009.gif) 536 individual spectra with 831 data points each. Spectra were quality tested to remove spectra from areas free of tissue or those which exhibited high levels of scattering. Quality testing was performed based on the height of the amide A band (3298 cm−1), with spectra having an amide A intensity between 0.1–1 being retained. Spectra were then truncated to exclude regions with little or low diagnostic information, with the region 3125–3700 cm−1 being retained.
536 individual spectra with 831 data points each. Spectra were quality tested to remove spectra from areas free of tissue or those which exhibited high levels of scattering. Quality testing was performed based on the height of the amide A band (3298 cm−1), with spectra having an amide A intensity between 0.1–1 being retained. Spectra were then truncated to exclude regions with little or low diagnostic information, with the region 3125–3700 cm−1 being retained.
A PCA based noise reduction algorithm was implemented to improve the signal to noise of the spectra. Generally, the largest variation in a spectral data set arises from chemical information rather than random noise. Decomposing spectra into principal components, retaining the lower order PC's and recombining the data set can often effectively improve the signal to noise. Good improvements in spectral signal to noise were observed when utilising PCA based noise reduction30 with 15 PC's. De-noised spectra were then vector normalised to account for variations in absorption band intensity due to different thicknesses of tissue. Finally each spectrum was converted to its first derivative using 19 point Savitzky–Golay smoothing.
3 Results
3.1 Infrared chemical imaging of H&E stained tissue
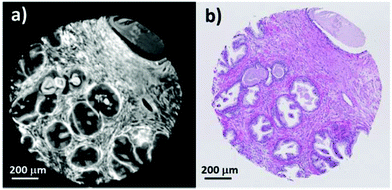
Currently, standard practice in infrared spectral histopathology is to identify regions of interest by comparison to an H&E stained serial section. Serial sections have the disadvantage that there are often morphological and architectural differences rendering image registration challenging. Infrared chemical imaging using the actual H&E stained slide has the advantage that the morphology exactly matches the brightfield image, eliminating difficulties associated with image registration.Fig. 1a shows a false greyscale chemical image obtained for a single prostate normal associated tissue core rendered using the peak height of the amide A band at 3298 cm−1. Comparison to the brightfield visible image (Fig. 1b) reveals excellent agreement in the morphology and highlights the fine detail presented in the infrared chemical image. Thin strands of stroma separating regions of glandular epithelium, can be clearly distinguished due to the high contrast in the image. Well-defined boundaries can also be discerned between the different histological classes.
Chemical images of each of the 182 prostate tissue cores were compared to each brightfield image to identify areas of epithelium, stroma, blood and concretion (luminal secretions commonly found in benign prostate acini).
Using the methods of Fernandez6 a spectral database was constructed consisting of 347![[thin space (1/6-em)]](https://www.rsc.org/images/entities/char_2009.gif) 293 epithelium, 196
293 epithelium, 196![[thin space (1/6-em)]](https://www.rsc.org/images/entities/char_2009.gif) 081 stroma, 8151 blood, and 15
081 stroma, 8151 blood, and 15![[thin space (1/6-em)]](https://www.rsc.org/images/entities/char_2009.gif) 429 concretion spectra. The method of constructing the database consists of two principle steps. Areas of each histological class are identified from the brightfield image and the corresponding pixels in the chemical image are annotated using a specific colour for each class. Importing the annotated chemical image into Matlab returns indices for the selected pixels, which can then be used to extract spectra belonging to each histological class.
429 concretion spectra. The method of constructing the database consists of two principle steps. Areas of each histological class are identified from the brightfield image and the corresponding pixels in the chemical image are annotated using a specific colour for each class. Importing the annotated chemical image into Matlab returns indices for the selected pixels, which can then be used to extract spectra belonging to each histological class.
The mean raw spectra for each of the histological classes are shown in Fig. 2. Inspection of the spectra reveals that the lipid region is dominated by three intense bands at 2874 cm−1, 2934 cm−1, and 2959 cm−1. Although paraffin wax is known to have three main bands in the C–H stretching region,31 these occur at 2846 cm−1, 2917 cm−1, and 2954 cm−1, which is entirely inconsistent with the bands observed in the spectra. Furthermore since the paraffin embedded tissue was de-waxed and rehydrated through graded alcohols prior to staining, it is unlikely that significant amounts of residual paraffin remain. Spectra were acquired from an area of the slide which was tissue free with the infrared light passing through the coverslip mountant and glass slide. The mean spectrum is shown in Fig. 3 and has the same band positions and relative intensities as those in Fig. 2 indicating that they originate from the mountant used to attach the coverslip to the slide.
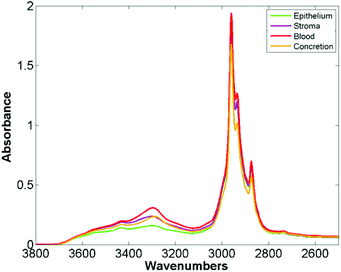 | ||
| Fig. 2 Mean spectra of epithelium, stroma, blood and concretion in the glass transmission window obtained for 182 H&E stained prostate tissue cores. | ||
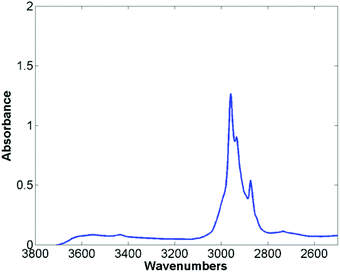 | ||
| Fig. 3 Mean spectra taken from an area free of tissue, passing through the cover slip, mount media and histological glass slide. | ||
In contrast to the lipid region, examination of the amide A region reveals a wealth of biochemical information. There are distinct differences in the mean spectra for each histological class, with clear differences in the spectral line shapes suggesting that the amide A band could be used for discriminating between the histological classes.
3.2 Automated histological classification of H&E stained tissue
Patients were randomly split into 5 subsets with one subset of patients to be used as a training set, and the remaining subsets as an independent test set. Creating separate training and test cohorts prior to training the model ensures that the test set is truly independent. The two patient cohorts were each used to construct a training and testing spectral database each containing spectra from the four histological classes. The number of spectra per class used to train the classifier was limited by the size of the histological class with the fewest spectra. Having identified the size of the smallest class, half this number of spectra (per class) were used for training the model with the remaining spectra in the training database being used for validation.A Random Forest32 classification algorithm (software available from http://code.google.com/p/randomforest-matlab/) was used to construct a classifier to differentiate between the four histological classes. Random Forests have the advantage that they can be run on large data sets and have high throughput making them suitable for classifying large areas of tissue. 200 trees were used to train the classifier and the number of variables selected at random to try and split each node set to 10. To enable the trees to grow as large as possible (at the expense of speed of training) the node size parameter was set to one. Training Random Forest on a relatively small number of spectra (typically between 2000–5000 spectra) enabled the classifier to be trained in less than two minutes.
The classifier was tested on the validation data set which consisted of 77![[thin space (1/6-em)]](https://www.rsc.org/images/entities/char_2009.gif) 747 epithelium, 35
747 epithelium, 35![[thin space (1/6-em)]](https://www.rsc.org/images/entities/char_2009.gif) 243 stroma, 1347 blood, and 586 concretion spectra.
243 stroma, 1347 blood, and 586 concretion spectra.
Receiver operator characteristic (ROC) curves33 are a common way of representing the inherent trade-off between sensitivity and specificity. Eqn (1) and (2) show sensitivity and specificity defined in terms of the true positive (TP), true negative (TN), false positive (FP) and false negative (FN).
 | (1) |
 | (2) |
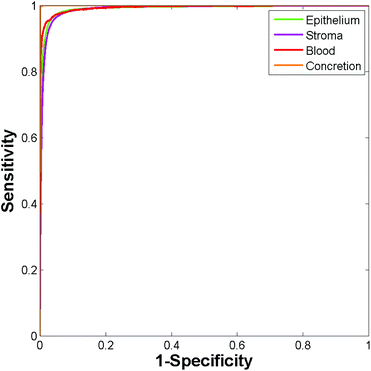
Construction of ROC curves for a binary system involves comparing the true positive rate to the false positive rate as the discrimination threshold is varied. ROC curves can be constructed for a four class system by grouping together three of the classes when determining the false positive rate. For example, in the case of epithelium the true positive rate (sensitivity) is determined as the proportion of actual epithelium spectra correctly classified as epithelium. The false positive rate (1 − specificity) is given by the proportion of non-epithelium spectra which were incorrectly classified as being epithelium. ROC curves were constructed using the perfcurve function in Matlab. Fig. 4 shows the ROC curves obtained using just 586 training spectra per class for constructing the model.
Area under the curve (AUC) values for each of the classes are all close to 1 (epithelium = 0.992, stroma = 0.990, blood = 0.994, concretion = 1), demonstrating that the classifier can easily discriminate between the four histological classes.
While the high accuracy of classification is evident, it is important to consider that a classifier trained and tested on the same patients is likely to provide over-optimistic results. Inter-patient variability can be a key confounding factor, and confidence in our methods requires high classification accuracy when applied to new patients not available during training. To address this the Random Forest model was used to classify 449![[thin space (1/6-em)]](https://www.rsc.org/images/entities/char_2009.gif) 591 spectra from 80 new independent patients. Classifying the entire independent test set comprising 268
591 spectra from 80 new independent patients. Classifying the entire independent test set comprising 268![[thin space (1/6-em)]](https://www.rsc.org/images/entities/char_2009.gif) 961 epithelium, 160
961 epithelium, 160![[thin space (1/6-em)]](https://www.rsc.org/images/entities/char_2009.gif) 153 stroma, 6219 blood, and 14
153 stroma, 6219 blood, and 14![[thin space (1/6-em)]](https://www.rsc.org/images/entities/char_2009.gif) 258 concretion spectra took approximately four minutes. The ROC curves obtained for the independent test set are shown in Fig. 5. The resulting AUC values are all close to 1 (epithelium = 0.986, stroma = 0.981, blood = 0.986, and concretion = 0.998).
258 concretion spectra took approximately four minutes. The ROC curves obtained for the independent test set are shown in Fig. 5. The resulting AUC values are all close to 1 (epithelium = 0.986, stroma = 0.981, blood = 0.986, and concretion = 0.998).
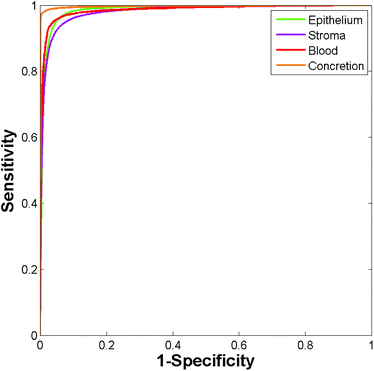 | ||
| Fig. 5 ROC curves for the independent test set obtained using the Random Forest. (Area under curve values obtained are: epithelium 0.986, stroma 0.981, blood 0.986, and concretion 0.998.) | ||
Table 1 shows the AUC values obtained for the training and independent test sets based on each of the 5 repeats. The resulting AUC values are all close to one indicating that the patients chosen to populate each group have only a minimal impact on classification accuracy. The AUC values are remarkably high considering that only 20 patients were used to train the model, and 80 were used for testing. Furthermore, the patients used for training and testing were randomly selected from cores spread over 18 separate histology slides suggesting a highly robust model.
| Repeat | Epithelium | Stroma | Blood | Concretion |
|---|---|---|---|---|
| Training | ||||
| 1 | 0.992 | 0.990 | 0.994 | 1 |
| 2 | 0.991 | 0.989 | 0.998 | 1 |
| 3 | 0.992 | 0.989 | 1 | 1 |
| 4 | 0.995 | 0.993 | 0.998 | 1 |
| 5 | 0.995 | 0.994 | 0.998 | 1 |
| Independent test set | ||||
| 1 | 0.986 | 0.981 | 0.986 | 0.998 |
| 2 | 0.986 | 0.982 | 0.975 | 0.999 |
| 3 | 0.988 | 0.983 | 0.971 | 0.998 |
| 4 | 0.982 | 0.982 | 0.974 | 0.998 |
| 5 | 0.985 | 0.980 | 0.976 | 0.998 |
While ROC's provide a useful graphical representation on classifier performance, they do not directly indicate accuracy of classification for each class. Each decision tree within the forest ‘votes’ for the class which it predicts the spectrum belongs to. The proportion of trees voting for a particular class provides a probability estimate of each spectrum belonging to that class. Defining a probability of acceptance threshold enables the forest to only classify those spectra where there is a reasonable probability of the classification being correct. Applying a probability of acceptance threshold to the Random Forest output enables a confusion matrix to be constructed showing the accuracy of prediction of each class. Utilising a probability of acceptance threshold of 0.6 enabled high classification accuracy while retaining 94% of spectra. Table 2 shows the mean confusion matrix produced using a probability of acceptance threshold of 0.6, for the independent test set, for each of the five repeats.
| Predicted class | ||||
|---|---|---|---|---|
| Epithelium | Stroma | Blood | Concretion | |
| True class | ||||
| Epithelium | 97.27 | 2.60 | 0.01 | 0.12 |
| Stroma | 3.70 | 94.20 | 2.09 | 0.01 |
| Blood | 2.79 | 5.63 | 91.51 | 0.07 |
| Concretion | 2.57 | 0.10 | 0 | 97.33 |
The table shows the resulting correctness of classification for each of the classes, indicating that each class can be correctly classified at an accuracy of >90%.
Finally the model was used to classify each of the prostate tissue cores, to assign each pixel to a predicted class. Fig. 6 shows the chemical image of all 182 prostate tissue cores which have been combined in Matlab to form a single chemical image. The image consists of approximately 20 million pixels, each representing an infrared spectrum. Each spectrum within the image was fed into the model and classified using an acceptance threshold of 0.6. The entire chemical image composed of 182 cores was classified in approximately 20 minutes. Rendering the false colour image using epithelium – green, stroma – purple, blood – red and concretion – orange enables a visual representation of the histological classes to be constructed for each core (Fig. 7).
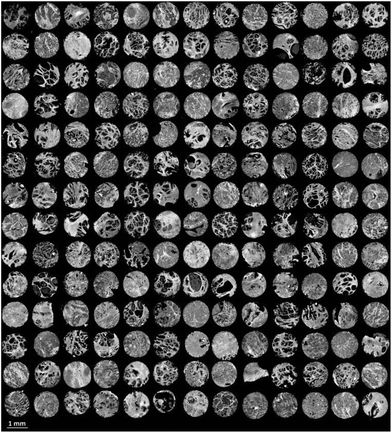 | ||
| Fig. 6 False grayscale image of 182 prostate tissue cores based on the intensity of the amide A (3298 cm−1) band. | ||
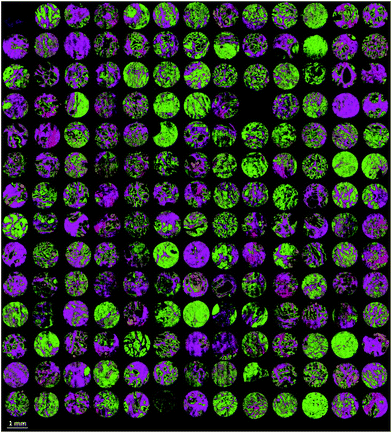 | ||
| Fig. 7 False colour image of the classified prostate tissue cores: green = epithelium, purple = stroma, red = blood, orange = concretion. | ||
Fig. 8(a) shows an enlarged false colour image of a single normal associated tissue core, and (b) its visible brightfield image. Excellent agreement is observed between the two images and even small regions containing blood can be clearly discerned within the stroma.
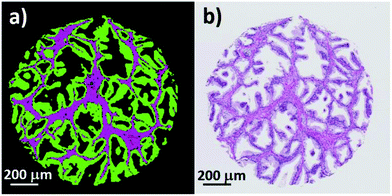 | ||
| Fig. 8 (a) False colour image of a single prostate core showing epithelium (green), stroma (purple), and blood (red). (b) Corresponding brightfield image of the same prostate core. | ||
3.3 Histological classification of different grades of staining
The false colour classification images in section 3.2 show that histological classes can be accurately determined with infrared chemical imaging using H&E stained tissue sections on glass. A key question to consider is whether we are discriminating histology on actual biochemical information or by the presence of the stain. We have considered that the discriminatory ability of the classifier could simply be due to the relative amounts of haematoxylin and/or eosin bound to each of the different types of tissue. Different operating practices between clinics inevitably result in variations in staining, and it is crucial that this is ruled out as a possible confounding factor. We have addressed this by staining 9 serial sections of BPH with varying immersion times in haematoxylin and eosin. Table 3 shows the staining duration for each of the nine tissue sections. Section B2 was stained using the standard staining protocol used for the TMA's in the main part of the study.| A1 | A2 | A3 |
| H: 15 s | H: 15 s | H: 15 s |
| E: 10 s | E: 30 s | E: 60 s |
| B1 | B2 | B3 |
| H: 60 s | H: 60 s | H: 60 s |
| E: 10 s | E: 30 s | E: 60 s |
| C1 | C2 | C3 |
| H: 120 s | H: 120 s | H: 120 s |
| E: 10 s | E: 30 s | E: 60 s |
Visible brightfield images were acquired from each section and these are shown in Fig. 9.
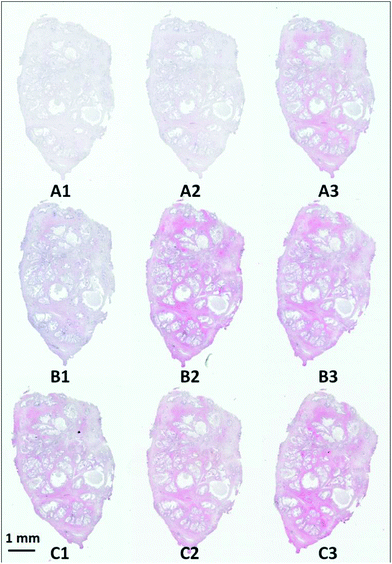 | ||
| Fig. 9 H&E stained serial sections of benign prostatic hyperplasia (BPH) following varying exposure durations to haematoxylin and eosin. | ||
Section A1 has the least staining and had the lowest duration of exposure to haematoxylin (15 s) and eosin (10 s). Increasing levels of purple and pink are observed in the images with the exposure duration to haematoxylin and eosin respectively. Infrared chemical images were acquired in the mosaic mode for each of the H&E stained images. Fig. 10 shows the false grayscale image rendered using the intensity of the amide A band at 3298 cm−1.
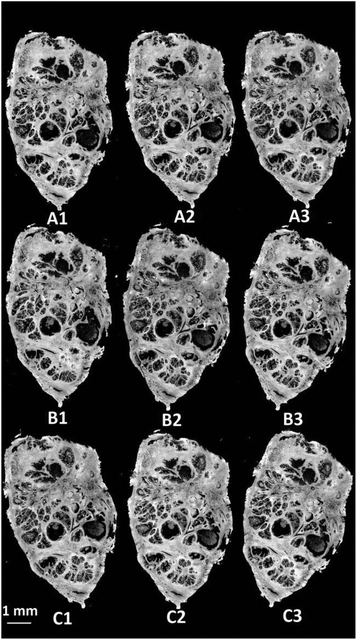 | ||
| Fig. 10 (a) False grayscale image of an H&E stained BPH sections rendered using the intensity of the 3298 cm−1 band. | ||
A spectral database was constructed for each section consisting of ≈10![[thin space (1/6-em)]](https://www.rsc.org/images/entities/char_2009.gif) 000 epithelium and stroma spectra. A Random Forest classifier was constructed for each section, which was then tested against spectra from each of the remaining 8 sections in turn, resulting in a total of 72 training and testing permutations. Fig. 11 shows the ROC's produced when training the classifier on the weakest stain (section A1), and testing on the strongest stain (section C3). The resulting AUC is close to 1 (0.995) demonstrating that despite training and testing on significantly different levels of stains there is excellent discrimination between each class. Applying a probability of acceptance threshold of 0.6 reveals a high level of classification accuracy for epithelium (95.55%) and stroma (97.96%). The model was then trained on the strongest stain (section C3) and tested on the weakest stain (section A1). The resulting ROC curve (Fig. 12) has an AUC of 0.984 with classification accuracy of 94.84% (epithelium) and 93.88% (stroma). The classification accuracies are broadly in line with those observed for the TMA's in the main part of the study for epithelium (97.27%) and stroma (94.20%). High classification accuracies observed in each case indicates that the different degrees of staining have no observable effect on the ability to discriminate between each class.
000 epithelium and stroma spectra. A Random Forest classifier was constructed for each section, which was then tested against spectra from each of the remaining 8 sections in turn, resulting in a total of 72 training and testing permutations. Fig. 11 shows the ROC's produced when training the classifier on the weakest stain (section A1), and testing on the strongest stain (section C3). The resulting AUC is close to 1 (0.995) demonstrating that despite training and testing on significantly different levels of stains there is excellent discrimination between each class. Applying a probability of acceptance threshold of 0.6 reveals a high level of classification accuracy for epithelium (95.55%) and stroma (97.96%). The model was then trained on the strongest stain (section C3) and tested on the weakest stain (section A1). The resulting ROC curve (Fig. 12) has an AUC of 0.984 with classification accuracy of 94.84% (epithelium) and 93.88% (stroma). The classification accuracies are broadly in line with those observed for the TMA's in the main part of the study for epithelium (97.27%) and stroma (94.20%). High classification accuracies observed in each case indicates that the different degrees of staining have no observable effect on the ability to discriminate between each class.
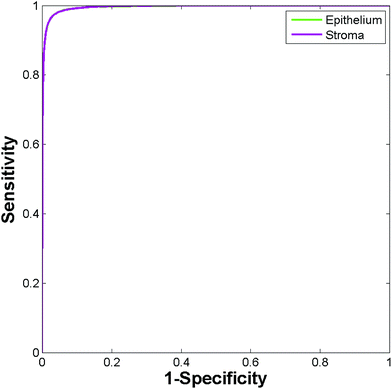 | ||
| Fig. 11 ROC curves for the independent test set using the low stain (section A1) for training and the high stain for testing (section C3). | ||
 | ||
| Fig. 12 ROC curves for the independent test set using the high stain (section C3) for training and the low stain for testing (section A1). | ||
In contrast to the high accuracies obtained when comparing a single pair of stains, the classification accuracy of other train![[thin space (1/6-em)]](https://www.rsc.org/images/entities/char_2009.gif) :
:![[thin space (1/6-em)]](https://www.rsc.org/images/entities/char_2009.gif) test combinations produced more mixed results. The overall mean classification accuracy for each of the 72 test set classifications was 89.60% for epithelium and 92.65% for stroma. Further examination of the test set classification results revealed that one of the sections (section C2) performed consistently poorly when being used for either training or testing. Mean AUC values for section C2 being used for training and all other sections used for testing were 0.948, with classification accuracies of 98.34% (stroma) and epithelium (40.00%).
test combinations produced more mixed results. The overall mean classification accuracy for each of the 72 test set classifications was 89.60% for epithelium and 92.65% for stroma. Further examination of the test set classification results revealed that one of the sections (section C2) performed consistently poorly when being used for either training or testing. Mean AUC values for section C2 being used for training and all other sections used for testing were 0.948, with classification accuracies of 98.34% (stroma) and epithelium (40.00%).
Upon visual examination of section C2, the glass coverslip appeared to be deformed which was likely to modify the transmitted infrared light. As yet, it is uncertain how common such confounding factors are given the limited size of the study. Larger studies using many different H&E stained slides are required to establish the impact of poor coverslipping on diagnostic accuracy.
Rejecting section C2 from the training and test sets produced more favourable results. The resulting mean AUC for the remaining 56 train![[thin space (1/6-em)]](https://www.rsc.org/images/entities/char_2009.gif) :
:![[thin space (1/6-em)]](https://www.rsc.org/images/entities/char_2009.gif) test permutations increased to 0.992 with excellent mean classification accuracies of 95.36% (epithelium) and 95.20% (stroma).
test permutations increased to 0.992 with excellent mean classification accuracies of 95.36% (epithelium) and 95.20% (stroma).
3.4 High throughput automated cancer diagnosis
Accurate discrimination of histological classes using H&E stained tissue is an important proof of concept for our study on glass. Performing spectral histopathology based on biochemical information rather than the presence of varying degrees of stain opens up the potential of rapid cancer pre-screening of slides. The ability to discriminate between malignant and normal associated tissue is essential if it is to be used as a diagnostic method to complement current histopathological practice. Reasonably good discrimination has previously been achieved (on glass) between malignant and non-malignant breast epithelium.27 However, to the best of our knowledge no quantitative results have been reported on diagnostic accuracy.Infrared spectral histopathology for prostate cancer diagnosis has been dominated by a focus on spectral changes in the epithelium. However, recent studies34 have shown that the biochemical changes occurring in the extracellular matrix (ECM) may have the potential to be biomarkers for cancer. Kumar35 discovered that upon moving away from the tumour into the ECM, there was a continuous progression in collagen spectral features, suggesting that the tumour microenvironment may have a role to play in SHP. We investigated these hypotheses on our H&E stained samples utilising a four class system composed of normal and cancer associated stroma, and normal and malignant epithelium.
Twenty patients were selected at random which provided a total of 32 cores (18 normal associated and 14 cancer). Regions of normal and malignant epithelium, and normal and cancer associated stroma, were identified from each core. Cancer associated stroma was identified as being stroma which occupies a region within 50 μm of the tumour boundary. A spectral database was constructed consisting of 35![[thin space (1/6-em)]](https://www.rsc.org/images/entities/char_2009.gif) 793 normal epithelium, 42
793 normal epithelium, 42![[thin space (1/6-em)]](https://www.rsc.org/images/entities/char_2009.gif) 095 malignant epithelium, 20
095 malignant epithelium, 20![[thin space (1/6-em)]](https://www.rsc.org/images/entities/char_2009.gif) 117 normal stroma and 9730 cancer associated stroma spectra. A training database was constructed by randomly extracting 4865 spectra per class from the spectral database, with the remaining spectra serving as a validation set. The Random Forest classifier was trained using 200 trees with the number of variables selected at random to try and split each node set to 10. Fig. 13 shows the ROC's obtained for testing the classifier on the validation data (86
117 normal stroma and 9730 cancer associated stroma spectra. A training database was constructed by randomly extracting 4865 spectra per class from the spectral database, with the remaining spectra serving as a validation set. The Random Forest classifier was trained using 200 trees with the number of variables selected at random to try and split each node set to 10. Fig. 13 shows the ROC's obtained for testing the classifier on the validation data (86![[thin space (1/6-em)]](https://www.rsc.org/images/entities/char_2009.gif) 838 spectra).
838 spectra).
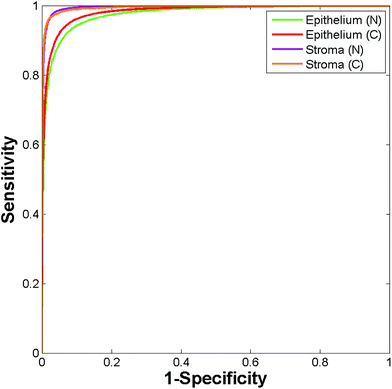
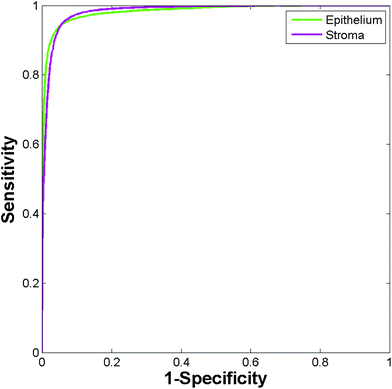
The resulting AUC's are all close to one (normal epithelium = 0.977, malignant epithelium = 0.983, normal stroma = 0.996, cancer associated stroma = 0.995) indicating highly accurate segmentation between each of the classes.
Setting a probability of acceptance threshold enables spectra to be rejected when the trees could not unanimously agree on the predicted class. Using a probability of acceptance threshold of 0.5 enabled >95% of the spectra to be correctly classified by the Random Forest model. Table 4 shows the confusion matrix obtained for classifying the spectra in the validation set. The diagonal shows classification accuracy for each of the classes, with each class correctly classified >95%. Of particular note is the high accuracy for stroma types which is just under 98% indicating the potential of using the stroma for highly accurate disease diagnosis.
| Predicted class | ||||
|---|---|---|---|---|
| Normal epithelium | Malignant epithelium | Normal stroma | Cancer associated stroma | |
| True class | ||||
| Normal epithelium | 95.70 | 3.15 | 1.10 | 0.04 |
| Malignant epithelium | 3.43 | 96.32 | 0.06 | 0.20 |
| Normal stroma | 0.48 | 0.11 | 97.93 | 1.49 |
| Cancer associated stroma | 0.05 | 0.63 | 1.51 | 97.82 |
Finally, the model was used to classify each of the prostate tissue cores to enable each pixel to be assigned to one of the four classes. Using the Random Forest histological model, any pixel spectrum belonging to a class other than epithelial or stroma was removed from the spectral database. The Random Forest model was then used to classify each pixel in each of the cores, with each core taking approximately 10 seconds to classify.
Fig. 14 shows the false colour image obtained by rendering malignant epithelium – red, cancer associated stroma – orange, normal epithelium – green and normal stroma – purple. The cores have been separated into normal and cancerous groups and then combined in Matlab. Inspection of the cancerous cores reveals that as expected, the majority of them have been classified with a high proportion of malignant epithelium (red) and cancer associated stroma (yellow). Cancerous cores can also contain normal epithelium and normal stroma, and this is borne out by some of the cores also having a low proportion of green and purple pixels. One of the cores has been classified as being mostly normal stroma (purple) and therefore appears to have been misclassified. In all but two cases, normal cores have all been classified with a high proportion of normal epithelium and normal stroma. There is some misclassification in two of the normal cores with some pixels being designated to malignant epithelium or cancer associated stroma. However, these misclassifications are not surprising given the limited number of spectra, and patients used to build the classifier.
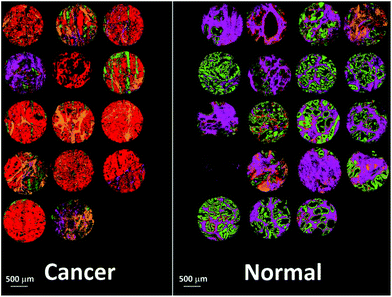 | ||
| Fig. 14 False colour image of the classified prostate tissue cores: red = malignant epithelium, orange = cancer associated stroma, green = normal epithelium, purple = normal stroma. | ||
4 Discussion
Successful clinical translation of infrared spectral histopathology ultimately demands the utilisation of readily available, low cost and robust substrates. Practical limitations of infrared transmission and transflection slides are well understood by our spectral histopathological community. Despite this, there have only been a limited number of studies utilising alternative substrates.27,36Glass slides have the clear advantage that they are readily available, robust, low cost and are already used ubiquitously by the pathologist in the clinic. Although promising, using unstained tissue serial sections on glass adjacent to the H&E stained section introduces challenging image registration issues, and there is no guarantee that both sections will contain any abnormalities present. Our belief is that this barrier to clinical translation can be overcome using H&E stained tissue sections on glass. Furthermore, this also provides a research tool enabling the interrogation of archival H&E slides which have associated long term clinical follow up.
In this study we have shown that we can utilise infrared chemical imaging with H&E stained coverslipped tissue on glass to discriminate between four major histological classes. Utilising just the amide A region of the infrared spectrum we constructed a robust model, which classified prostate tissue cores from 80 completely independent patients with high classification accuracy. Electing to use prostate tissue cores over 18 separate slides, all of which could have slightly different degrees of staining, varying thicknesses of mount media, and different transmission characteristics enables us to be confident in the robustness of the model.
Key to this study was the high throughput achieved in classification. The Random Forest classifier could be trained on 20 patients in under two minutes, and all 182 cores were classified in under 20 minutes (approximately 7 seconds per core). High throughput classification is essential to minimise any potential disruption to well established workflows. Throughput is currently limited by the speed of data acquisition, which for 182 cores translates to 51.5 hours. In this study we elected to use a large number of coadded scans at high spectral resolution to acquire spectra with high signal to noise ratios. Further work is currently ongoing to optimise collection parameters to reduce acquisition time and increase throughput.
An important question which arose within this study was the impact of the stain on classification accuracy. We have addressed this by using different degrees of haematoxylin and eosin staining for training and testing. Utilising nine differently stained serial sections of BPH, we have demonstrated that we can accurately discriminate between epithelium and stroma, with no distinguishable deterioration in classification accuracy due to the stain.
Finally, we have shown that by using both epithelium and stroma we can discriminate between normal and malignant tissue to a high degree of accuracy. Furthermore, we have shown that we can rapidly classify whole tissue cores in a matter of seconds. While the diagnostic potential looks promising, a larger study which has been robustly validated, and tested on independent patients is needed, and this work is currently ongoing. Successful discrimination of normal from cancerous tissue with SHP could pave the way for a pre-screening method which could reduce pathologist workload, with pathological review only being necessary on suspect or abnormal samples.
5 Conclusions
In this study we have shown that we can discriminate between four separate histological classes using H&E stained samples as received from the pathologist. We have demonstrated that we can perform rapid automated histology and achieve excellent classification accuracy. In addition, we have shown that the degree of staining is not a confounding factor and that the presence of the stain results in no observable deterioration in classification accuracy. The methods presented here could potentially be extended to different types of tissue and/or different types of stains. Future work will focus on discriminating normal versus malignant tissue from a large set of independent patients, and this work is currently being undertaken.Acknowledgements
PG and MP would like to acknowledge the EPSRC (EP/K02311X/1, EP/L012952/1) and the Williamson Trust for funding.Notes and references
- W. C. E. Stewart BW, World Cancer Report, 2014 Search PubMed.
- S. Hofvind, R. Sørum and S. Thoresen, Acta Oncol., 2008, 47, 225–231 CrossRef PubMed.
- Independent UK Panel on Breast Cancer Screening, Lancet, 2012, 380, 1778–1786 CrossRef.
- D. L. Weaver, R. D. Rosenberg, W. E. Barlow, L. Ichikawa, P. A. Carney, K. Kerlikowske, D. S. M. Buist, B. M. Geller, C. R. Key, S. J. Maygarden and R. Ballard-Barbash, Cancer, 2006, 106, 732–742 CrossRef PubMed.
- M. Pilling and P. Gardner, Chem. Soc. Rev., 2016, 45, 1935–1957 RSC.
- D. C. Fernandez, R. Bhargava, S. M. Hewitt and I. W. Levin, Nat. Biotechnol., 2005, 23, 469–474 CrossRef CAS PubMed.
- M. J. Baker, E. Gazi, M. D. Brown, J. H. Shanks, N. W. Clarke and P. Gardner, J. Biophotonics, 2009, 2, 104–113 CrossRef CAS PubMed.
- E. Gazi, J. Dwyer, P. Gardner, A. Ghanbari-Siahkali, A. P. Wade, J. Miyan, N. P. Lockyer, J. C. Vickerman, N. W. Clarke, J. H. Shanks, L. J. Scott, C. A. Hart and M. Brown, J. Pathol., 2003, 201, 99–108 CrossRef CAS PubMed.
- E. Gazi, M. Baker, J. Dwyer, N. P. Lockyer, P. Gardner, J. H. Shanks, R. S. Reeve, C. A. Hart, N. W. Clarke and M. D. Brown, Eur. Urol., 2006, 50, 750–761 CrossRef PubMed.
- X. Mu, M. Kon, A. Ergin, S. Remiszewski, A. Akalin, C. M. Thompson and M. Diem, Analyst, 2015, 140, 2449–2464 RSC.
- F. Großerueschkamp, A. Kallenbach-Thieltges, T. Behrens, T. Bruning, M. Altmayer, G. Stamatis, D. Theegarten and K. Gerwert, Analyst, 2015, 140, 2114–2120 RSC.
- J. Nallala, M.-D. Diebold, C. Gobinet, O. Bouche, G. D. Sockalingum, O. Piot and M. Manfait, Analyst, 2014, 139, 4005–4015 RSC.
- C. Kuepper, F. Großerueschkamp, A. Kallenbach-Thieltges, A. Mosig, A. Tannapfel and K. Gerwert, Faraday Discuss., 2016, 187, 105–118 RSC.
- A. Kallenbach-Thieltges, F. Großerüschkamp, A. Mosig, M. Diem, A. Tannapfel and K. Gerwert, J. Biophotonics, 2013, 6, 88–100 CrossRef PubMed.
- A. A. Ahmadzai, I. I. Patel, G. Veronesi, P. L. Martin-Hirsch, V. Llabjani, M. Cotte, H. F. Stringfellow and F. L. Martin, Appl. Spectrosc., 2014, 68, 812–822 CrossRef CAS PubMed.
- B. Bird, K. Bedrossian, N. Laver, M. Miljković, M. J. Romeo and M. Diem, Analyst, 2009, 134, 1067–1076 RSC.
- N. Bergner, B. F. M. Romeike, R. Reichart, R. Kalff, C. Krafft and J. Popp, Analyst, 2013, 138, 3983–3990 RSC.
- V. Šablinskas, V. Urbonienė, J. Ceponkus, A. Laurinavicius, D. Dasevicius, F. Jankevičius, V. Hendrixson, E. Koch and G. Steiner, J. Biomed. Opt., 2011, 16, 096006 CrossRef PubMed.
- P. Bassan, A. Sachdeva, J. H. Shanks, M. D. Brown, N. W. Clarke and P. Gardner, Proc. SPIE, 2014, 9041 Search PubMed , 90410D.
- P. Bassan, M. J. Weida, J. Rowlette and P. Gardner, Analyst, 2014, 139, 3856–3859 RSC.
- C. Hughes, A. Henderson, M. Kansiz, K. M. Dorling, M. Jimenez-Hernandez, M. D. Brown, N. W. Clarke and P. Gardner, Analyst, 2015, 140, 2080–2085 RSC.
- P. Bassan, J. Lee, A. Sachdeva, J. Pissardini, K. M. Dorling, J. S. Fletcher, A. Henderson and P. Gardner, Analyst, 2013, 138, 144–157 RSC.
- M. J. Pilling, P. Bassan and P. Gardner, Analyst, 2015, 140, 2383–2392 RSC.
- J. Filik, M. D. Frogley, J. K. Pijanka, K. Wehbe and G. Cinque, Analyst, 2012, 137, 853–861 RSC.
- K. Kochan, P. Heraud, M. Kiupel, V. Yuzbasiyan-Gurkan, D. McNaughton, M. Baranska and B. R. Wood, Analyst, 2015, 140, 2402–2411 RSC.
- G. J. C. A. Anthony, T. M. A. Bocan and J. A. Doebler, Histochem. J., 1984, 37, 339–345 Search PubMed.
- P. Bassan, J. Mellor, J. Shapiro, K. J. Williams, M. P. Lisanti and P. Gardner, Anal. Chem., 2014, 86, 1648–1653 CrossRef CAS PubMed.
- J. K. Pijanka, N. Stone, G. Cinque, Y. Yang, A. Kohler, K. Wehbe, M. Frogley, G. Parkes, J. Parkes, P. Dumas, C. Sandt, D. G. v. Pittius, G. Douce, G. D. Sockalingum and J. Sulé-Suso, Spectroscopy, 2010, 24 Search PubMed.
- D. F. Gleason, in Urological Pathology – The Prostate, ed. M. Tannenbaum, Lee and Febiger, Philadelphia, 1977, p. 171 Search PubMed.
- R. Bhargava, S. Q. Wang and J. L. Koenig, Appl. Spectrosc., 2000, 54, 1690–1706 CrossRef CAS.
- C. Hughes, L. Gaunt, M. Brown, N. W. Clarke and P. Gardner, Anal. Methods, 2014, 6, 1028–1035 RSC.
- L. Breiman, Machine Learning, 2001, 45, 5–32 CrossRef.
- J. A. Swets, Science, 1988, 240, 1285–1293 CAS.
- R. Kong, R. K. Reddy and R. Bhargava, Analyst, 2010, 135, 1569–1578 RSC.
- S. Kumar, C. Desmedt, D. Larsimont, C. Sotiriou and E. Goormaghtigh, Analyst, 2013, 138, 4058–4065 RSC.
- D. Perez-Guaita, D. Andrew, P. Heraud, J. Beeson, D. Anderson, J. Richards and B. R. Wood, Faraday Discuss., 2016, 187, 341–352 RSC.
| This journal is © The Royal Society of Chemistry 2017 |

