
SIproc: an open-source biomedical data processing platform for large hyperspectral images
Sebastian
Berisha
 a,
Shengyuan
Chang
b,
Sam
Saki
c,
Davar
Daeinejad
a,
Ziqi
He
d,
Rupali
Mankar
a and
David
Mayerich
*a
a,
Shengyuan
Chang
b,
Sam
Saki
c,
Davar
Daeinejad
a,
Ziqi
He
d,
Rupali
Mankar
a and
David
Mayerich
*a
aDepartment of Electrical and Computer Engineering, University of Houston, Houston, TX, USA. E-mail: mayerich@uh.edu
bSchool of Optical and Electronic Information, Huazhong University of Science and Technology, Wuhan, Hubei, China
cDepartment of Electronics, Information and Bioengineering (DEIB), Polytechnic University of Milan, Milan, Italy
dMing Hsieh Department of Electrical Engineering, University of Southern California, Los Angeles, CA, USA
First published on 23rd November 2016
Abstract
There has recently been significant interest within the vibrational spectroscopy community to apply quantitative spectroscopic imaging techniques to histology and clinical diagnosis. However, many of the proposed methods require collecting spectroscopic images that have a similar region size and resolution to the corresponding histological images. Since spectroscopic images contain significantly more spectral samples than traditional histology, the resulting data sets can approach hundreds of gigabytes to terabytes in size. This makes them difficult to store and process, and the tools available to researchers for handling large spectroscopic data sets are limited. Fundamental mathematical tools, such as MATLAB, Octave, and SciPy, are extremely powerful but require that the data be stored in fast memory. This memory limitation becomes impractical for even modestly sized histological images, which can be hundreds of gigabytes in size. In this paper, we propose an open-source toolkit designed to perform out-of-core processing of hyperspectral images. By taking advantage of graphical processing unit (GPU) computing combined with adaptive data streaming, our software alleviates common workstation memory limitations while achieving better performance than existing applications.
There has been significant interest within the spectroscopic community to explore the benefits of vibrational spectroscopy in biomedical research and clinical diagnosis. Standard histology relies on both the chemical composition, often labeled through traditional markers, dyes, and stains, and the spatial distribution of tissue types. Therefore one would expect comparable instrumentation utilizing spectroscopy imaging to also provide spatial context and resolution. The introduction of focal plane arrays (FPAs) into Fourier transform infrared (FTIR) instrumentation has made this type of data collection practical1 on a scale amenable to a standard histological study. While instrumentation is likely not yet fast enough for clinical viability, the ability to differentiate tissue types critical for cancer diagnosis has been shown in studies using tissue microarrays (TMAs).2 In addition, the introduction of high-resolution optics into infrared systems has been moved from coherent synchrotron sources3 to benchtop systems.4 This, in turn, has enabled the study of samples at resolutions comparable to traditional histology and near the diffraction limit of infrared (IR) imaging.5,6 While not currently viable for large histological samples, resolution can be further enhanced using attenuated total reflectance (ATR) FTIR imaging.7
In addition to improvements in optics and detector systems, IR spectroscopy may benefit extensively from the availability of quantum cascade laser (QCL) sources.8 At the time of writing this manuscript, discrete frequency infrared (DFIR) systems using QCL sources are commercially available. These systems provide fast absorbance imaging at individual wavelengths and can significantly reduce imaging time when the desired spectral components are known beforehand.9 With further advances in IR instrumentation on the horizon, spectroscopic imaging systems are approaching the data throughput and robustness necessary for practical clinical applications.
However, a major bottleneck remains in the area of image processing and analysis. In particular, spectroscopic data sets contain hundreds of times more spectral content than traditional color histology images. This can result in data sets exceeding a terabyte of storage for a high-resolution (e.g. 1.1 μm per pixel) image of a tissue microarray (≈2 cm3). Data sets of this size are difficult to manage using the consumer hardware generally available through laboratory workstations. Alternatives include the use of high-performance computing (HPC) using clusters or supercomputers. However, these options generally require specialized software development, and the data sets must be transferred using ethernet connections with a limited bandwidth.
The problem of data maintenance is amplified in research applications where data often undergoes a range of processing steps, with experiments being performed at each output stage. These processing algorithms can range from basic piecewise linear baseline correction to more complex scattering inversions based on Mie theory.10,11 However, the tools for managing large data sets on standard workstations are severely limited. While standard mathematical packages, such as MATLAB (Mathworks), Octave, and SciPy, are robust and flexible, they require that data fit in a fraction of the available memory for processing. This is generally because the underlying functions rely on highly optimized algorithms that are memory intensive. Commercial applications such as ENVI (Harris Geospatial) provide the ability to manage large data sets, but these packages are expensive and difficult to extend without expertise in IDL software development.
In this paper, we describe the implementation of an open-source software framework for hyperspectral image processing, with a focus on biomedical image analysis with large data sets. All algorithms are implemented “out-of-core” by streaming from a secondary storage (e.g. hard drives, RAID, NAS). In this way, data fetches can hide processing time, ideally resulting in the processing of a data set in the same amount of time required to copy that data. In cases where data processing significantly exceeds data streaming, GPU-based algorithms are used to accelerate the processing and thereby minimize overall processing time. GPU processing is natively supported and transparent to the user (if appropriate hardware is available). Our algorithms and all the required libraries are distributed using the BSD license, and can therefore be included in other open-source applications and even commercial software. Data structures are designed to provide extensibility and are easily included in other software packages.
In general, the community has established a set of common processing protocols that have been shown to be effective for biological samples.12 In this paper, we will discuss our results in implementing a broad base of algorithms that generally fall into the following categories:
• Noise reduction – FTIR images often undergo a limited noise reduction process that is broadly divided between the processing of independent pixels, such as apodization and Savitzky–Golay13 filters, and image processing algorithms, commonly including the maximum noise fraction (MNF) transform.14,15
• Baseline correction/normalization – IR images are prone to effects caused by light scattering and density changes within heterogeneous samples. The proposed corrections include piecewise linear baseline correction or derivative calculations. These are generally followed by calculating either the vector (Euclidean) norm or performing band-normalization by dividing by a single common band (e.g. Amide I at ≈1650 cm−1).
• Dimension reduction – IR absorbance spectra generally contain information that is considered sparse in some subdomains. Identifying the areas of sparsity can significantly simplify downstream processing by reducing the number of image bands. Commonly used techniques include principal component analysis (PCA), end-member estimation such as vertex component analysis (VCA),16 or various chemometric techniques.17,18
• Classification – The goal of most histological studies is the study of the distribution of various tissue types in a tissue section. The final step in the spectroscopic imaging process is therefore most commonly pixel classification based on spectral features. This can take the form of unsupervised techniques, such as k-means clustering or hierarchical cluster analysis (HCA). Alternatively, supervised techniques can be used in combination with tissue annotations19–21 or even tissue overlays to duplicate classic stains.22
Experimental
The proposed framework is composed of a set of C++ classes that facilitates the addition of new algorithms and simple insertion into existing applications (Fig. 1). In this section, we describe the goals and strategies behind this framework, as well as some of the bottlenecks that have to be addressed when developing out-of-core algorithms for data processing.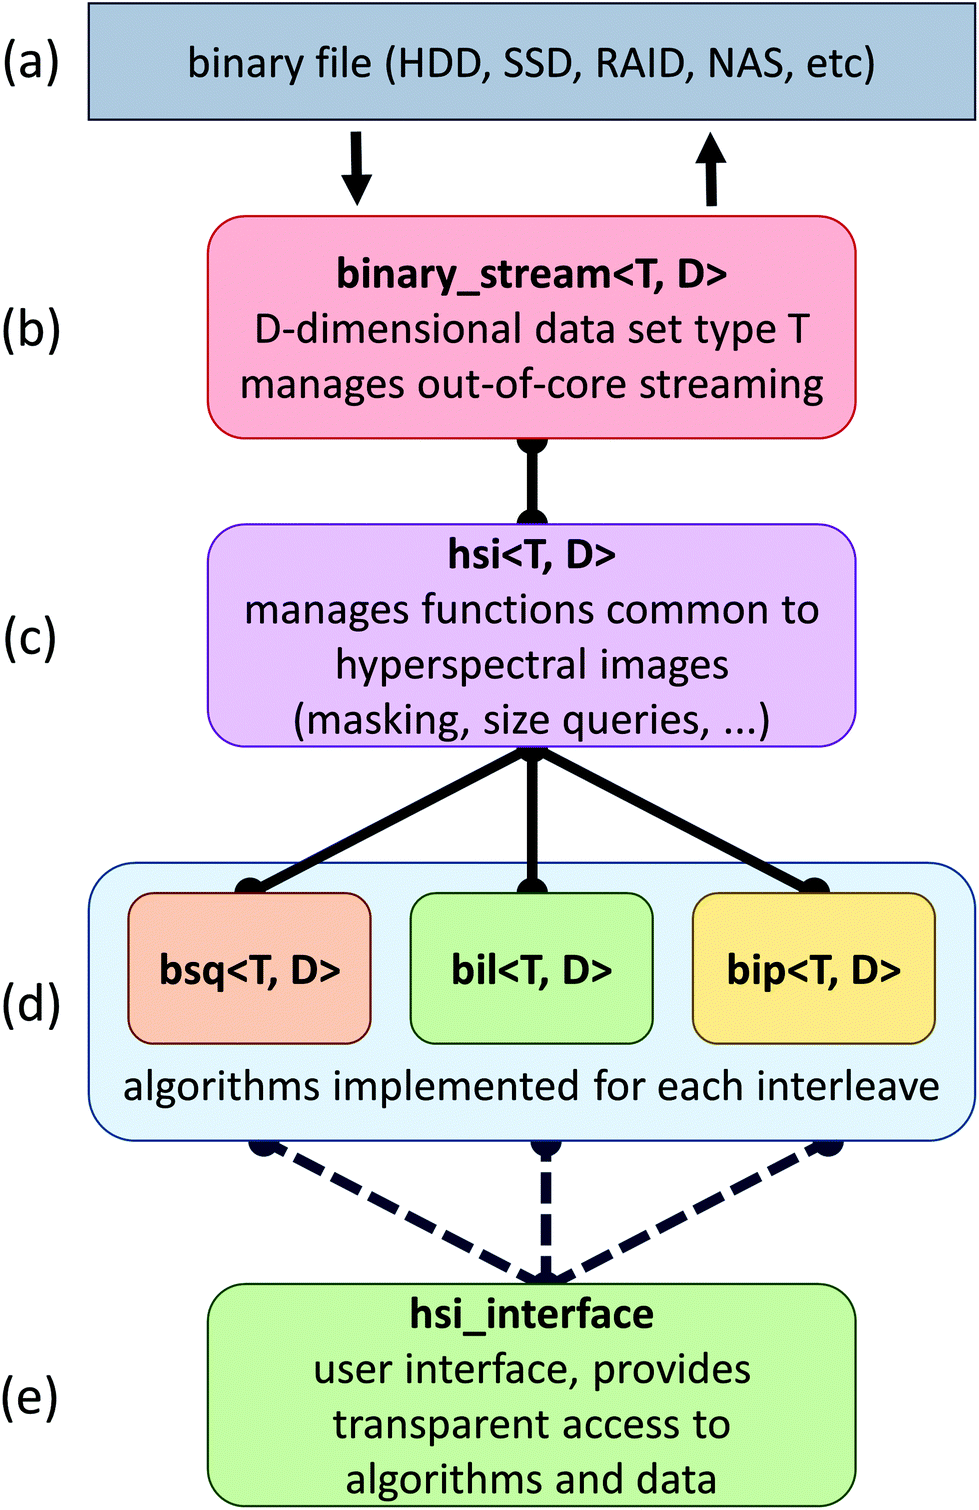 | ||
| Fig. 1 C++ class organization for SIproc. (a) Raw binary data are stored in a file in secondary storage. Access to this file is facilitated by the (b) binary_stream class, which contains methods for loading, saving, and accessing data points. (c) An intermediary class, hsi, implements methods common to all hyperspectral images. (d) Algorithm optimization is highly dependent on interleave format, so most algorithms have three different implementations that optimize speed for each interleave format. (e) The final hsi_interface class provides access to all algorithms using a common interface. | ||
The primary strategy behind the implementation of our framework is two fold: (a) hide the computational cost of algorithms within data fetches from a secondary storage and (b) minimize the time spent on these data fetches. When the computational costs for an algorithm cannot be hidden behind data fetches, we rely on the graphics hardware to further reduce computational costs.
Asynchronous adaptive streaming
Asynchronous input/output (IO) is a multi-threading approach that allows a computer system to simultaneously fetch data while processing. Asynchronous copies allow data fetches to occur in parallel with processing by launching separate threads that handle these fetches (Fig. 2). The use of asynchronous input/output (IO) has been extensively studied for problems involving big data applications, particularly on distributed systems23 such as supercomputers and clusters. Performance tuning in such cases involves selecting a number of parameters that are highly system dependent, particularly for heterogeneous computers.24 While this is a viable approach for supercomputing applications, it becomes impractical for individual workstations commonly used to process hyperspectral data from bench-top systems. For example, processing the same data sets on various workstations demonstrates unique profile curves for the same data sets that are dependent on the batch size used to break up the input stream (Fig. 3).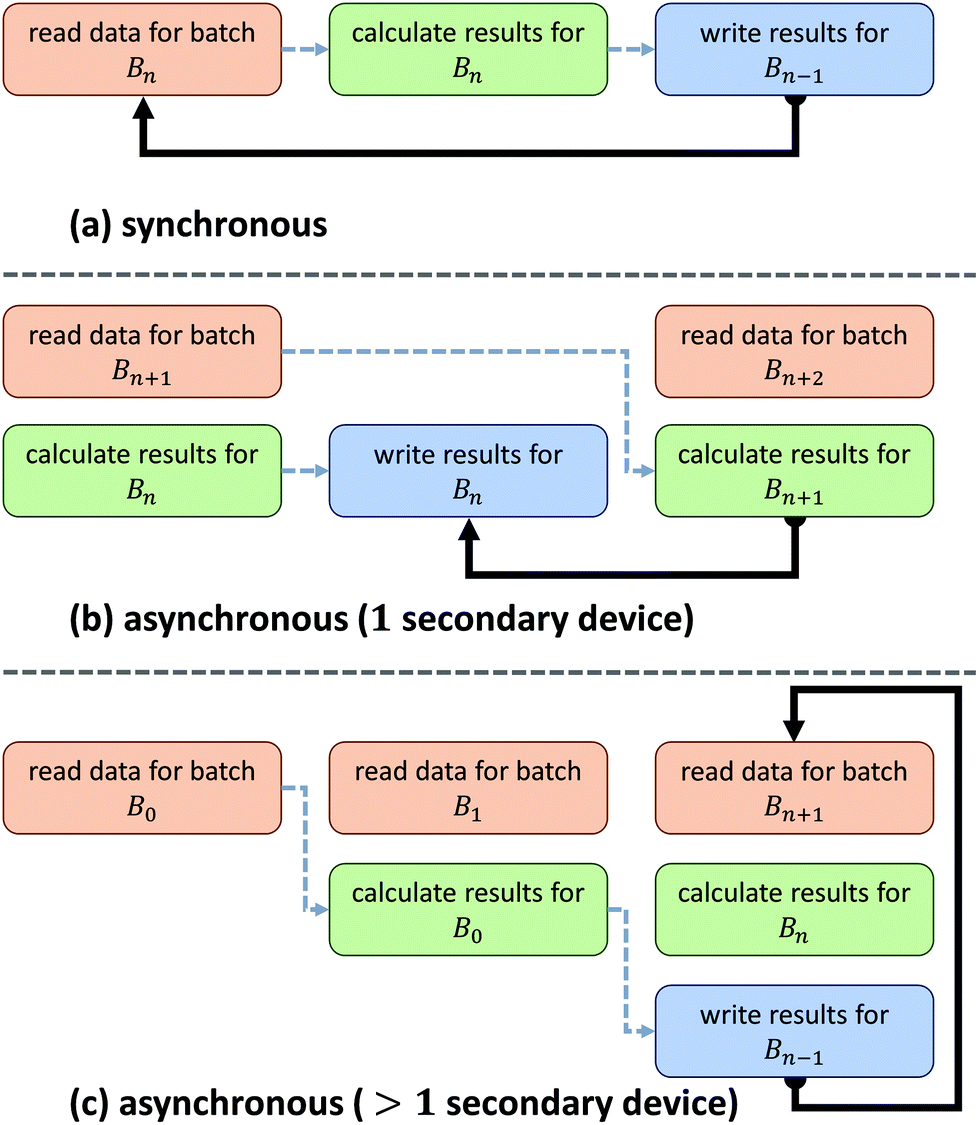 | ||
| Fig. 2 Asynchronous reads from secondary storage overlap with calculations. Data are divided into “batches” that are executed in a loop where each requires a read (orange), calculation (green), and write (blue) with transitions between steps shown (dashed arrow) along with the loop (solid arrow). (a) Synchronous computation requires a total processing time equal to the sum of all operations. (b) Better performance can be achieved with asynchronous data reads, effectively hiding calculations requiring less time. (c) Even better performance can be achieved with multiple storage devices or RAID systems. | ||
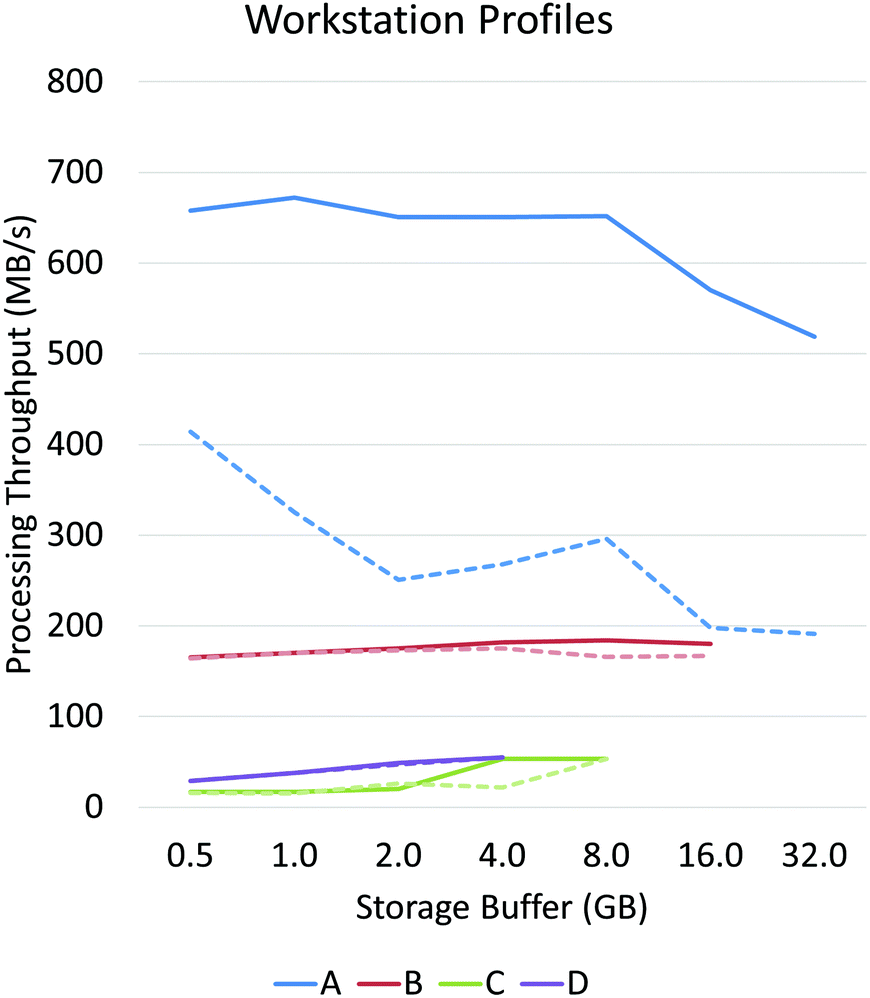 | ||
| Fig. 3 Performance profiles of four systems in descending order of expense (see Results and discussion for specifications) performing interleave conversion. Band sequential (BSQ) to bands interleaved by line (BSQ to BIL) are shown in solid lines and BSQ to bands interleaved by pixel (BIP) are shown in dotted lines. This figure demonstrates the significant variation in throughput (in GB s−1) based on streaming batch size. The largest possible batch size is directly limited by the available system memory (RAM), so low-end systems are limited to smaller batch sizes. Since BSQ → BIP conversion is more computationally complex, this profile suggests that all but system A are limited by IO fetches. | ||
In SIproc, we implement an adaptive scheme that utilizes asynchronous streaming while automatically selecting streaming and processing parameters during runtime using a gradient descent. Our software samples various parameters, particularly the streaming batch size, and maximizes data throughput over time using the gradient descent. For large data sets this technique offers increased performance by adjusting batch size to take advantage of disk caching and buffering at the beginning of a process, and dynamically changing batch size to compensate for slower data throughput as processing continues.
GPU computing
GPU computing is playing an increasing role in accelerating scientific computing applications. There are several factors that make GPUs a compelling alternative to traditional HPC systems. The cost of software development is one of the most important decision factors. The large market presence and better affordability over traditional large parallel computing systems (usually funded by government, universities, or corporations) have made GPUs economically attractive for application developers. Another important practical factor for using GPUs is accessibility. Execution environments such as large-scale expensive data-center servers or multiple-node cluster machines tend to limit the use and development of parallel software applications. GPUs can be easily installed and accessed in personal workstations. This makes GPU computing attractive particularly for biomedical applications, where the computing systems are usually based on some combinations of a workstation and special hardware accelerators. Another important consideration for programmers in selecting a processor is the ease of software development. The support of the compute unified device architecture (CUDA) programming model by nVidia has made it easy to develop general purpose applications on graphics chips by allowing programmers to use familiar C/C++ programming tools. Furthermore, GPUs support the Institute of Electrical and Electronics Engineers (IEEE) floating-point standard, thus allowing for easier software portability and results consistent with common mathematical packages such as MATLAB, IDL, and SciPy.Implemented algorithms
SIproc development has focused on the implementation of algorithms commonly used for histological work. This includes algorithms considered standard practice for baseline correction, normalization, and dimension reduction.12 Among the major bottlenecks encountered when streaming large hyperspectral data sets are various interleave methods. For example, band sequential (BSQ) formats provide fast access for chemometric calculations and visualization, while bands interleaved by pixel (BIP) formats are significantly faster for statistical applications such as principal component analysis (PCA) and maximum noise fraction (MNF) calculations. This is due to the high latency of random access on secondary storage devices. Even solid state drives (SSDs), which exhibit better random access performance, see a significant performance increase when data are accessed sequentially.We have developed specialized versions of each algorithm for the three most common interleave formats: BSQ, BIL, and BIP (Fig. 1). In cases where an interleave format makes an algorithm prohibitively time consuming, conversion is performed automatically.
For example, we have implemented PCA using the covariance matrix method, which is less stable than the alternatives but does not require random access across the entire data set. This algorithm requires three steps:
• Calculation of the mean spectrum, which can be done efficiently with any interleave format.
• Calculation of the mean covariance matrix, which requires an O(b2)-time tensor product calculation for each spectrum, where b is the number of bands.
• Eigendecomposition of the mean covariance matrix.
Since the eigendecomposition is independent of the number of pixels, this operation is relatively efficient with standard libraries like LAPACK. The most intensive algorithm in this example is computing the mean covariance matrix. When the data are optimally interleaved (BIP), the O(b2) calculation can be done in main memory. On most systems, this becomes the bottleneck. Fortunately, the tensor product is highly data parallel and amenable to GPU implementation. We use the cuBLAS matrix library to perform a fast rank-2 update, significantly improving performance (Fig. 4). Even after this optimization, PCA calculation is still compute limited and could be further parallelized on a multi-GPU system. The same principles apply to other common statistical methods, such as the MNF transform.14
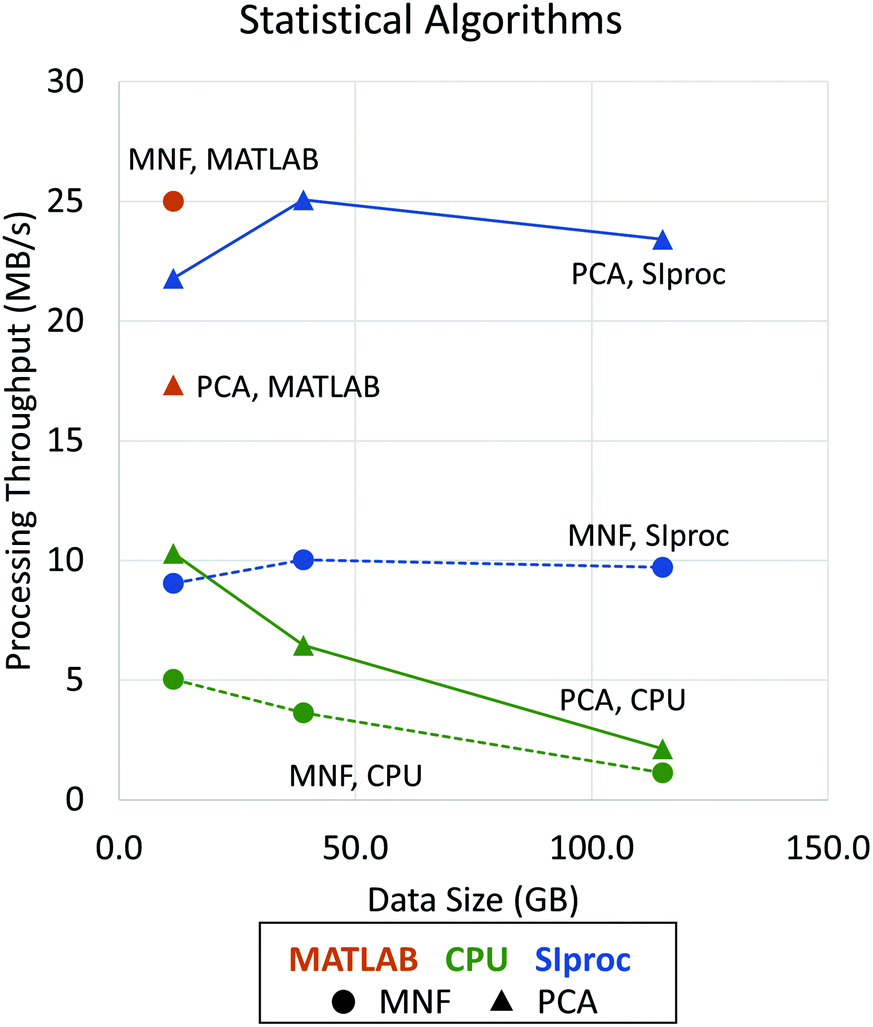 | ||
| Fig. 4 Performance improvements using asynchronous adaptive streaming with GPU computing. Data processing throughput (in MB s−1) is shown as a function of data size (in GB). Dotted lines with circle markers indicate the performance of MNF (forward and inverse algorithms) while solid lines with triangle markers show the performance of PCA (statistics computing and projection) implementations. Note that, due to memory limitations, performance results for MATLAB are shown only for a data size of 11.5 GB. The LAPACK matrix libraries are used by all tested applications, including MATLAB,28 IDL,29 and SIproc. However, MATLAB uses more stable and efficient methods that are impractical to apply to data sets processed out-of-core. SIproc attempts to mitigate these instabilities by using 64-bit floating point operations, which reduces GPU performance by ≈50%. | ||
Other algorithms, such as the BSQ → BIP interleave conversion, are more ambiguous. On almost every system we tested, interleave conversions were IO limited. However, our SSD RAID0 system (see Results and discussion) provided sufficient IO throughput to see a significant gain in performance (≈2×) using CUDA (Fig. 3).
In addition to standard pre-processing and statistical methods, we have also included supervised and unsupervised learning methods such as k-means clustering, random forests,25–27 and artificial neural networks designed to implement stainless staining.22
Results and discussion
PCA and MNF comparisons were performed on a Dell PowerEdge R730 with two Intel Xeon E5-2637 (3.5 GHz) processors, 64 GB of host memory, 3 1TB SSD drives using software RAID0, and an nVidia Tesla K40 graphics card.Workstation profiles of Fig. 3 were tested on a single 64 GB bone biopsy tissue microarray (TMA) and tested across four systems:
• System A (high-performance workstation) – 2× Intel Xeon E5-2643 processors, 64 GB RAM, 3TB SSD RAID0, Tesla K40 GPU.
• System B (mid-range workstation) – Intel i7-4790, 32 GB RAM, 1TB SSD, GeForce GTX 970 GPU.
• System C (personal computer) – Intel i5-4690, 16 GB RAM, 3TB HDD, GeForce GTX 970 GPU.
• System D (laptop) – Intel i7-4702HQ, 8 GB RAM, 3TB USB-3 external drive, GeForce GTX 970M GPU.
Data sets used for analysis were collected using an imaging spectrometer consisting of a Cary 670 Series FTIR Spectrometer coupled to a Cary 620 Series FTIR Microscope (Agilent Technologies, Santa Clara, CA). The system was equipped with a 128 × 128 pixel focal plane array (FPA) detector and 0.62NA objective, providing a pixel size of 1.1 μm resolution in high-magnification mode and 5.5 μm when mapping the FPA to the objective FOV. Spectra were recorded at 4 cm−1 resolution.
We demonstrate results from SIproc on the pre-processing and k-means clustering of spectra as well as MNF noise reduction. Both a kidney and breast biopsy array (Fig. 5 and 6) were purchased from Amsbio (AMS Biotechnology Europe). The samples were formalin fixed and paraffin embedded (FFPE) tissue sections cut at 5 μm thickness and mounted on calcium fluoride (CaF2) slides. Adjacent sections were mounted on standard glass histology slides and stained with hematoxylin and eosin (H&E). The IR slides were imaged on a Cary Series FTIR microscope using 1 co-addition, resulting in relatively noisy images. The images were pre-processed to remove noise using the MNF transform, keeping 10 signal bands. Spectra from the kidney images are shown in Fig. 5 both before and after the MNF processing step. The images were then baselined using a piecewise linear correction and normalized to the Amide I band (1650 cm−1). k-Means clustering was performed using k = 3 and k = 6 clusters. The results were color-mapped and overlaid onto the IR images at Amide I in the baseline-corrected data so that structural features could be seen. Note that increasing the cluster resolution provides significantly more class specificity, allowing the separation of ductal epithelium at k = 6, which is barely visible in k = 3 (Fig. 6b). Intra-lobular stroma, which is confounded with the adjacent epithelium at k = 3, is also more clearly separated at k = 6. Colors were manually specified based on the class most closely corresponding to epithelium (red/orange) and stroma (green/cyan).
 | ||
Fig. 5 Maximum noise fraction (MNF) transform and projection. Kidney cores are imaged using 1 interferogram co-addition and an MNF transform is applied to remove un-correlated noise from the image. The figure shows the image before (a) and after (b) MNF noise removal at ![[small nu, Greek, macron]](https://www.rsc.org/images/entities/i_char_e0ce.gif) = 1236 cm−1, as well as the log of the difference image (c). High-magnification insets for the corresponding regions (black boxes) are shown in (d, e, and f). The spectrum before and after MNF processing is also shown for the same point (asterisk). Images and spectra were created using SIproc and plots were imported into Microsoft Excel for visualization. = 1236 cm−1, as well as the log of the difference image (c). High-magnification insets for the corresponding regions (black boxes) are shown in (d, e, and f). The spectrum before and after MNF processing is also shown for the same point (asterisk). Images and spectra were created using SIproc and plots were imported into Microsoft Excel for visualization. | ||
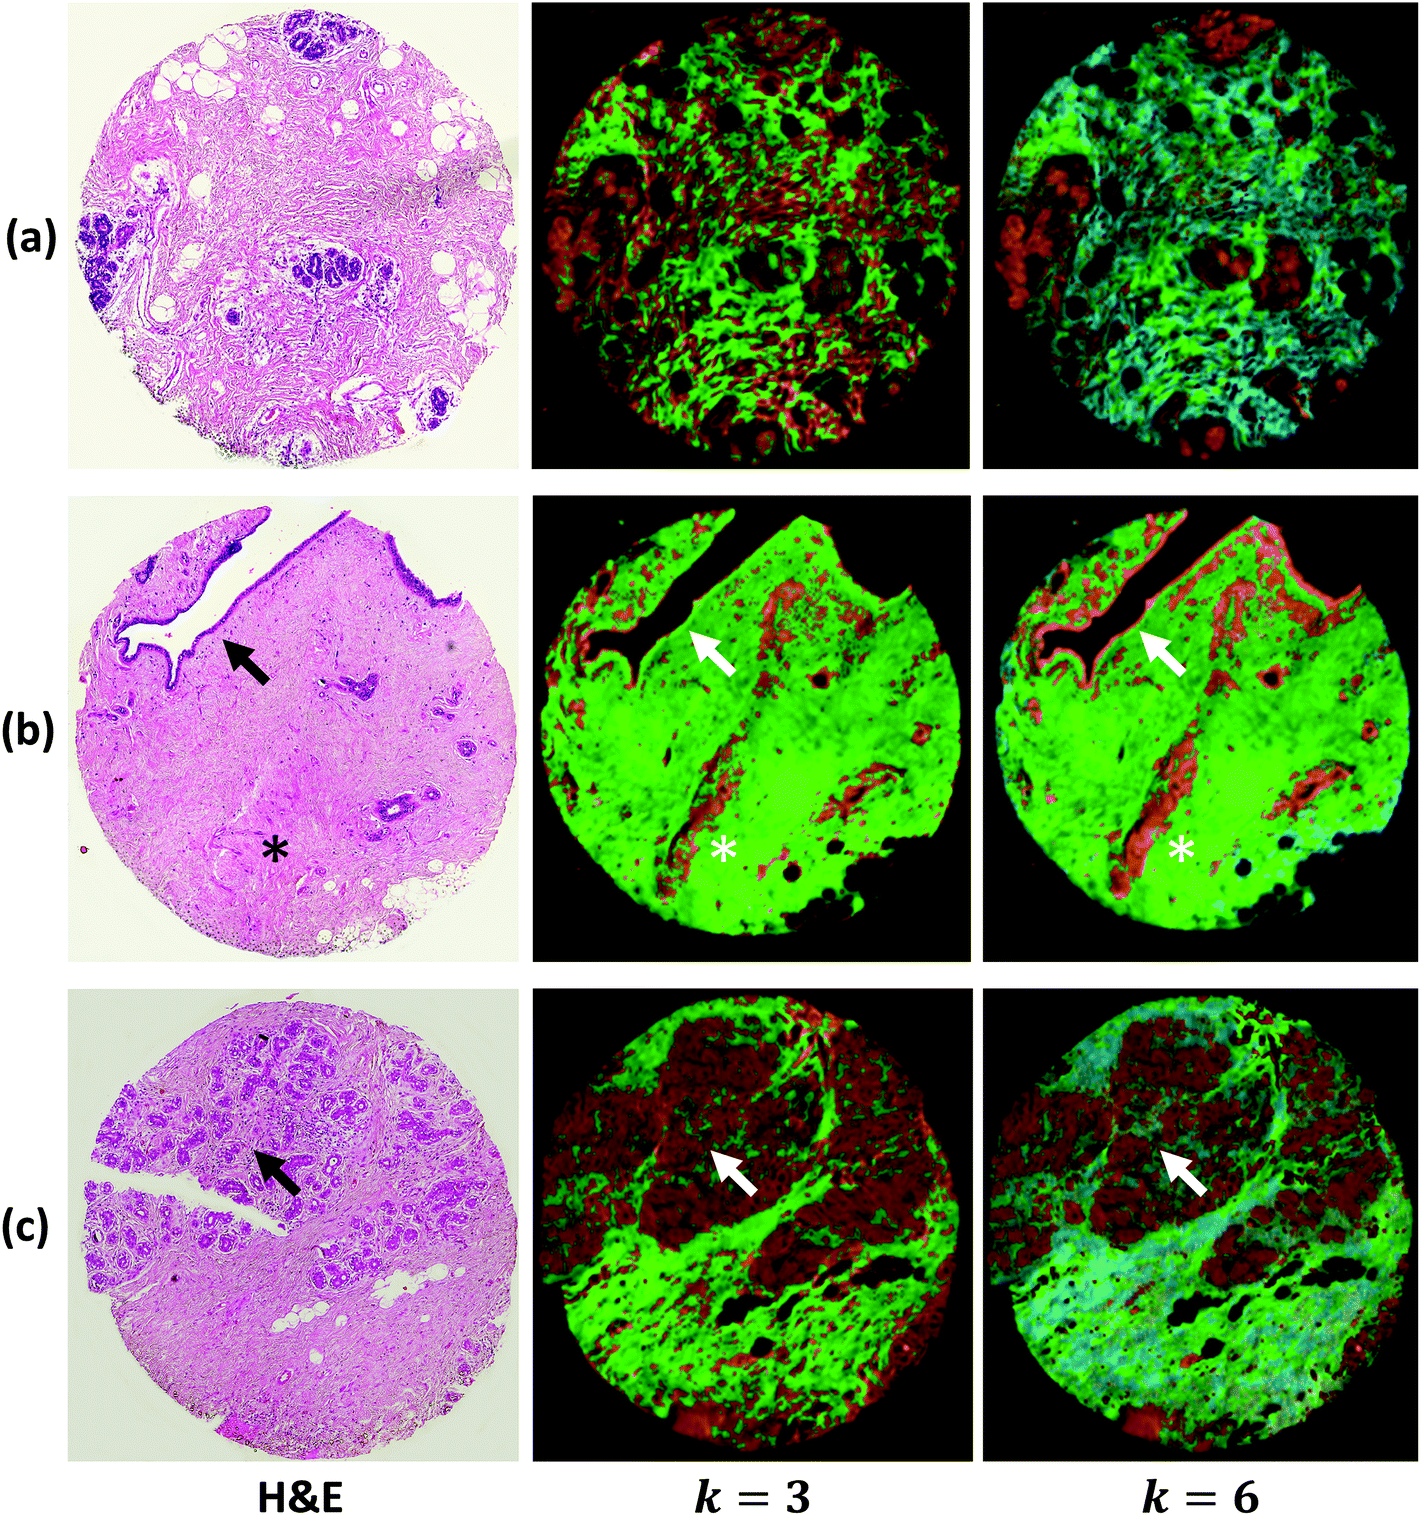 | ||
| Fig. 6 Breast TMA with normal tissue stained with hematoxylin and eosin (left). Corresponding adjacent sections are imaged in IR and classes extracted using k-means clustering for k = 3 (middle) and k = 6 (right). Clusters corresponding to stroma are labeled using various shades of green and clusters corresponding to epithelium are labeled using shades of red. Note that more clusters provide consistent labeling of ductal epithelium (b, arrow) and intralobular stroma (c, arrow). The asterisk indicates ductal epithelium adjacent to the H&E section and starting to appear in the adjacent IR (b, asterisk). | ||
For the majority of data processing algorithms on most systems, data processing throughput is limited by IO. In these cases, we see an ≈40% increase using an adaptive search for an optimal batch size for the specific workstation hardware. In the cases where throughput is limited by data processing, GPU computation significantly increased performance over the corresponding CPU-based algorithm (Fig. 4). Comparisons of CPU-based code are done with ENVI 8.2 and MATLAB 2016a.
Note that GPU-based plugins are available for MATLAB and IDL through third-party extensions. We would expect these to perform similar to SIproc for algorithms that are not IO limited. However, MATLAB is generally optimized for the analysis of data sets that can be stored in the main memory. SIproc is optimized for data streaming and long-term efficiency during data processing. While this comes at the expense of flexibility for smaller data sets, we also provide functions to reduce and manipulate the data to make it easier to import into standard packages such as MATLAB.
We have implemented algorithms to manage data from several commercial vendors, including FFT and mosaic construction for Agilent Cary FTIR imaging systems and mosaic assembly for Daylight Solutions SPERO QCL imaging systems. Our FFT is implemented using the cuFFT GPU accelerated FFT library and performs ≈10× faster than those provided with the instrumentation. Other algorithms implemented in SIproc include: spectral baseline correction, normalization, image classification using random forests,27,30 digital staining,22 MNF noise reduction,14 dimension reduction, masking and thresholding, and standard image manipulation tools such as merging and cropping. SIproc also includes a tool for visualization of hyperspectral images using streaming. The source code, testing data, and a detailed tutorial are available online.31
Conclusions
SIproc provides a fast method for performing pre-processing, dimension reduction, and classification of hyperspectral images by streamlining standard protocols for biomedical data. Our goal is to provide a framework that allows domain experts to manage data sets on the scale of hundreds of gigabytes without having to invest development time in creating tools for basic testing and data mining.For example, standard processing for a biopsy TMA can be completely scripted. This includes the assembly of raw data, FFT, baseline correction, normalization, PCA, and k-means clustering (Fig. 6).
The primary feature of SIproc is that the code is open source and available under the BSD license. The code is free to use in open-source and commercial software and all libraries used in our software follow the same license. We have designed the software to be simple to integrate into other applications. All data are stored as raw binary files with spatial and spectral information encoded using the publicly available ENVI header format.32
Acknowledgements
This work was funded in part by the National Institutes of Health (NIH) #4 R00 LM011390-02, the Cancer Prevention and Research Institute of Texas #RR140013, and Agilent Technologies University Relations #3938.Notes and references
- E. N. Lewis, P. J. Treado, R. C. Reeder, G. M. Story, A. E. Dowrey, C. Marcott and I. W. Levin, Anal. Chem., 1995, 67, 3377–3381 CrossRef CAS PubMed.
- D. C. Fernandez, R. Bhargava, S. M. Hewitt and I. W. Levin, Nat. Biotechnol., 2005, 23, 469–474 CrossRef CAS PubMed.
- M. J. Nasse, M. J. Walsh, E. C. Mattson, R. Reininger, A. Kajdacsy-Balla, V. Macias, R. Bhargava and C. J. Hirschmugl, Nat. Methods, 2011, 8, 413–416 CrossRef CAS PubMed.
- R. K. Reddy, M. J. Walsh, M. V. Schulmerich, P. S. Carney and R. Bhargava, Appl. Spectrosc., 2013, 67, 93–105 CrossRef PubMed.
- L. S. Leslie, T. P. Wrobel, D. Mayerich, S. Bindra, R. Emmadi and R. Bhargava, PLoS One, 2015, 10, e0127238 Search PubMed.
- J. Nallala, G. R. Lloyd, M. Hermes, N. Shepherd and N. Stone, Vib. Spectrosc., 2016 Search PubMed , http://www.sciencedirect.com/science/article/pii/S0924203116302016.
- G. Theophilou, K. M. Lima, P. L. Martin-Hirsch, H. F. Stringfellow and F. L. Martin, Analyst, 2016, 141, 585–594 RSC.
- K. Yeh, S. Kenkel, J.-N. Liu and R. Bhargava, Anal. Chem., 2015, 87, 485–493 CrossRef CAS PubMed.
- M. J. Pilling, A. Henderson, B. Bird, M. D. Brown, N. W. Clarke and P. Gardner, Faraday Discuss., 2016, 187, 135–154 RSC.
- P. Bassan, A. Kohler, H. Martens, J. Lee, H. J. Byrne, P. Dumas, E. Gazi, M. Brown, N. Clarke and P. Gardner, Analyst, 2010, 135, 268–277 RSC.
- P. Bassan, A. Kohler, H. Martens, J. Lee, E. Jackson, N. Lockyer, P. Dumas, M. Brown, N. Clarke and P. Gardner, J. Biophotonics, 2010, 3, 609–620 CrossRef CAS PubMed.
- M. J. Baker, J. Trevisan, P. Bassan, R. Bhargava, H. J. Butler, K. M. Dorling, P. R. Fielden, S. W. Fogarty, N. J. Fullwood, K. A. Heys, C. Hughes, P. Lasch, P. L. Martin-Hirsch, B. Obinaju, G. D. Sockalingum, J. Sul-Suso, R. J. Strong, M. J. Walsh, B. R. Wood, P. Gardner and F. L. Martin, Nat. Protoc., 2014, 9, 1771–1791 CrossRef CAS PubMed.
- A. Savitzky and M. J. E. Golay, Anal. Chem., 1964, 36, 1627–1639 CrossRef CAS.
- A. A. Green, M. Berman, P. Switzer and M. D. Craig, IEEE Trans. Geosci. Remote Sens., 1988, 26, 65–74 CrossRef.
- J. B. Lee, A. S. Woodyatt and M. Berman, IEEE Trans. Geosci. Remote Sens., 1990, 28, 295–304 CrossRef.
- J. M. P. Nascimento and J. M. B. Dias, IEEE Trans. Geosci. Remote Sens., 2005, 43, 898–910 CrossRef.
- P. Lasch, Chemom. Intell. Lab. Syst., 2012, 117, 100–114 CrossRef CAS.
- S. Piqueras, L. Duponchel, M. Offroy, F. Jamme, R. Tauler and A. de Juan, Anal. Chem., 2013, 85, 6303–6311 CrossRef CAS PubMed.
- F. Groerueschkamp, A. Kallenbach-Thieltges, T. Behrens, T. Brning, M. Altmayer, G. Stamatis, D. Theegarten and K. Gerwert, Analyst, 2015, 140, 2114–2120 RSC.
- S. Tiwari and R. Bhargava, Yale J. Biol. Med., 2015, 88, 131–143 Search PubMed.
- X. Mu, M. Kon, A. Ergin, S. Remiszewski, A. Akalin, C. M. Thompson and M. Diem, Analyst, 2015, 140, 2449–2464 RSC.
- D. Mayerich, M. J. Walsh, A. Kadjacsy-Balla, P. S. Ray, S. M. Hewitt and R. Bhargava, Technology, 2015, 03, 27–31 CrossRef PubMed.
- T. Bingmann, M. Axtmann, E. Jbstl, S. Lamm, H. C. Nguyen, A. Noe, S. Schlag, M. Stumpp, T. Sturm and P. Sanders, 2016, arXiv:1608.05634 [cs].
- J. Dongarra, M. Gates, A. Haidar, J. Kurzak, P. Luszczek, S. Tomov and I. Yamazaki, Numerical Computations with GPUs, Springer International Publishing, 2014, pp. 3–28 Search PubMed.
- J. Ham, Y. Chen, M. M. Crawford and J. Ghosh, IEEE Trans. Geosci. Remote Sens., 2005, 43, 492–501 CrossRef.
- B. H. Menze, B. M. Kelm, R. Masuch, U. Himmelreich, P. Bachert, W. Petrich and F. A. Hamprecht, BMC Bioinformatics, 2009, 10, 213 CrossRef PubMed.
- S. Mittal, T. P. Wrobel, L. S. Leslie, A. Kadjacsy-Balla and R. Bhargava, Proc. SPIE, 2016, 9791, 979118 CrossRef.
- MATLAB Incorporates LAPACK, https://www.mathworks.com/company/newsletters/articles/matlab-incorporates-lapack.html Search PubMed.
- M. Galloy, Modern IDL: A Guide to IDL Programming, Michael Galloy, 2011 Search PubMed.
- L. Breiman, Machine Learning, 1999, 45, 5–32 CrossRef.
- SIproc - STIM Laboratory, http://stim.ee.uh.edu/resources/software/siproc/ Search PubMed.
- ENVI Header Files (Using ENVI), Exelis VIS Docs Center, http://www.harrisgeospatial.com/docs/ENVIHeaderFiles.html.
| This journal is © The Royal Society of Chemistry 2017 |