
 Open Access Article
 This Open Access Article is licensed under a
 Creative Commons Attribution 3.0 Unported Licence
Lightweight conductive graphene/thermoplastic polyurethane foams with ultrahigh compressibility for piezoresistive sensing†
Hu
Liu
ab,
Mengyao
Dong
a,
Wenju
Huang
a,
Jiachen
Gao
a,
Kun
Dai
*a,
Jiang
Guo
b,
Guoqiang
Zheng
a,
Chuntai
Liu
*a,
Changyu
Shen
a and
Zhanhu
Guo
 *b
*b
aCollege of Materials Science and Engineering, The Key Laboratory of Material Processing and Mold of Ministry of Education, Zhengzhou University, Zhengzhou, Henan 450001, P. R. China. E-mail: kundai@zzu.edu.cn; ctliu@zzu.edu.cn
bIntegrated Composites Laboratory (ICL), Department of Chemical & Biomolecular Engineering, University of Tennessee, Knoxville, TN 37996, USA. E-mail: zguo10@utk.edu
First published on 17th October 2016
Abstract
Lightweight conductive porous graphene/thermoplastic polyurethane (TPU) foams with ultrahigh compressibility were successfully fabricated by using the thermal induced phase separation (TISP) technique. The density and porosity of the foams were calculated to be about 0.11 g cm−3 and 90% owing to the porous structure. Compared with pure TPU foams, the addition of graphene could effectively increase the thickness of the cell wall and hinder the formation of small holes, leading to a robust porous structure with excellent compression property. Meanwhile, the cell walls with small holes and a dendritic structure were observed due to the flexibility of graphene, endowing the foam with special positive piezoresistive behaviors and peculiar response patterns with a deflection point during the cyclic compression. This could effectively enhance the identifiability of external compression strain when used as piezoresistive sensors. In addition, larger compression sensitivity was achieved at a higher compression rate. Due to high porosity and good elasticity of TPU, the conductive foams demonstrated good compressibility and stable piezoresistive sensing signals at a strain of up to 90%. During the cyclic piezoresistive sensing test under different compression strains, the conductive foam exhibited good recoverability and reproducibility after the stabilization of cyclic loading. All these suggest that the fabricated conductive foam possesses great potential to be used as lightweight, flexible, highly sensitive, and stable piezoresistive sensors.
1 Introduction
Conductive polymer composites (CPCs), achieved through the addition of conductive fillers into the normal insulating polymer matrix, have shown great potential applications in the fields of smart sensors. The sensing mechanism is mainly based on the change in conductive networks, i.e., the variation of electrical resistance arising from the exposure to external stimuli (stress, organic vapor, temperature, etc.).1–17 Piezoresistive sensors, which convert the external applied compression stress or strain into an obvious electrical resistance signal, can be effectively used in many industrial fields.18–20 However, the rigidity and small strain of conventional metal or semiconductor based sensors limit their applications for the fabrication of flexible devices.21 Herein, CPCs with good flexibility have been considered as an ideal substitute and extensively researched. For example, Chen et al. fabricated a finger-sensing conductive graphite nanosheets/silicone rubber composite with remarkable and reversible piezoresistivity.22 Dang et al. reported flexible carbon nanotubes (CNTs)/methylvinyl silicone rubber composites with markedly sensitive linear piezoresistive behavior under low pressure.23Meanwhile, lightweight and high compressibility are of great importance for piezoresistive sensors to satisfy different practical demands. Due to the merits of lightweight, large specific surface area and high porosity, porous polymer foams have been widely used in many fields, including electromagnetic interference (EMI) shielding,24–27 biological scaffolds28–31 and super adsorbents.32–34 As for the CPC based piezoresistive sensors, the introduction of a three-dimensional porous structure must be an effective strategy for achieving promising piezoresistive performance for widespread applications. Recently, several newly developed conductive sponges have also been prepared and used as pressure sensors. The porous structure not only helps to reduce the density of CPCs effectively but also enables the CPCs with excellent compressibility in a large strain region. For example, Si et al. prepared carbonized three-dimensional nanofibrous aerogels with high compressibility and conductivity. During the cyclic compression strain of up to 50%, a 70% decrease of normalized resistance (termed negative piezoresistive behavior) was observed together with good recoverability and reversibility.35 In our previous research, porous CNTs/thermoplastic polyurethane (TPU) nanocomposites with a density of approximately 0.1 g cm−3 have been prepared by the thermal induced phase separation (TIPS) technique. The porous nanocomposites also exhibited negative piezoresistive behavior with good recoverability and reproducibility over a wide strain range of up to 90%.6 Meanwhile, it has also been demonstrated that the conductive network distributed in the polymer matrix could be tuned by changing the loading or the type of conductive fillers, causing different sensing behaviors.11,36 Carbon based conductive materials such as carbon black, CNTs and graphene are the most frequently used fillers to fabricate CPCs. In particular, the single layer two dimensional graphene has been considered as a good candidate. Due to the high conductivity of graphene, it could reduce the percolation threshold of CPCs significantly, avoiding the sacrifice of mechanical properties of CPCs.37,38 On the other hand, the large specific surface area and good flexibility of graphene will also lead to an extraordinary conductive network and dispersion morphology in CPCs. To explore its application, the three-dimensional architectures of graphene or its derivatives (such as graphene aerogel/polydimethylsiloxane (PDMS),39 graphene foam (GF),40 GF/PDMS,41,42etc.) have been investigated for piezoresistive sensors. But, their complex preparation process and high-cost hindered their practical applications. Based on the aforementioned discussions, it is both scientifically meaningful and necessary to fabricate porous graphene based CPC foams, aiming to acquire new types of lightweight piezoresistive sensors with ultrahigh compressibility and interesting sensing behaviors.
In the present work, TPU was chosen as the host polymer matrix owing to its good elasticity and good affinity for carbon fillers.2,16 The porous graphene/TPU foams were fabricated by using the simple TIPS technique, which was verified to be a good manufacturing route to three-dimensional porous CPCs.6,30 The effects of graphene loading levels on the electrical conductivity, mechanical properties, thermal properties and cell morphology of the porous CPCs were systematically studied. Their structures were also characterized. Stepwise compression and cyclic compression under different compression strains were conducted separately to investigate the piezoresistive sensing behaviors of the porous CPC foams.
2 Experimental
2.1 Materials and chemicals
Polyester based thermoplastic polyurethane (TPU, Elastollan 1185A) purchased from BASF Co. Ltd, China was used as a polymer matrix. Graphene was purchased from Chengdu Organic Chemicals Co. Ltd, China. According to the supplier, the characteristics of graphene were: thickness 0.55–3.74 nm, diameter 0.5–3 μm, specific surface area 500–1000 m2 g−1, and purity >90 wt%. Dioxane was purchased from Zhiyuan Reagent Co., Ltd Tianjin, China, and used as-received without further treatment.2.2 Fabrication of porous graphene/TPU foams
Porous graphene/TPU foams were prepared using the TIPS technique. First, graphene (in ratios of 0.5, 1, 1.5, 2, 2.5 and 3 wt% to TPU, corresponding to volume concentrations of 0.024, 0.05, 0.76, 0.1, 0.13 and 0.16 vol%. The conversion method is detailed in the ESI†) was dispersed in dioxane using an ultrasonication instrument (SCIENTZ-II, 285W, Ningbo Scientz Biotechnology Co. Ltd, China) to achieve a homogenous graphene/dioxane mixture. Second, TPU pellets (5 g per 100 mL dioxane) were dissolved in a graphene/dioxane mixture with rapid stirring below 40 °C for 30 min. Subsequently, the obtained mixture was added into glass tubes with a diameter of 20 mm and placed in a −25 °C freezer for 12 h to ensure complete phase separation. The tubes were then transferred to a freeze-drying vessel at −80 °C for 72 h at 8 Pa, forming the porous structure after the sublimation of ice crystals. The pure TPU foam was also fabricated without the addition of graphene.2.3 Characterization
Fourier-transform infrared (FT-IR) spectra were recorded on a Nicolet Nexus 870 instrument using the attenuated total reflectance (ATR) technique. All the spectra were scanned at a resolution of 4.0 cm−1 in the range from 500 to 4000 cm−1.X-ray diffraction (XRD) analysis was carried out on a Rigaku Ultima IV X-ray diffractometer with Cu Kα radiation. The scanning was performed from 5 to 80° with a speed of 0.02° min−1.
Differential scanning calorimetry (DSC) analysis was carried out on a DISCOVERY DSC Q2920 instrument. Approximately 8 mg of sample was encapsulated in an aluminum pan and heated from 30 to 200 °C at a heating rate of 10 °C min−1. Then it was maintained for 5 min to erase the thermal history. After that, the sample was cooled down to −60 °C and reheated to 220 °C at the same rate. All the tests were performed in a nitrogen atmosphere at a flow rate of 20 mL min−1.
The thermal stability was investigated using thermogravimetric analysis (TGA/STDA851e, Mettler Toledo, Switzerland). A sample of about 8 mg was heated from ambient temperature to 700 °C at a constant heating rate of 10 °C min−1 in a nitrogen atmosphere. The nitrogen flow rate was 40 mL min−1.
The Raman spectra were measured using a Renishaw inVia Raman confocal microscope with 532 nm laser excitation at 1 cm−1 resolution in the range from 80 to 4000 cm−1.
Field emission scanning electron microscopy (FE-SEM) (JEOL JSM-7500F instrument) was adopted to observe the morphology of the fabricated foam. The specimens were cryogenically fractured in liquid nitrogen. The fracture surfaces were then coated with a thin layer of platinum for better imaging.
The mechanical properties were characterized via compression tests using a universal testing machine with a 100 N load cell (UTM2203, Shenzhen Suns Technology Stock Co. Ltd, China). Cylindrical samples with a diameter of 15 mm and a height of 10 mm were compressed to a compression strain of 50% at a rate of 5 mm min−1. The results were averaged over at least five different specimens for each sample.
The volume resistance was measured using a precision digital resistor (Model TH2683, Changzhou Tonghui Electronics Co. Ltd, China) under a constant voltage of 10 V. As shown in Fig. 1, cylindrical samples were sandwiched between two aluminum electrodes. Silver paste was used to ensure good contact between the electrode and the sample. The corresponding volume conductivity was calculated by using the formula: σ = L/RS, where σ represents the volume conductivity, R represents the volume resistance, S and L represent the cross-sectional area and the height of the cylinder, respectively. The precision digital resistor and the universal testing machine were coupled with a computer to record the piezoresistive behavior online. In order to ensure the reliability and reproducibility of the piezoresistive behavior, at least five specimens were used for each test in the paper.
 | ||
| Fig. 1 Schematic diagram of sample preparation, resistance test and piezoresistance behavior test. | ||
3 Results and discussion
3.1 Thermogravimetric analysis
Fig. 2 shows the TGA curve and the corresponding differential thermogravimetric (DTG) curve of the TPU foam and its CPC foams with different graphene loadings in a nitrogen atmosphere. By comparison with the TPU foam, the onset degradation temperature of CPC foams increased with increasing graphene content, and an improvement of about 6.6 °C was observed for the CPCs with about 3 wt% graphene loading. In addition, a two-step degradation pattern was observed from the DTG curves of all foams. The first step between 260 and 330 °C was mainly related to the cleavage of urethane bonds of TPU,10 and the decomposition peak weakened slightly with increasing graphene content and almost disappeared for the CPC foam with 2 wt% graphene, but it obviously appeared again for the CPCs containing 3 wt% graphene. As for the second step between 330 and 500 °C related to the decomposition of soft segments of TPU, the temperature of the maximum decomposition rate increased firstly and reduced subsequently with increasing graphene content. The CPC foam with 2 wt% graphene possessed the highest temperature of the maximum decomposition rate at about 387.48 °C, 22 °C higher than that of pure TPU. Such trend was also observed in linear low density polyethylene (LLDPE) based composites incorporated with functionalized graphene.43 | ||
| Fig. 2 (a) TGA and (b) DTG thermograms of the TPU foam and its CPC foams with graphene loadings of 1, 2 and 3 wt%; the inset in (a) shows the onset degradation temperature (the temperature for 5% weight loss). | ||
All these indicate that the addition of graphene is beneficial for the improvement of thermal stability of composites, but higher loading also brings a negative effect. There are two main aspects in this phenomenon. First, the graphene nanosheets with a large surface area act as a so-called ‘tortuous path’ to retard the decomposition of the polymer matrix and the release of volatile products.44,45 Second, when a higher amount of graphene is added in the CPC foam, the high thermal conductivity of graphene enables it to act as the heat source to accelerate the decomposition of TPU. Herein, an appropriate graphene content is therefore important for the properties of the composites.43
3.2 Differential scanning calorimetry analysis
Fig. 3 displays the melt temperature (Tg) and glass transition temperature (Tm) curves of the TPU foam and its CPC foams with different graphene loadings obtained from the DSC thermograms. From Fig. 3(a), the Tm of the TPU foam was found to be about 192 °C, which was referred to the melting point of hard segments crystalline structures of the TPU matrix. No variation of Tm was found for graphene/TPU foams, indicating that the original crystal structure of the host matrix remained unchanged in spite of the incorporation of graphene.46 In addition, the value of melting enthalpy is about 5.097 J g−1, showing a small fraction of hard segments in the TPU used in the research. However, the increase of graphene loading led to wider and shallower endothermic curves and the melting enthalpy of the conductive foam with 3 wt% loading dropped to only 3.383 J g−1, which might be due to the fact that the addition of graphene inhibited the crystallization of the TPU hard segments, leading to the decrease in the crystalline size of TPU molecules.28,47–49 As for the influence of graphene on the Tg of CPC foams, it can be seen that the Tg decreases with increasing graphene content, Fig. 3(b). Compared with the Tg of TPU foams at about −25.76 °C, the Tg values of the CPC foams with 1, 2 and 3 wt% graphene are −26.9, −27.93 and −28.11 °C, respectively. The main reason for this phenomenon is that the entanglement degree of the soft segment molecules of TPU may be reduced in the presence of graphene, causing the higher mobility of soft segments. On the other hand, the destruction of the crystalline structure of hard segments, which act as physical crosslinking points of the TPU molecules, will release the constrained soft segments and improve its mobility, so a reduction of Tg occurred. | ||
| Fig. 3 (a) Tm and (b) Tg curves of the TPU foam and its CPC foams with graphene loadings of 1, 2 and 3 wt%. | ||
3.3 X-ray diffraction analysis
Fig. 4 shows the XRD patterns of graphene, the TPU foam and its CPC foams. A small broad diffraction peak at a 2θ value of 25.4° appears in the pattern of graphene, which is assigned to the (002) planes of a graphitic structure with short-range order in some stacked graphene sheets. The TPU foams display a strong diffraction peak at a 2θ value of 20.5°, which is relevant to the existence of a short range regularly ordered structure of both hard and soft domains along with a disordered structure of the amorphous phase of the TPU matrix.47,50 The XRD patterns of all CPC foams display obviously the peak assigned to the TPU, indicating that the crystal structure of the TPU matrix remains unchanged after the addition of graphene. But the intensity of the peak is attenuated with increasing graphene loading. The reason may be due to the interfacial interaction between the graphene and TPU, which causes the decrease in the crystalline size of TPU molecules.50 This phenomenon is consistent with the DSC results. Besides, the diffraction peak corresponding to graphene disappears completely, which is ascribed to the full exfoliation during the sonication process, leading to the destruction of the short-range ordered graphitic structure of graphene. | ||
| Fig. 4 XRD patterns of graphene, the TPU foam and its CPC foams with graphene loadings of 1, 2 and 3 wt%. | ||
3.4 Fourier transform infrared spectroscopy analysis
The FT-IR spectra of the TPU foam and its CPC foams with different graphene loadings were recorded to investigate the interaction between graphene and TPU. The main characteristic peaks of all samples are shown in Fig. 5(a). The peak at 3324 cm−1 corresponds to the stretching vibrations of the N–H bond; the peaks at 2955 and 2870 cm−1 are attributed to the alkene–CH stretching vibrations; and the peak at 1074 cm−1 is due to the C–O–C stretching vibrations. Besides, two characteristic peaks at 1730 and 1700 cm−1 in the rectangular area are attributed to the free C![[double bond, length as m-dash]](https://www.rsc.org/images/entities/char_e001.gif) O and H-bonded C–O, respectively (Fig. 5(b)).4 With the addition of graphene, the peak intensity at 1730 cm−1 becomes weaker; in addition, the peak at 1700 cm−1 also becomes less obvious and a new weak peak at 1969 cm−1 appears gradually. The interaction between the N–H bond of TPU and the remaining oxygenated groups of graphene accounts for the variation of FT-IR spectra.28
O and H-bonded C–O, respectively (Fig. 5(b)).4 With the addition of graphene, the peak intensity at 1730 cm−1 becomes weaker; in addition, the peak at 1700 cm−1 also becomes less obvious and a new weak peak at 1969 cm−1 appears gradually. The interaction between the N–H bond of TPU and the remaining oxygenated groups of graphene accounts for the variation of FT-IR spectra.28
 | ||
| Fig. 5 (a) FT-IR spectra of the TPU foam and its CPC foams with graphene loadings of 1, 2 and 3 wt%. Details of the rectangular area are depicted in (b). | ||
3.5 Raman spectroscopy analysis
Raman spectroscopy was further performed to analyze the structure of the TPU foam and its CPC foams, Fig. 6. For the TPU foam, the characteristic peak at 2930 cm−1 is attributed to the stretching vibrations of –CH2; the peak at 1730 cm−1 is assigned to the free carbonyl group; the strong peak at 1617 cm−1 corresponds to the aromatic breathing mode symmetric stretch vibration of CC; the peak at 1538 cm−1 is assigned to the CC of urethane amide; and that at 1445 cm−1 is due to the bending vibrations of –CH2.51,52 However, the intensity of these characteristic peaks becomes weaker gradually or even disappears with increasing graphene loading. Besides, two feature peaks of graphene based materials appear, namely the D and G bands located at 1360 and 1584 cm−1, respectively. The D band at 1360 cm−1 is attributed to the presence of sp3 defects within the graphene sheets, and the G band is ascribed to the E2g phonon mode of in-plane sp2 carbon atoms.53,54 Their intensity increases with increasing graphene loading. All these provide additional information about the existence of the interaction between graphene and the TPU matrix.
 | ||
| Fig. 6 Raman spectra of the TPU foam and its CPC foams with graphene loadings of 1, 2 and 3 wt%. | ||
3.6 Morphology of porous graphene/TPU foam
SEM images of the TPU foam and its CPC foams with different graphene loadings indicate the formation of an interconnected cell structure by the TISP technique (Fig. 7). For the TPU foam, Fig. 7a, the cell wall is too thin to acquire a robust porous structure. However, as shown in Fig. 7b and c, the cell wall becomes thicker with the addition of graphene, and a perfect cell structure is also obtained. It may be due to the increased viscosity of the TPU solution with the addition of graphene, leading to a thicker cell wall during the phase separation process. Besides, the good interaction between graphene and TPU is also good for the construction of a robust porous structure, which has been proved via the compression mechanical property (Fig. 8). Taking a closer view of the cell wall, an incomplete cell wall with lots of small holes is observed for the TPU foam. It is known that the sublimation of the ice crystals of solvent by the freeze-drying technique induced the formation of porous structures.30 Thus, the contraction of the TPU molecular chain caused small holes after the sublimation of residual small solvent crystals in the TPU phase. In the reported porous CNT/TPU nanocomposites,6 the addition of CNTs effectively hindered the contraction of TPU molecular chains, and the small holes almost disappeared. However, in this work, the addition of graphene cannot prevent the formation of small holes completely, which may be due to the good flexibility of graphene that enables it move together with the TPU molecular chain during the contraction process. Fig. 7d shows the structure of the cell strut and the dispersion state of graphene on it; graphene with a wrinkled structure is evenly distributed on the cell strut without obvious aggregation, showing good dispersion of graphene in the TPU matrix. In addition, the dendritic structure was also observed in the cell wall, causing the instability of the porous structure upon compression. This would also affect the piezoresistive behavior of the CPC foam. Furthermore, the density and the porosity of all fabricated porous CPC foam were calculated to be about 0.11 g cm−3 and 90%, respectively. As shown in Fig. 7e, the bud could support the cylindrical CPC foam with 3 wt% graphene without being bent, showing the lightweight property acquired with the help of a porous structure. Finally, the compression process shown in Fig. 7f demonstrates that the porous CPC foam possesses good compressibility and recoverability due to its high porosity and good elasticity of TPU, indicating great potential for the applications of large compression strain sensing. | ||
| Fig. 7 The morphologies of (a) the TPU foam and its CPC foams with graphene loadings of (b) 1 and (c) 3 wt%; (d) high-magnification image of (c) showing the structure of cell strut, the inset shows the dispersion state of graphene on the cell strut; (e) the bud supports the CPC foam with 3 wt% graphene without being bent; and (f) digital images of the compression process, showing good compressibility and recoverability. | ||
 | ||
| Fig. 8 (a) Representative compression stress–strain curves and (b) the compression strength and modulus of the TPU foam and its CPC foams with graphene loadings of 1, 2 and 3 wt%. | ||
3.7 Mechanical properties of porous graphene/TPU foam
The effect of graphene on the compression property of the TPU based CPC foam was investigated, Fig. 8. For the compression stress–strain curves of all foams in Fig. 8(a), a linear elastic deformation with a sharp increase of stress occurred at small strains, resulting from the accommodation of the material into pores of the foam. Besides, the CPC foam exhibited a significant enhancement in the compression property with increasing graphene content, Fig. 8(b). The compression strength and modulus of conductive foams with 3 wt% graphene were enhanced by about 110% and 185%, respectively, in comparison to the TPU foam. All these indicate that the incorporation of graphene is good for the improvement of compression property of the CPC foam, arising from the intrinsic high mechanical strength of graphene. In addition, the robust porous structure of CPC foams (Fig. 7) was also beneficial for the endurance of higher compression. Finally, the observed interaction between graphene nanosheets and TPU molecules was also beneficial for the stress transfer during the compression process.6,30,553.8 Piezoresistive behavior of porous graphene/TPU foams
Due to good electrical conductivity of graphene, the insulating TPU could be tuned to be conductive with the addition of graphene, arising from the construction of a graphene conductive network in the TPU matrix. As shown in Fig. 9(a), the conductivity of porous graphene/TPU foams increases by orders of magnitude compared to that of the neat TPU foam. For example, the conductivity was improved from 10−13 to 10−7 S cm−1 by the addition of 0.051 vol% graphene. With a further increase of graphene loading, it increased gradually and reached a stable value of about 10−4 S cm−1, indicating the formation of a stable graphene conductive network. All these exhibited a typical percolation behavior, so the experimental data were fitted by the statistical percolation model by using eqn (1):56| σ = σ0(φ − φc)t | (1) |
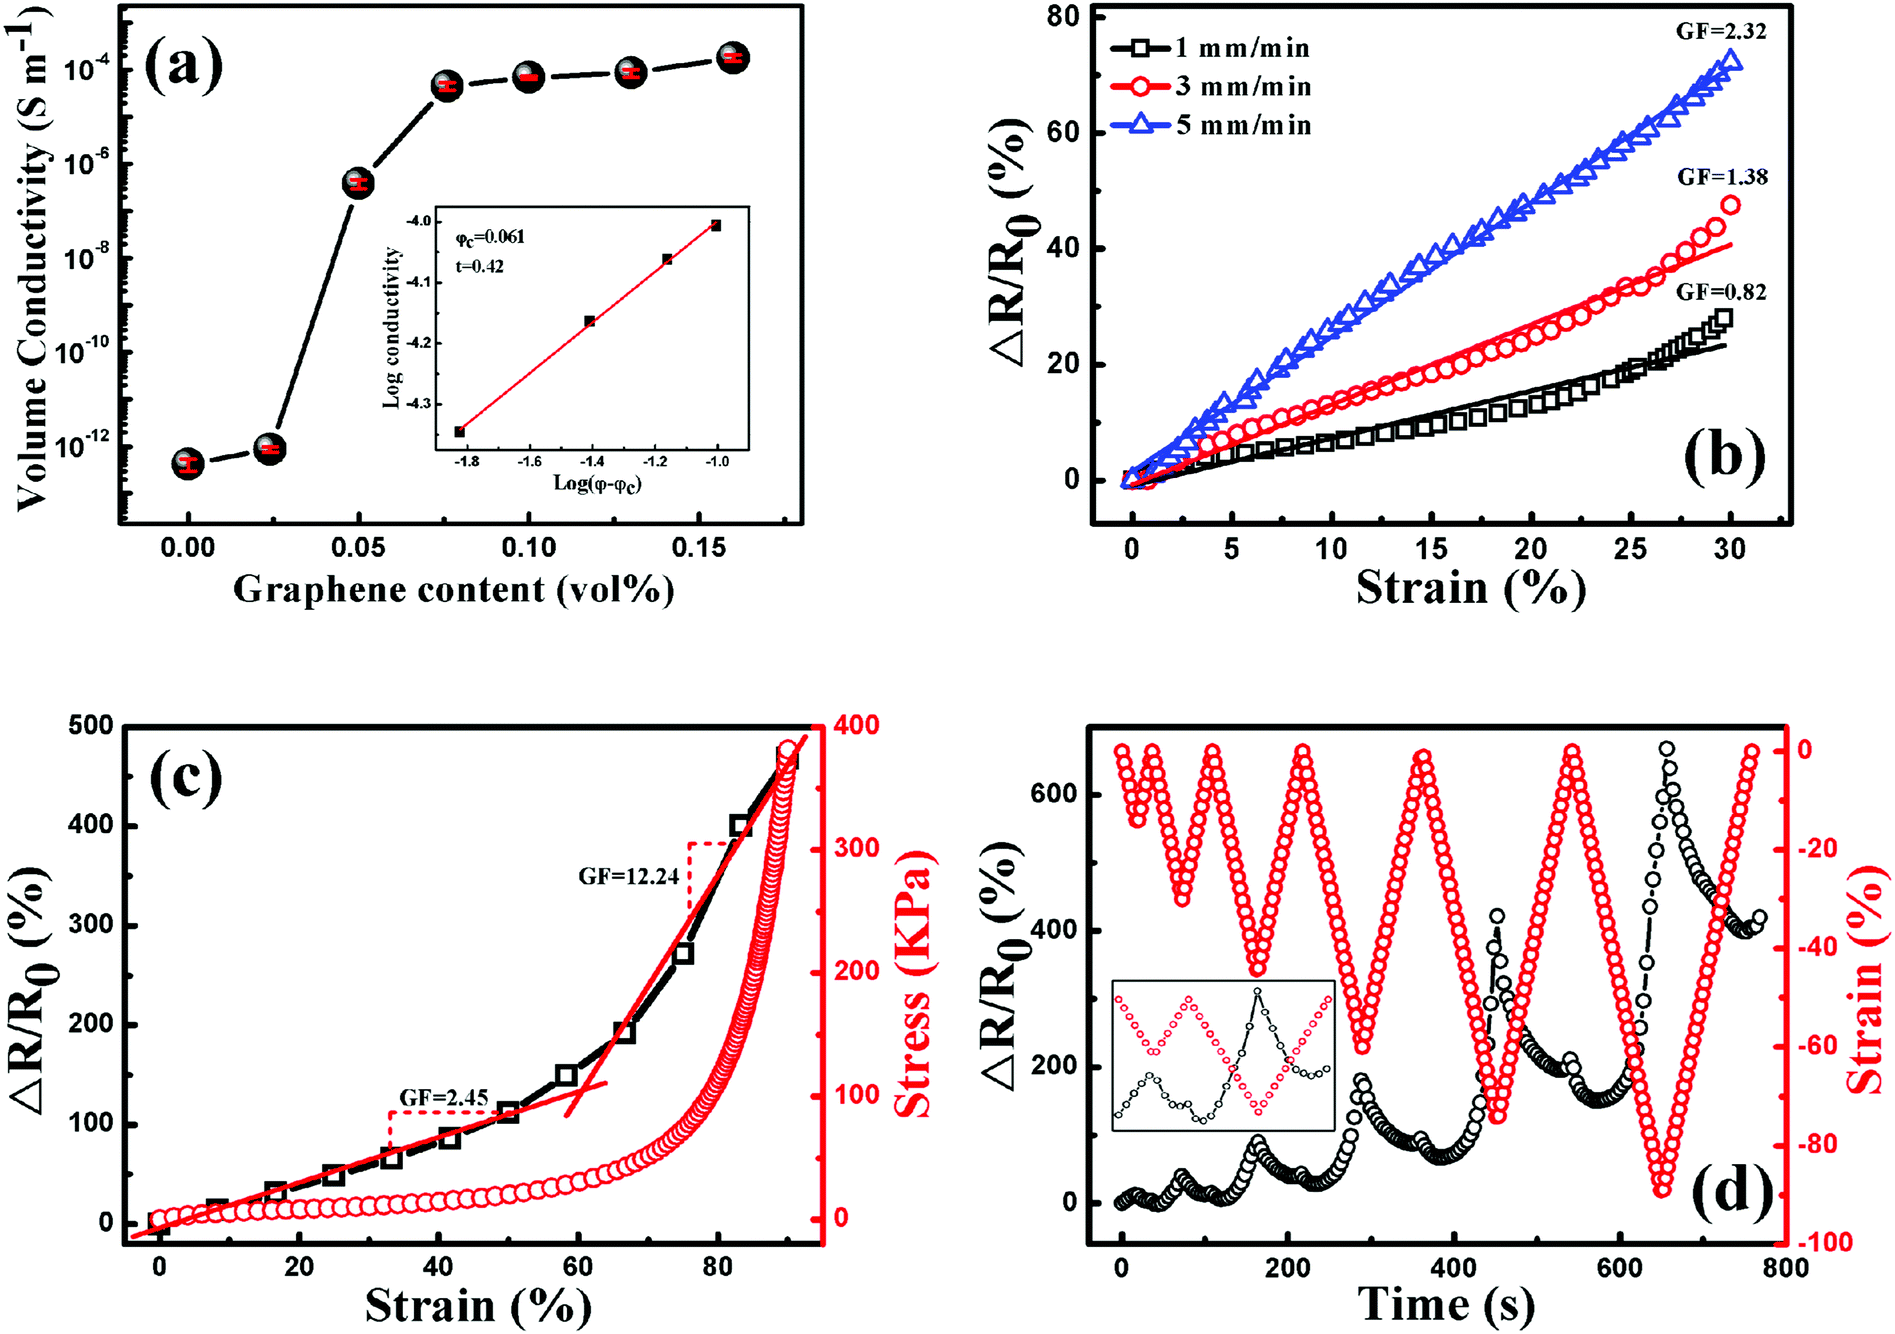 | ||
| Fig. 9 (a) The volume conductivity of a porous graphene/TPU foam as a function of graphene loading (vol%), the inset shows the log conductivity vs. log (φ − φc); piezoresistive behavior of the porous graphene/TPU foam with 0.1 vol% graphene (b) under different compression rates, (c) under the compression rate of 5 mm min−1 to the strain of 90%, and (d) under cyclic compression with a progressively increasing strain amplitude under the compression rate of 5 mm min−1, the inset shows the enlargement part of the first two cycles. | ||
Based on the investigation above, porous graphene/TPU foam with 0.1 vol% graphene is chosen to study the piezoresistive behavior due to its stable conductivity, which is beneficial for the stable signal output upon compression. The responsivity (ΔR/R0 = (R − R0)/R0, where R is the resistance with applied pressure and R0 is the initial resistance of the porous CPC foam) as a function of strain up to the strain of 30% at different compression rates is plotted in Fig. 9(b). In general, the resistance of porous CPC foams would exhibit a negative piezoresistive behavior with increasing strain, arising from the contacts of the cell wall and more conductive networks that are constructed upon compression.58,59 However, the porous graphene/TPU foams exhibit a reverse piezoresistive behavior, an increase of resistance (termed positive piezoresistive behavior) is observed with increasing strain. This peculiar phenomenon can be explained as follows. It is known that the conductive network is mainly distributed in the cell wall, so the integrity of the cell wall is very important for the electrical properties of porous CPC foams. As observed in Fig. 7, the imperfect cell walls with small holes and a dendritic structure can be easily broken down upon compression, causing serious destruction of graphene conductive networks and an increase of resistance. Though some contacts between adjacent cell walls may also appear and make the resistance decrease, its influence on the variation of resistance is very weak compared with the fracture of the cell wall. Here, a gauge factor (GF = (ΔR/R0)/ε, where ΔR/R0 is the responsivity of the porous CPC foam and ε is the compression strain) can be introduced to evaluate the sensitivity of the strain sensor.4,36,60 It can be seen that the GFs at the strain rates of 1, 3 and 5 mm min−1 are about 0.82, 1.28 and 2.32, respectively, indicate that a higher strain rate brings about higher strain sensitivity. This is mainly because that the porous CPC foam suffered a larger compression stress at a higher compression rate (Fig. S1, ESI†), causing more serious destruction of the cell structure and a larger increase of resistance.
The piezoresistive behaviors up to the high compression strain of 90% at the compression rate of 5 mm min−1 are plotted in Fig. 9(c), the porous CPC foam possesses two different GFs throughout the compression process: the GF is about 2.45 when the strain is less than 60%, and a higher one of about 12.24 is obtained at strains larger than 60%. The two different response ranges can be explained from the corresponding stress–strain curve during the compression process. The stress is increased slowly and almost proportionally with the increase of strain of up to about 60%, showing a typical linear-elastic region.39 Besides, a densification region appears at strains larger than 60%, where the stress is increased dramatically and the maximum compressive stress at 90% strain approaches 0.39 MPa. Therefore, the porous CPC foam encounters more serious destruction of the cell structure in the densification region than in the linear-elastic region, causing higher compression sensitivity.
The piezoresistive behavior of the porous CPC foam under cyclic compression with progressively increasing strain amplitude is explored and plotted in Fig. 9(d). Unlike the monotonous response pattern of other CPC foams, an obvious deflection point was observed in both the compression and releasing processes during the cyclic compression.61,62 For the first cycle, the resistance variation in the compression process displays a similar tendency to the result displayed in Fig. 9(c) due to the destruction of the cell structure. After releasing the pressure on the porous CPC foams, it decreases sharply and increases gradually again in the final stage. A higher resistance than its initial value is obtained when the applied strain is released to 0. This may be due to good elasticity of TPU, which causes the broken parts of the cell wall contact each other again. Thus some destroyed conductive networks are recovered to their initial states, causing the quick decrease of resistance. Meanwhile, the contacts between the adjacent cell walls will also become disconnected after the release of pressure in the final compression stage, leading to an increased resistance. However, the foam cannot fully recover to its initial state due to the hysteresis effect and unrecoverable plastic deformation of TPU; some broken conductive paths still exist in the final stage of the releasing process, leaving a higher resistance than its initial value.6 As for the piezoresistive behavior in the following cycles, it can be seen clearly that the response pattern and the responsivity at the end of each cycle (Fig. S2, ESI†) drift to a higher level with increasing cyclic strain amplitude, indicating that the porous graphene/TPU foam has undergone more serious destruction of the cell structure under higher strain conditions. In addition, different piezoresistive behaviors are also observed during the compression process in the following cycles. The resistance cannot follow the strain closely. It decreases firstly and increases quickly with increasing strain. The variation of cell structure after the first compression process accounts for this phenomenon. The cell structure has partially reached a stable state after the process of destruction and reconstruction during the first compression cycle. So the contacts of the broken cell wall are not easy to be disconnected in the initial compression stage of the following cycles. Meanwhile, the adjacent cell walls contact with each other due to good elasticity of TPU, causing the formation of more conductive networks and the decrease of resistance. With further compression, the overlaps between the broken parts of the cell wall formed in the preceding release course will separate from each other again, inducing the breakdown of conductive paths. In this state, the destructive effect on the conductive paths predominates the variation of resistance, thus the resistance increases quickly again. Peculiar piezoresistive behavior of porous graphene/TPU foams could effectively enhance the identifiability of external compression strain when used as piezoresistive sensors.
To investigate the sensitivity, stability and reversibility of the porous graphene/TPU foam, its piezoresistive behaviors were conducted under cyclic compression strain of 30, 60 and 90% at a strain rate of 5 mm min−1, respectively. The corresponding responsivity variations during the cycles of 1–10 and 41–50 are plotted in Fig. 10(a), (b) and (c). For all the testing strain amplitudes, it exhibits similar piezoresistive behavior in the first cycle and other cycles to the style under the stepwise compression. However, the response pattern and the responsivity at the maximum strain during each cycle (Fig. 10(d)) drift to a lower one with increasing cycle number and then tend towards stability. All these indicate that perfect and stable conductive networks are constructed during the cyclic compression process. The stabilizing effect of the cyclic loading on the recoverability and reproducibility of the strain sensor has also been observed in other strain sensors.1,63–65 In addition, the current–voltage (I–V) characteristics of porous graphene/TPU foam in the fiftieth cycle under the strain of 90% were also studied (Fig. 10(e)). The porous graphene/TPU foam displays a typical linear ohmic behavior in the original state, showing good stability of the conductive network. This behavior was also observed but instead with a decreased slope when the foam was compressed to a strain of 90%, indicating the increase of resistance. When the foam was released to the initial state, the I–V curve almost coincided with that of the original state, demonstrating full restoration of the electrical conductivity after unloading and the formation of a stable porous structure, which corresponded to piezoresistive behavior.
 | ||
| Fig. 10 Resistance variation of porous graphene/TPU composites with graphene loading of 0.1 vol% under cyclic compression with a strain of up to (a) 30, (b) 60, and (c) 90% at a strain rate of 5 mm min−1; (c) the relationship between the resistance responsivity at the maximum strain and the cycle number; (d) ΔR/R0 at the maximum strain during each cycle as a function of cycle; and (e) I–V curves of the original, compressed, and released states during the 50th cycle up to 90% strain. | ||
4 Conclusions
Conductive porous graphene/TPU foams with an interconnected cell structure were successfully fabricated by using the thermal induced phase separation (TISP) technique. The density and porosity of all foams were calculated to be about 0.11 g cm−3 and 90% owing to the porous structure. The temperature of the maximum decomposition rate was significantly improved by about 22 °C with the addition of 2 wt% graphene. Besides, it also influenced the microstructural phase of TPU and inhibited the crystallization of the TPU hard segments, causing the reduction of melting enthalpy and the decrease of Tg. Good interfacial interaction between graphene and TPU was verified by the FT-TR and XRD analysis. The compression strength and modulus of the CPC foam with 3 wt% graphene were enhanced by about 110% and 185%, respectively. As for the electrical properties, a percolation threshold of 0.061 vol% was obtained for the CPC foam. In addition, the cell walls with small holes and a dendritic structure were observed due to the flexibility of graphene, endowing the foams with special positive piezoresistive behaviors and peculiar response patterns with a deflection point during the cyclic compression. This could effectively enhance the identifiability of external compression strain when used as piezoresistive sensors. The influence of the compression rate on the compression sensitivity was investigated, and a larger one was obtained at a higher compression rate. Due to high porosity and good elasticity of TPU, the conductive foams demonstrated good compressibility and a stable piezoresistive sensing signal at a strain of up to 90%. During the cyclic piezoresistive sensing test under different compression strains, the conductive foam exhibited good recoverability and reproducibility after the stabilization of cyclic loading. All these suggest that the fabricated conductive foam has great potential to be used as flexible, highly sensitive, and stable piezoresistive sensors.Acknowledgements
The authors gratefully acknowledge the financial support of this work by National Natural Science Foundation Item (Contract Number: 11572290, 11432003, and 51603193), China Postdoctoral Science Foundation (Contract Number: 2015M580637) and Special Science Foundation for Excellent Youth Scholars of Zhengzhou University (Contract Number: 1421320041). Z. Guo appreciates the start-up fund from the University of Tennessee Knoxville. H. Liu acknowledges the support from the China Scholarship Council.References
- J.-H. Kong, N.-S. Jang, S.-H. Kim and J.-M. Kim, Carbon, 2014, 77, 199–207 CrossRef CAS.
- Q. Fan, Z. Qin, S. Gao, Y. Wu, J. Pionteck, E. Mäder and M. Zhu, Carbon, 2012, 50, 4085–4092 CrossRef CAS.
- M. Li, H. Li, W. Zhong, Q. Zhao and D. Wang, ACS Appl. Mater. Interfaces, 2014, 6, 1313–1319 CAS.
- H. Liu, Y. Li, K. Dai, G. Zheng, C. Liu, C. Shen, X. Yan, J. Guo and Z. Guo, J. Mater. Chem. C, 2016, 4, 157–166 RSC.
- D. Du, P. Li and J. Ouyang, J. Mater. Chem. C, 2016, 4, 3224–3230 RSC.
- H. Liu, W. Huang, J. Gao, K. Dai, G. Zheng, C. Liu, C. Shen, X. Yan, J. Guo and Z. Guo, Appl. Phys. Lett., 2016, 1, 011904 Search PubMed.
- Y. Li, H. Liu, K. Dai, G. Zheng, C. Liu, J. Chen and C. Shen, Sens. Actuators, B, 2015, 221, 1279–1289 CrossRef CAS.
- G.-H. Lim, N.-E. Lee and B. Lim, J. Mater. Chem. C, 2016, 4, 5642–5647 RSC.
- X. Wu, C. Lu, Y. Han, Z. Zhou, G. Yuan and X. Zhang, Compos. Sci. Technol., 2016, 124, 44–51 CrossRef CAS.
- H. Liu, W. Huang, X. Yang, K. Dai, G. Zheng, C. Liu, C. Shen, X. Yan, J. Guo and Z. Guo, J. Mater. Chem. C, 2016, 4, 4459–4469 RSC.
- J. Zhao, K. Dai, C. Liu, G. Zheng, B. Wang, C. Liu, J. Chen and C. Shen, Composites, Part A, 2013, 48, 129–136 CrossRef CAS.
- H. Qi, J. Liu, J. Pionteck, P. Pötschkea and E. Mäder, Sens. Actuators, B, 2015, 213, 20–26 CrossRef CAS.
- H. Pang, Y.-Y. Piao, L. Xu, Y. Bao, C.-H. Cui, Q. Fu and Z.-M. Li, RSC Adv., 2013, 3, 19802 RSC.
- Y. Wei, Z. Li, X. Liu, K. Dai, G. Zheng, C. Liu, J. Chen and C. Shen, Colloid Polym. Sci., 2014, 292, 2891–2898 CAS.
- J.-W. Zha, W.-K. Li, R.-J. Liao, J. Bai and Z.-M. Dang, J. Mater. Chem. A, 2013, 1, 843–851 CAS.
- H. Liu, J. Gao, W. Huang, K. Dai, G. Zheng, C. Liu, C. Shen, X. Yan, J. Guo and Z. Guo, Nanoscale, 2016, 8, 12977–12989 RSC.
- Z. Zhou, X. Zhang, X. Wu and C. Lu, Compos. Sci. Technol., 2016, 125, 1–8 CrossRef CAS.
- H. Zhao, Y. Zhang, P. D. Bradford, Q. Zhou, Q. Jia, F. G. Yuan and Y. Zhu, Nanotechnology, 2010, 21, 305502 CrossRef PubMed.
- T. T. Tung, C. Robert, M. Castro, J. F. Feller, T. Y. Kim and K. S. Suh, Carbon, 2016, 108, 450–460 CrossRef CAS.
- T. Yamada, Y. Hayamizu, Y. Yamamoto, Y. Yomogida, A. Izadi-Najafabadi, D. N. Futaba and K. Hata, Nat. Nanotechnol., 2011, 6, 296–301 CrossRef CAS PubMed.
- H. B. Yao, J. Ge, C. F. Wang, X. Wang, W. Hu, Z. J. Zheng, Y. Ni and S. H. Yu, Adv. Mater., 2013, 25, 6692–6698 CrossRef CAS PubMed.
- L. Chen, G. H. Chen and L. Lu, Adv. Funct. Mater., 2007, 17, 898–904 CrossRef CAS.
- Z.-M. Dang, M.-J. Jiang, D. Xie, S.-H. Yao, L.-Q. Zhang and J. Bai, J. Appl. Phys., 2008, 104, 024114 CrossRef.
- J. Ling, W. Zhai, W. Feng, B. Shen, J. Zhang and W. Zheng, ACS Appl. Mater. Interfaces, 2013, 5, 2677–2684 CAS.
- B. Shen, W. Zhai, M. Tao, J. Ling and W. Zheng, ACS Appl. Mater. Interfaces, 2013, 5, 11383–11391 CAS.
- H. B. Zhang, Q. Yan, W. G. Zheng, Z. He and Z. Z. Yu, ACS Appl. Mater. Interfaces, 2011, 3, 918–924 CAS.
- H. Wang, K. Zheng, X. Zhang, X. Ding, Z. Zhang, C. Bao, L. Guo, L. Chen and X. Tian, Compos. Sci. Technol., 2016, 125, 22–29 CrossRef CAS.
- X. Jing, H.-Y. Mi, M. R. Salick, X.-F. Peng and L.-S. Turng, Polym. Compos., 2014, 35, 1408–1417 CrossRef CAS.
- J. R. Martin, M. K. Gupta, J. M. Page, F. Yu, J. M. Davidson, S. A. Guelcher and C. L. Duvall, Biomaterials, 2014, 35, 3766–3776 CrossRef CAS PubMed.
- G. Jell, R. Verdejo, L. Safinia, M. S. P. Shaffer, M. M. Stevens and A. Bismarck, J. Mater. Chem., 2008, 18, 1865–1872 RSC.
- R. Huang, X. Zhu, H. Tu and A. Wan, Mater. Lett., 2014, 136, 126–129 CrossRef CAS.
- K. Kabiri, H. Omidian, M. J. Zohuriaan-Mehr and S. Doroudiani, Polym. Compos., 2011, 2, 277–289 CrossRef.
- X. Gui, J. Wei, K. Wang, A. Cao, H. Zhu, Y. Jia, Q. Shu and D. Wu, Adv. Mater., 2010, 22, 617–621 CrossRef CAS PubMed.
- H. W. Liang, Q. F. Guan, L. F. Chen, Z. Zhu, W. J. Zhang and S. H. Yu, Angew. Chem., Int. Ed. Engl., 2012, 51, 5101–5105 CrossRef CAS PubMed.
- Y. Si, J. Yu, X. Tang, J. Ge and B. Ding, Nat. Commun., 2014, 5, 5802 CrossRef PubMed.
- L. Lin, H. Deng, X. Gao, S. Zhang, E. Bilotti, T. Peijs and Q. Fu, Polym. Int., 2013, 62, 134–140 CrossRef CAS.
- J.-F. Gao, Z.-M. Li, Q.-J. Meng and Q. Yang, Mater. Lett., 2008, 62, 3530–3532 CrossRef CAS.
- S. Stankovich, D. A. Dikin, G. H. Dommett, K. M. Kohlhaas, E. J. Zimney, E. A. Stach, R. D. Piner, S. T. Nguyen and R. S. Ruoff, Nature, 2006, 442, 282–286 CrossRef CAS PubMed.
- H. Hu, Z. Zhao, W. Wan, Y. Gogotsi and J. Qiu, ACS Appl. Mater. Interfaces, 2014, 6, 3242–3249 CAS.
- Y. A. Samad, Y. Li, A. Schiffer, S. M. Alhassan and K. Liao, Small, 2015, 11, 2380–2385 CrossRef PubMed.
- Y. A. Samad, Y. Li, S. M. Alhassan and K. Liao, ACS Appl. Mater. Interfaces, 2015, 7, 9195–9202 CAS.
- Z. Chen, W. Ren, L. Gao, B. Liu, S. Pei and H. M. Cheng, Nat. Mater., 2011, 10, 424–428 CrossRef CAS PubMed.
- T. Kuila, S. Bose, C. E. Hong, M. E. Uddin, P. Khanra, N. H. Kim and J. H. Lee, Carbon, 2011, 49, 1033–1037 CrossRef CAS.
- X. Wang, Y. Hu, L. Song, H. Yang, W. Xing and H. Lu, J. Mater. Chem., 2011, 21, 4222–4227 RSC.
- Y. Cao, J. Feng and P. Wu, Carbon, 2010, 48, 3834–3839 CrossRef CAS.
- Q. He, T. Yuan, J. Zhu, Z. Luo, N. Haldolaarachchige, L. Sun, A. Khasanov, Y. Li, D. P. Young, S. Wei and Z. Guo, Polymer, 2012, 53, 3642–3652 CrossRef CAS.
- X. Li, H. Deng, Z. Li, H. Xiu, X. Qi, Q. Zhang, K. Wang, F. Chen and Q. Fu, Composites, Part A, 2015, 68, 264–275 CrossRef CAS.
- Y. R. Lee, A. V. Raghu, H. M. Jeong and B. K. Kim, Macromol. Chem. Phys., 2009, 210, 1247–1254 CrossRef CAS.
- J. Zhu, S. Wei, Y. Li, L. Sun, N. Haldolaarachchige, D. P. Young, C. Southworth, A. Khasanov, Z. Luo and Z. Guo, Macromolecules, 2011, 44, 4382–4391 CrossRef CAS.
- A. K. Barick and D. K. Tripathy, J. Mater. Sci. Eng. B, 2011, 176, 1435–1447 CrossRef CAS.
- A. S. Khan, Z. Ahmed, M. J. Edirisinghe, F. S. Wong and I. U. Rehman, Acta Biomater., 2008, 4, 1275–1287 CrossRef CAS PubMed.
- O. Menes, M. Cano, A. Benedito, E. Giménez, P. Castell, W. K. Maser and A. M. Benito, Compos. Sci. Technol., 2012, 72, 1595–1601 CrossRef CAS.
- L.-C. Tang, Y.-J. Wan, D. Yan, Y.-B. Pei, L. Zhao, Y.-B. Li, L.-B. Wu, J.-X. Jiang and G.-Q. Lai, Carbon, 2013, 60, 16–27 CrossRef CAS.
- G. Wang, Z. Gao, G. Wan, S. Lin, P. Yang and Y. Qin, Nano Res., 2014, 7, 704–716 CrossRef CAS.
- I. Olivas-Armendáriz, P. García-Casillas, R. Martínez-Sánchez, A. Martínez-Villafañe and C. A. Martínez-Pérez, J. Alloys Compd., 2010, 495, 592–595 CrossRef.
- J.-C. Huang, Adv. Polym. Technol., 2002, 21, 299–313 CrossRef CAS.
- M. Yoonessi and J. R. Gaier, ACS Nano, 2010, 4, 7211–7220 CrossRef CAS PubMed.
- J.-W. Han, B. Kim, J. Li and M. Meyyappan, Appl. Phys. Lett., 2013, 102, 051903 CrossRef.
- R. M. Hodlur and M. K. Rabinal, Compos. Sci. Technol., 2014, 90, 160–165 CrossRef CAS.
- M. Hempel, D. Nezich, J. Kong and M. Hofmann, Nano Lett., 2012, 12, 5714–5718 CrossRef CAS PubMed.
- X. Yuan, Y. Wei, S. Chen, P. Wang and L. Liu, RSC Adv., 2016, 6, 64056–64064 RSC.
- X. Wu, Y. Han, X. Zhang, Z. Zhou and C. Lu, Adv. Funct. Mater., 2016, 26, 6246–6256 CrossRef CAS.
- R. Zhang, H. Deng, R. Valenca, J. Jin, Q. Fu, E. Bilotti and T. Peijs, Compos. Sci. Technol., 2013, 74, 1–5 CrossRef CAS.
- H. Deng, M. Ji, D. Yan, S. Fu, L. Duan, M. Zhang and Q. Fu, J. Mater. Chem. A, 2014, 2, 10048–10058 CAS.
- U.-H. Shin, D.-W. Jeong, S.-M. Park, S.-H. Kim, H. W. Lee and J.-M. Kim, Carbon, 2014, 80, 396–404 CrossRef CAS.
Footnote |
| † Electronic supplementary information (ESI) available. See DOI: 10.1039/c6tc03713e |
| This journal is © The Royal Society of Chemistry 2017 |