DOI:
10.1039/C6SM00749J
(Paper)
Soft Matter, 2017,
13, 283-291
Tunable hygromorphism: structural implications of low molecular weight gels and electrospun nanofibers in bilayer composites†
Received
28th March 2016
, Accepted 24th June 2016
First published on 14th July 2016
Abstract
This investigation highlights the potential for electrospun nanofiber mats and self-assembled nanofiber networks to be interfaced synergistically to induce hygromorphic behaviour. Control poly(vinyl alcohol) (PVA) electrospun active layers and 1,3:2,4-di-p-methylbenyliedene sorbitol (MDBS) self-assembled passive layers encapsulated in an ethylene oxide–epichlorohydrin (EO–EPI) copolymer matrix were fabricated to examine the influence of composition on the properties guiding hygromorphism, such as water transport, layer thickness, and layer modulus. Experimentally determined material constants were utilized in conjunction with mathematical modeling to determine ideal layer properties. It was revealed that the active layer with the highest PVA content exhibited the fastest water transport, and the passive layer with the highest MDBS content displayed the slowest water transport. However, the hygromorphic bilayer fabricated utilizing the lowest PVA content and the highest MDBS fraction was predicted to induce the highest change in curvature due to the lower modulus and thickness of the PVA nanofiber active layer. Decreasing the MDBS content reduced the passive layer modulus while increasing water transport, which theoretically reduced the overall bilayer curvature. The hygromorphic bilayer composites fabricated using these ideal control layers exhibited folding bias and response variations dependent upon active layer composition and imposed folding directions. By utilizing the favorable force balances between the active layer with the lower PVA content and the passive layer with the highest MDBS amount in conjunction with folding bias in a non-preferential direction, it was possible to achieve hygromorphic unfolding and refolding with hydration. Through modelling and individual layer examination, a unique platform built on two independent fiber networks has been designed to achieve biomimetic hygromorphism in synthetic bilayer composites.
1. Introduction
Elegantly simplistic structural variations have resulted in sophisticated responsive properties in natural systems. In the beginning stages of plant life, seed pods play a crucial role in ensuring the survival of flora offspring. One of the most prominent ways of ensuring vitality is through hygromorphism, which is the ability of an object to change shape in response to humidity or moisture.1 Pine cones are perhaps the most widely known example of hygromorphism in nature, but this technique is prevalent in numerous forms of plant life.2 The responsiveness of these systems is the result of variations in the structure of the cellulose in the seed pods.3 By varying the structure, the plant fabricates a bilayer architecture in which the layers vary in modulus, water transport, and thickness. Modelling has been used to elucidate the material properties guiding hygromorphic response, and has led to the construction of novel biomimetic synthetic materials.4–6 In the development of work by Reyssat et al., a pine cone was used as the inspiration for a hygromorphic bilayer film.4 By adapting prior theory describing bimetallic thermostats to instead utilize humidity as a driving force, they were able to model change in curvature in relation to humidity, expansion coefficients, layer thicknesses and layer moduli. In particular, the bilayer system was described as having an “active” and a “passive” layer. The properties of each layer therefore guided the overall curvature of the final bilayer system. Mathematically, changes in curvature only occurred if the active and passive layers differed from each other in modulus, thickness, and their degrees of expansion. The authors used these design parameters to develop a bilayer system that utilized a cellulose-based paper active layer that swelled and softened in a humid environment and shrunk and stiffened when dried; this active layer was glued to a flat, polymer passive layer whose properties remained constant despite humidity.4 Their design resulted in a reversibly responsive bilayer that could be shaped to mimic the opening and closing of a flower upon exposure of the ends to water. Similarly, inspired by three seed pods, Bar-On et al. developed synthetic versions that nearly perfectly replicated the response of their plant muses via the utilization of hierarchical structural variations.5 The same material properties (thickness, modulus, water response) were used as guiding principles along with shape variations observed in the original seed pods. By using polymeric materials, such as a poly(vinyl alcohol) gel and poly(acrylonitrile) fibers to replace cellulose, the ability to mimic complex hygromorphic responses employing only changes in structure rather than complex methods and materials was demonstrated.5 In another case, material systems containing multiple polymer layers were utilized to investigate the effect of layer number on the hygromorphic response.6 Specifically, poly(allylamine hydrochloride) and poly(acrylic acid) active layers were deposited via layer by layer assembly onto a Teflon passive layer. Over hundreds of high to low relative humidity cycles, the bilayer coils demonstrated constant curvature radii.6 The thickness resulting from the number of layers could be used to control folding geometry as well as locomotion. Undoubtedly, polymeric films have provided a flexible platform in the imitation of the hygromorphic response.4–9 However, one of the key challenges in previous investigations has been the interfacial connection between the film layers forming the composite system. This manufacturing constraint both restricts material choices and generally requires complex fabrication strategies.
Electrospun nanofiber mats offer a unique pathway to incorporate responsiveness into composite materials.10 For example, poly(vinyl alcohol) (PVA) electrospun nanofibers annealed with poly(acrylic acid) (PAA) were fabricated to tailor water stability of the composite material in work by Zeng et al.11 Swelling and overall mechanics of the composite could be altered by changing the ratio of PVA to PAA, annealing temperature, and incorporating an additive. Poly[(R)-3-hydroxybutyrate]-based (PHB) polyurethane block copolymers have also been utilized to improve mechanical properties in electrospun composite materials designed to act as scaffolds with enhanced mineralization.11 Varying the poly(ethylene glycol) soft segment content allowed for modulation of the degree of swelling, while changing the PHB content enhanced the wet and dry mechanical properties.11 We have also developed water-responsive composites utilizing poly(vinyl alcohol) (PVA) electrospun fillers in matrices with varying degrees of water uptake via a robust and facile approach.12,13 In the dry state, the PVA fibers reinforced the composite, increasing the storage modulus by an order of magnitude. However, upon hydration, the PVA electrospun mat absorbs water, leading to a dramatic reduction in storage modulus influenced by the swelling behavior of the matrix. The reversibility of this modulus response could be easily tuned by matrix selection, interfacial interactions, and filler crystallinity. However, in these examples, the composites were not strictly bilayers given that the electrospun mat was covered on both sides with the same matrix material, which does not provide the property differences necessary to guide a hygromorphic response. However, alternative methods of utilizing nanoscale fillers can potentially be utilized to transform properties of a matrix material for the purpose of adapting a bilayer configuration.
An exciting way to tailor matrix properties, such as modulus and water transport, is to incorporate nanoscale fillers, known as low molecular weight gels (LMWGs). LMWGs are small molecules that self-assemble to form nanoscale fiber networks, usually resulting in the gelation of a solvent.14 A class of LMWGs known as super-gelators can gel a wide variety of solvents at low concentrations, therefore expanding their use by facilitating the incorporation of other solvated molecules into their gel networks.15 In a recent review, Cornwell et al. highlighted that the incorporation of macromolecules in particular as the next big step for expanding the technological application of LMWGs.16 Previously, we synthesized a diacetylene-based gelator that formed a fibrillar network upon incorporation in an elastomeric matrix.17 The resulting composite exhibited a significant (∼2×) modulus enhancement compared to the neat matrix. This LMWG/polymer composite concept has been explored by many others by solvating the matrix to influence mechanical behavior.13–25 However, in the interest of both cost and ease of fabrication, a LMWG that can both gelate a wide variety of solvents and is commercially available would be desirable. In this work, PVA electrospun nanofiber mats and MDBS self-assembled nanofiber networks were used to develop hygromorphic composites. The PVA electrospun mat serves as the water responsive “active” layer, while the MDBS serves as the matrix reinforcing “passive” layer in order to induce preferential curvature. An EO–EPI copolymer was chosen due to its elastomeric nature and its ability to transport water.26 Using this facile design, a new class of hygromorphic materials was investigated with a focus on the role of electrospun mat thickness and LMWG concentration on key properties, such as water transport, preferential folding, and responsive curvature.
2. Experimental
Materials
All chemicals except for EO–EPI (67% epichlorohydrin) and MDBS were purchased from Sigma Aldrich. EO–EPI was obtained from Scientific Polymer Products, and MDBS was purchased from AK Scientific.
PVA electrospun mat
Electrospinning was performed on a homemade setup described in a previous work utilizing a known procedure.27 Briefly, an aqueous solution of PVA (99% hydrolyzed) was prepared by stirring a specified amount of PVA in water (10 wt%) at 90 °C until fully dissolved. Upon cooling of the PVA solution, 1–2 drops of the surfactant Triton-X100 was added to reduce the surface tension and stirred for 10–15 min. The PVA solution was then loaded into a syringe and subjected to the following electrospinning conditions: flow rate of 1.0 mL h−1, 17 kV, and 20 cm tip to rotating collector distance. After 3 hours, the mat was removed from the collector and submerged into methanol for 8 hours to enhance crystallinity and modulus (Fig. S1, ESI†).27 The PVA mat was dried under vacuum for 1 hour and stored in a desiccator until use.
PVA composite active layer controls
5 mL of EO–EPI solution (50 mg mL−1 EO–EPI in anisole) was poured into a Teflon mould; a PVA mat was placed on top of this solution, and 3 mL of an EO–EPI coat layer was poured over the mat. The composite was left to dry under ambient conditions for 2 days. Once dry, the composite was removed from the mould and compression moulded at 70 °C with 10![[thin space (1/6-em)]](https://www.rsc.org/images/entities/char_2009.gif) 000 pounds of pressure for 2 min to enhance film uniformity. To remove the composite from the Teflon substrate, the composites were cooled with liquid nitrogen and peeled off the substrate, yielding uniform composites.
000 pounds of pressure for 2 min to enhance film uniformity. To remove the composite from the Teflon substrate, the composites were cooled with liquid nitrogen and peeled off the substrate, yielding uniform composites.
MDBS LMWG composite passive layer controls
The desired amount of gelator filler was added to an empty vial. Then, 5 mL of a polymer solution (50 mg mL−1 EO–EPI in anisole) was added to the vial. The mixture was heated and stirred until the gelator was fully dissolved before pouring into a Teflon mould. Upon cooling, loss of solvent flow was observed, and the composite was allowed to dry overnight. Once dry, the composite was removed from the mould and compression moulded at 70 °C with 10000 pounds of pressure for 2 min to enhance film uniformity. To remove the composite from the Teflon substrate, the composites were cooled with liquid nitrogen and peeled off the substrate, yielding uniform composites.
PVA–MDBS hygromorphic bilayer composite
The fabrication process for the PVA–MDBS composites is shown schematically in Fig. 1. First, the MDBS gelator mixture was poured into the Teflon mould and allowed to sit for 5 minutes until solvent flow ceased. A pre-weighed electrospun mat was then placed on top of the MDBS layer, and 3 mL of polymer solution (50 mg mL−1 EO–EPI in anisole) was poured over the mat. The composites were left to dry under ambient conditions for two days, and further vacuum dried at room temperature to remove any residual solvent. Once dry, the film was removed from the mould and compression moulded at 70 °C with 10000 pounds of pressure for 2 min to enhance film uniformity. To remove the film from the Teflon substrate, the films were cooled with liquid nitrogen and peeled off the substrate, yielding uniform films.
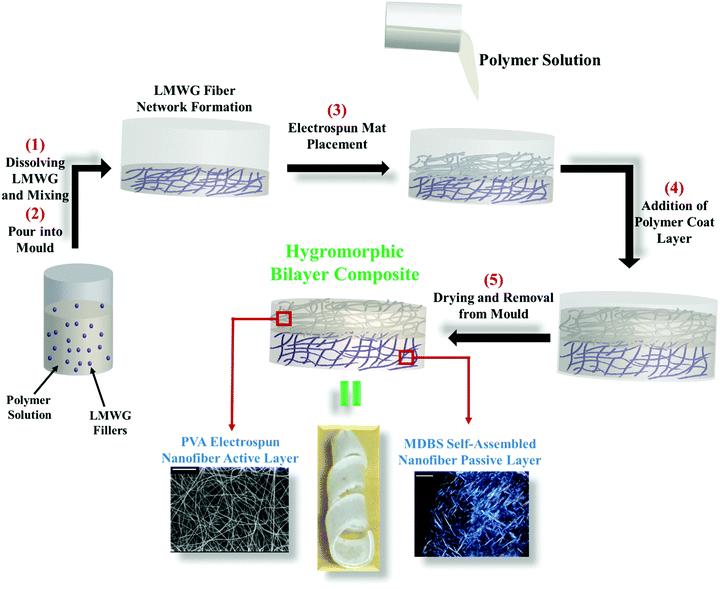 |
| | Fig. 1 Hygromorphic bilayer composite fabrication (scale bars = 20 μm). | |
Hygromorphic bilayer coil fabrication
Thin strips (20 mm × 2 mm) were cut from the bilayer composites. A control system of EO–EPI and PVA mats without the gelator were used for comparison. The strips were submerged in distilled water for one hour and their natural curvature was observed, these bilayer strips were then wrapped around pipette tips and dried under ambient conditions overnight to lock in a coil configuration (Fig. 1). For the bilayer composites, two strips were used for each system to investigate curling direction bias. One composite strip was wrapped around a pipette with the PVA active layer on the inside of the coil (towards mat coil), while the other was wrapped around a pipette with the MDBS passive layer on the inside of the coil (away from mat coil). The final coils were dropped into a vial containing distilled water and the response was recorded via video (ESI,† Videos 1–6).
Characterization
Dynamic mechanical analysis (DMA) was performed on a TA Instruments DMA Q800 operating in controlled force mode. Rectangular films (∼2 mm width and 20 mm length) were cut from a bulk film. To obtain the wet elastic moduli, films were swollen in water for a minimum of 12 h before measurements. The tests (n = 5) were carried out at a single frequency of 1 Hz and a force ramp of 0.01 N min−1 to obtain the stress (MPa) as a function of strain percentage. DMA was used instead of Instron tensile testing to more accurately control the applied force and minimize error by reducing testing time for water swollen samples. Scanning electron microscopy (SEM) was performed on a JEOL JSM-6510LV microscope at 15 kV. The SEM images were used to obtain fiber sizes of the PVA electrospun nanofibers and layer thicknesses of the bilayer composites. UV-Vis absorbance was measured using a Perkin-Elmer Lambda 1050 spectrometer; these measurements were used to determine dye concentration in sample aliquots.
Swelling experiments
Strips (20 mm × 2 mm) were cut from each of the control layers and bilayer composites. Their weights and dimensions were measured and recorded. The strips were then submerged in water for 24 h. The swollen weights and dimensions were measured, and used to determine their swelling ratios and expansion coefficients.
Dye elution to determine diffusion coefficients
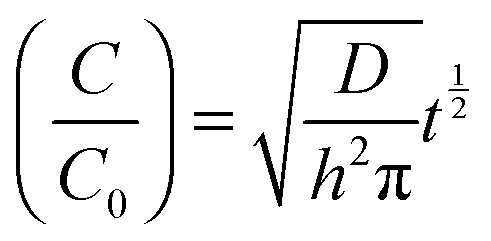
Hydrophilic sunset yellow dye (SSY) (10 wt%) was incorporated into composite control (PVA/EO–EPI and MDBS/EO–EPI) layers via inclusion in the polymer solution. The composite layers were then fabricated as outlined. Strips (20 mm × 2 mm) were cut from each control layer and weighed. Each strip was then placed in a vial containing 10 mL of distilled water. Aliquots were taken at set time points and placed in vials until the dye had eluted from the composite strips. Based on a calibration curve, the concentration of dye in each aliquot was determined using UV/Vis spectroscopy. Eqn (1) describes change in dye concentration with time:| |  | (1) |
where C is the concentration of dye at time t, C0 is the total concentration of dye in the original sample, D is the diffusion coefficient, h is the sample thickness, and t is time in minutes. C/C0vs. t1/2 was plotted to determine the diffusion coefficient from the slope. The values for C and C0 as a function of time were obtained using the concentrations determined UV/Vis spectroscopy.
Modelling
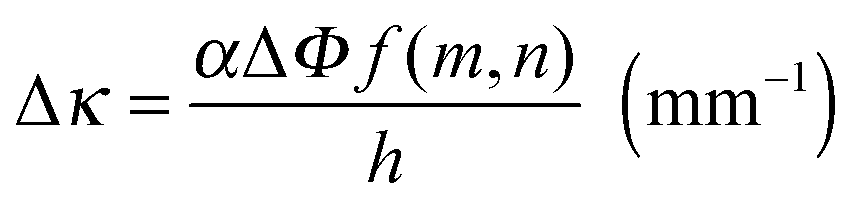
The wetting front progression and the change in curvature as a function of humidity were determined using previously developed models for hygromorphic systems.4 Briefly, the change in curvature is described by eqn (2):| | 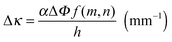 | (2) |
where Δκ is the change in curvature, α is the differential expansion of the active (a) and passive (p) layers (α = αa − αp), ΔΦ is the change in percent humidity, and h is the total layer thickness of the active and passive layers (h = ha + hp). The function f(m,n) relates the layer thickness and modulus viaeqn (3):| | 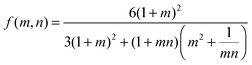 | (3) |
where m is the ratio of the layer thicknesses (m = hp/ha) and n is the ratio of their elastic moduli (n = Ep/Ea). To determine the material constants for the model, the independently fabricated control layers were utilized. Swelling experiments and DMA were used to determine the expansion coefficients and the elastic moduli of each layer, respectively.
The wetting front progression is described by eqn (4):
| | 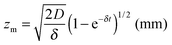 | (4) |
where
zm is the wetting front,
D is the diffusion coefficient,
δ is the flux (
J) divided by the thickness (
hi), and
t is time. The diffusion coefficient was determined experimentally using dye elution studies. The flux was determined using Fick's first law:
J = −
D(d
c/d
x), where
D is the experimentally determined diffusion coefficient, d
c is the change is concentration and d
x is the thickness.
3. Results and discussion
Design elements
A sorbitol derivative, 1,3:2,4-di-p-methylbenyliedene sorbitol (MDBS), is known to gel in numerous solvents at low concentrations, is available from commercial sources, and is also capable of forming self-assembled fiber networks in high temperature polymer melts.28–30 MDBS also forms a fiber network that is not influenced by water.31 These characteristics make MDBS a promising candidate to tailor polymer matrix behaviour for the purpose of fabricating a hygromorphic bilayer composite. For this work, MDBS was used as the nanoscale filler in the passive layer. Its role is two-fold: (1) to enhance the modulus and (2) to decrease swelling and water transport. Varying the gel weight percent in the passive layer allowed for investigation of passive layer mechanics and transport behaviour on bilayer responsiveness. Above 1 wt% MDBS filler, the gel layer was opaque due to crystallization of MDBS. Therefore, MDBS was incorporated at 1 (passive layer 1, P1), 0.5 (passive layer 2, P2), and 0.25 (passive layer 3, P3) weight percent in the passive component of the hygromorphic bilayer (Table 1).
Table 1 Properties of controls
| Sample |
PVA mat thickness (μm) |
MDBS content (wt/wt%) |
Layer thickness (mm) |
| Neat EO–EPI |
0 |
0 |
0.14 |
| P1 control layer |
0 |
1 |
0.09 |
| P2 control layer |
0 |
0.5 |
0.10 |
| P3 control layer |
0 |
0.25 |
0.10 |
| A1 control layer |
500 |
0 |
0.15 |
| A2 control layer |
1000 |
0 |
0.20 |
For the active layer, PVA was used to fabricate the electrospun nanofibers due to its demonstrated water-responsiveness within the EO–EPI matrix. In contrast to a bulk PVA film, electrospun PVA fibers offer a platform for tailored transport and promote interfacial adhesion to minimize delamination (Fig. S2, ESI†). To probe the effects of modulus and response time on bilayer responsiveness, the weight fraction of PVA mat in the active layer was varied. Two active layer systems (thin mat (approx. 500 μm): active layer 1, A1; thick mat (approx. 1000 μm): active layer 2, A2) were fabricated for this purpose (Table 1). This variation was achieved by electrospinning an additional 0.5 mL of PVA solution onto the collector, resulting in a thicker electrospun mat and a higher overall PVA content in the final bilayer composite. It is expected that increasing the amount of PVA nanofibers will lead to faster water transport and a higher degree of swelling, while also increasing the modulus of the active layer.
To interface the active and passive layers, EO–EPI was used as an elastomeric matrix. For the passive layer, EO–EPI was solvated in anisole and gelled using MDBS. Upon formation of the self-assembled MDBS network, the PVA mat was placed on the gel layer. This PVA mat and MDBS/EO–EPI construct was then coated with a solution of EO–EPI in anisole, forming a uniform bilayer composite.
Understanding water front progression in active and passive layer controls
Composition-dependent water diffusion.
Using dye elution studies, the diffusion of water as a function of MDBS and PVA content was investigated. The dye release profiles (Fig. S3, ESI†) were utilized to calculate diffusion coefficients (Fig. 2). Water diffusion within the bilayers is directly related to response rate; with a larger diffusion coefficient, the rate at which water is absorbed by the PVA nanofibers increases, leading to quicker changes in curvature. As expected, water transport occurred fastest in the A2 layer, and slowest in the P1 layer. The enhanced transport in the A2 system is due both to the higher concentration of PVA and the increased mat thickness. Given that the same concentration of EO–EPI solution was used to fabricate both control systems, fewer fibers in the A2 control are separated by EO–EPI than in the A1 control, which facilitates transport both through a single electrospun PVA fiber and from PVA to PVA fiber. In contrast, increasing the MDBS concentration produced the opposite effect, leading to a decrease in water diffusion. At higher MDBS contents, the fibrillar network restricted the swelling of the EO–EPI matrix and increased the hydrophobicity of the passive layer. Interestingly, changing the MDBS composition did not alter the layer thickness, which is most likely due to the rapid spatial self-assembly of the gel that occurs independently of concentration. As shown in Fig. 2, water diffusion within the passive MDBS layer approached that of the neat EO–EPI when the MDBS weight percentage was reduced.
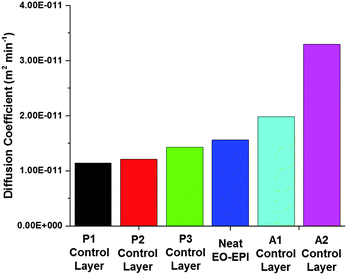 |
| | Fig. 2 Composition dependent diffusion coefficients in control layers. | |
Theoretical wetting front progression.
Using the wetting front progression model (eqn (4)) and the experimentally determined diffusion coefficients, we modelled the wetting front progression as a function of time. The wetting front progression is influenced by both the diffusion coefficient and the flux of water into each layer. As shown in Fig. 3, for the control composite layers (A1, A2, P1, P2, P3), the rate of water transport (e.g. slope) was highest in the A2 control followed by its lower weight percent counterpart A1. This observation suggests that the response of the active layer was modulated by the electrospun PVA fibers rather than the matrix. Previous studies of PVA/EO–EPI electrospun composites have shown that the fraction of PVA nanofibers influences mechanics and wettability within a polymer matrix.12 As expected, the passive layer controls exhibited the opposite trend as the weight fraction of MDBS was increased. Water transport in the control layer with the lowest MDBS amount (P3) was similar to that of the neat EO–EPI matrix. As the MDBS content was increased (P1, P2), water transport was slower due to a denser self-assembled fiber network in the passive layer (Fig. S2, ESI†). The increased fiber content amplified both hydrophobicity and swelling restrictions on the EO–EPI matrix, suggesting the ability to retain the reinforcement provided by the MDBS fiber architecture despite the presence of water. To explore the impact of water uptake on reinforcement, the wet and dry mechanical properties were investigated using DMA.
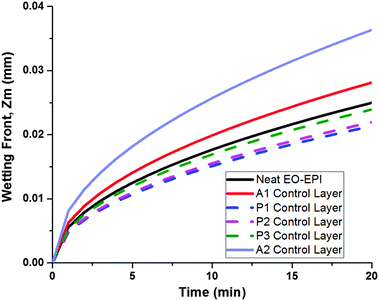 |
| | Fig. 3 Theoretical progression of wetting front for composite layers determined using experimentally-determined diffusion coefficients, fluxes, and thicknesses. | |
The role of active and passive layer modulus in responsive curvature
Composition-dependent wet and dry mechanical response.
Dynamic mechanical analysis was utilized to generate stress–strain curves to determine the wet and dry elastic moduli of the individual PVA/EO–EPI and MDBS/EO–EPI layers. Fig. 4 compares the Young's modulus in the dry and hydrated states as a function of the composition of electrospun PVA fiber or MDBS LMWG. In both the active and passive layers, we observed an increase in modulus with increasing filler content. This result is characteristic of composites that utilize nanoscale fillers as reinforcement agents.13,32 It was noted that the active PVA-containing layer moduli were equal to or higher than the passive layer with MDBS, suggesting that, in the dry state, PVA electrospun nanofiber mats provide equivalent/greater mechanical reinforcement compared to the MDBS self-assembled fiber network. Interestingly, the neat EO–EPI and all MDBS compositions (P1, P2, P3) exhibited a similar modulus in both the wet and dry state. Though the EO–EPI matrix uptakes water, it does not induce dramatic softening (∼0.2 MPa). With a modulus reduction similar to that observed in neat EO–EPI, it is proposed that MDBS gel networks are relatively unaffected by water, preserving the matrix reinforcement. Additionally, retention of the gel network was supported by small-angle X-ray scattering of both wet and dry passive layers (Fig. S5, ESI†). However, a dramatic (∼3.7 MPa) drop in modulus was observed for the PVA/EO–EPI active layers. With these findings, the differential modulus necessary for hygromorphic response was confirmed due to the softening of the PVA layers with water uptake. It is anticipated that the extent of the hygromorphic response will be influenced by this layer-dependent change in mechanics, which was probed by relating the change in curvature to humidity levels.
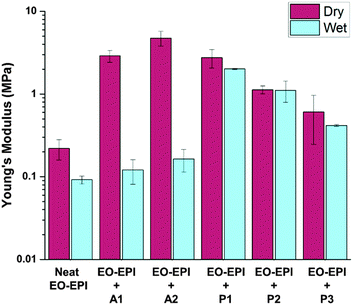 |
| | Fig. 4 Wet and dry moduli of control layers. | |
Theoretical change in curvature for hygromorphic composite bilayers.
The wet elastic moduli of the individual control layers provided the experimental input to model the expected change in curvature (eqn (2)) for the final bilayer composite. Fig. 5 expands understanding of both the rate and extent of hygromorphic response in composites composed of the control systems: A1/P1, A2/P1, A1/P2, A1/P3. It is predicted that the bilayer composite A2/P1 should exhibit a faster response, but a smaller change in curvature. Recalling the curvature relationship, this modest curvature results from the decrease of f(m,n) (eqn (3)) with an increase in modulus and/or thickness of the active layer, which is proportional to the change in curvature. Thus, for the active layer with the highest incorporation of PVA (A2/P1), the hygromorphic response should be faster, but the total curvature was predicted to be smaller. With respect to the MDBS concentration in the passive layer, Fig. 5 highlights that the time scale of response and reduction in curvature resulted from lower MDBS amounts due to a decrease in modulus, resulting in a smaller f(m,n) value. Therefore, bilayer composite A1/P3 having the lowest MDBS content and modulus approaches the response of the A2/P1 bilayer. The A1/P2 bilayer exhibited less pronounced changes in curvature than the A1/P1 bilayer, but the high modulus led to a curvature response that exceeded that of the A1/P3 bilayer. These synergistic bilayer phenomena demonstrated that the moduli of both the active and passive layers modulate the hygromorphic behaviour to the same degree. It is important to note that the hydrophobicity of the passive layer is also reduced at lower MDBS content, leading to faster response times by facilitating water transport to the active PVA layer.
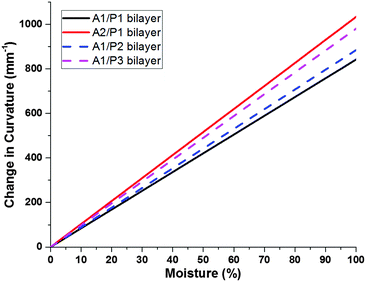 |
| | Fig. 5 Theoretical change in curvature for thick vs. thin electrospun mats determined using experimentally-determined elastic moduli, expansion coefficients, and layer thicknesses. | |
Utilizing these theoretical treatments of the active and passive layers, we determined that the P1 control would be an ideal passive layer. Bilayer hygromorphic films were fabricated using both the A1 and A2 controls, and their responses were visualized upon exposure to water.
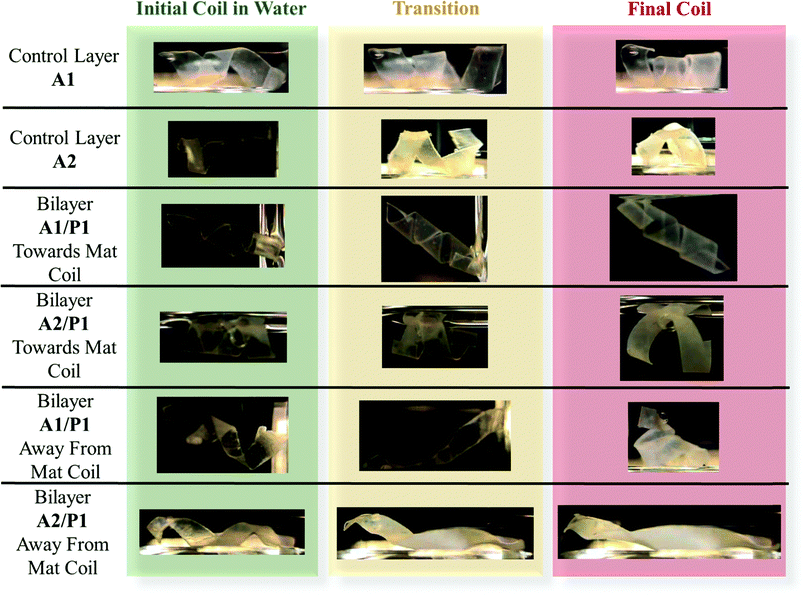
Folding bias in hygromorphic bilayers.
The natural curvature of A1 and A2 control layers and A1/P1 and A2/P2 bilayers when submerged in water was investigated. In standard bilayers, the active layer has no interlayer transport restrictions. However, the incorporation of random electrospun nanofibers within the active layer imposes an isotropic transport response, leading to variances in curvature changes (ESI,† Videos 7–10). As such, these variances restrict the ability for quantification of curvature changes with respect to a reference direction. However, qualitatively the bilayers exhibit preferential folding directions, where the bilayer curvature is arced in the direction of the electrospun mat.
The impact of transport properties and layer mechanics on folding bias was probed by fabricating bilayer strips with either a towards active PVA layer coil or an away from active PVA layer coil. The helical configuration allowed for macroscopic examination of the hygromorphic response despite the random transport response and for facile visualization of the unfolding/folding behavior. Photographic images of the bilayer responses when submerged in water are shown in Fig. 6. Videos of the hygromorphic response are provided as ESI,† Videos 1–6. The control films of EO–EPI and electrospun PVA (A1 and A2) both swelled and coiled tighter than their initial shape due to the imposed bias processing and the absence of a rigid restricting layer (e.g. passive layer). Since there is no “towards active layer” direction, it is more favourable to continue coiling in the set direction as the PVA swells and softens. In contrast, examination of the bilayer composites revealed a very different hygromorphic response as a function of folding bias. For the towards PVA electrospun mat coils, the A1/P1 bilayer composite exhibited only moderate swelling, while the A2/P1 bilayer composite exhibited swelling as well as unfolding. The difference in response was due to the higher degree of swelling in the thicker PVA system, allowing the mat to impose more force on the MDBS layer, despite the coils towards the preferred direction. For the systems coiled away from the active PVA layer, the A1/P1 bilayer composite unravelled quickly (within 3 min) upon exposure to water, then recoiled in the towards PVA mat direction. The response was driven initially by the swelling of the A1 active layer that released material stresses imposed by coiling the composite in the non-preferential direction, inducing the coil to unfold. The active layer continued absorbing water, leading to softening and recoiling in the preferential towards PVA mat direction. The A2/P1 away from mat coil also rapidly unfolded, but did not recoil in the opposite direction due to both the thickness and mechanics of the A2 layer, which prevent refolding by balancing with rather than submitting to the P1 passive layer. These variations in hygromorphic response based on experimentally tailored and theoretically modelled layer transport and mechanics demonstrated the feasibility of utilizing tailored bilayers comprised of electrospun nanofiber mats and self-assembled LMWG fillers.
 |
| | Fig. 6 Folding bias in bilayer composites. | |
Conclusions
PVA electrospun nanofiber mats and MDBS self-assembled networks were utilized as active and passive components, respectively, in the synergistic assembly of bilayer composites with hygromorphic behaviour. Control active and passive layers were fabricated to examine the influence of composition on the properties guiding hygromorphism, such as water transport, layer thickness, and layer modulus. Theoretical modelling of water front progression and bilayer curvature over time allowed for predictive descriptions of water transport in each of the control layers which provided ideal layer selections for modelling hygromorphic bilayer curvature. It was shown that the A2 active layer had the fastest water transport due to the higher PVA fraction, and the P1 passive layer had the slowest water transport as a result of the higher MDBS content. Reducing the MDBS content to form passive layers P2 and P3 decreased the passive layer modulus while also increasing water transport, which is unfavourable for the passive layer and overall bilayer curvature. However, the A1/P1 bilayer system exhibited the greatest change in curvature, due to the lower modulus and thickness of the A1 active layer compared to the A2 active layer.
We then examined folding bias and response variations by fabricating hygromorphic bilayers (A1/P1, A2/P1) using ideal material parameters. In the absence of MDBS, control active layers A1 and A2 swelled to form tighter coils. When the bilayer composites were folded towards the PVA active layer, the A1/P1 bilayer system displayed only slight swelling in water, but uncoiling was not demonstrated due to its configuration in the preferential coil direction. However, the A2/P1 bilayer system exhibited unfolding due to the increased swelling capacity and thickness of the PVA electrospun mat in the active layer, which allowed the A2 active layer to impose more force on its interfaced passive layer. Biasing the composite coil away from the PVA active layer led to complete unfolding of the coiled A1/P1 hygromorphic bilayer system in water, which then refolded in the preferential direction. The initial absorption of water released the material stresses imposed upon the bilayer in the non-preferred bias direction, and as the PVA layer softened, the bilayer was reconfigured to the preferential coil direction. Although unfolding was achieved, the higher swelling capacity and modulus of A2 limited the ability of the A2/P1 system coiled away from the PVA active layer to refold in the preferential direction due to the force balance with the passive layer.
This research highlights a new platform for the use of electrospun nanofibers in conjunction with self-assembled nanofiber networks to achieve sophisticated responsive materials. Future studies will focus on variations in bilayer architecture and patterning, and material choice to enhance control over folding bias and allow for multi-functionality in the near future.
Acknowledgements
The authors gratefully acknowledge financial support from the DuPont Young Professor Grant. S. L. M. A. thanks NSF Graduate Research Fellowship for financial support. The authors appreciate assistance from Lindsay E. Matolyak with dye elution experiments. This research used resources of the Advanced Photon Source, a U.S. Department of Energy (DOE) Office of Science User Facility operated for the DOE Office of Science by Argonne National Laboratory under Contract No. DE-AC02-06CH11357.
Notes and references
- Y. Forterre, J. Exp. Bot., 2013, 64, 4745–4760 CrossRef CAS PubMed
 .
.
- Y. Abraham and R. Elbaum, New Phytol., 2013, 199, 584–594 CrossRef CAS PubMed .
- R. Elbaum and Y. Abraham, Plant Sci., 2014, 223, 124–133 CrossRef CAS PubMed .
- E. Reyssat and L. Mahadevan, J. R. Soc., Interface, 2009, 6, 951–957 CrossRef CAS PubMed .
- B. Bar-On, X. Sui, K. Livanov, B. Achrai, E. Kalfon-Cohen, E. Wiesel and H. Daniel Wagner, Appl. Phys. Lett., 2014, 105, 033703 CrossRef .
- S.-W. Lee, J. H. Prosser, P. K. Purohit and D. Lee, ACS Macro Lett., 2013, 2, 960–965 CrossRef CAS .
- R. M. Erb, J. S. Sander, R. Grisch and A. R. Studart, Nat. Commun., 2013, 4, 1712 CrossRef PubMed .
- D. P. Holmes, M. Roché, T. Sinha and H. A. Stone, Soft Matter, 2011, 7, 5188 RSC .
- A. R. Studart and R. M. Erb, Soft Matter, 2014, 10, 1284–1294 RSC .
- W. E. Teo and S. Ramakrishna, Compos. Sci. Technol., 2009, 69, 1804–1817 CrossRef CAS .
- J. Zeng, H. Hou, J. H. Wendorff and A. Greiner, e-Polym., 2004, 078, 1 Search PubMed ; K. L. Liu, E. S. G. Choo, S. Y. Wong, X. Li, C. Bin He, J. Wang and J. Li, J. Phys. Chem. B, 2010, 114, 7489–7498 CrossRef CAS PubMed .
- N. D. Wanasekara, D. A. Stone, G. Wnek and L. T. J. Korley, Macromolecules, 2012, 45, 9092–9099 CrossRef CAS .
- N. D. Wanasekara, L. E. Matolyak and L. T. J. Korley, ACS Appl. Mater. Interfaces, 2015, 7, 22970–22979 CAS .
- R. G. Weiss, J. Am. Chem. Soc., 2014, 136, 7519–7530 CrossRef CAS PubMed .
- K. Roszak, M. Piasecka, A. Katrusiak and K. Kacprzak, Soft Matter, 2016, 12, 1368–1373 RSC .
- D. J. Cornwell and D. K. Smith, Mater. Horiz., 2015, 2, 279–293 RSC .
- D. A. Stone, E. Wilusz, W. Zukas, G. Wnek and L. T. J. Korley, Soft Matter, 2011, 7, 2449–2455 RSC .
- K. Hanabusa, A. Itoh, M. Kimura and H. Shirai, Chem. Lett., 1999, 767–768 CrossRef CAS .
- P. Chakraborty, B. Roy, P. Bairi and A. K. Nandi, J. Mater. Chem., 2012, 22, 20291 RSC .
- X. Y. Liu, P. D. Sawant, W. B. Tan, I. B. M. Noor, C. Pramesti and B. H. Chen, J. Am. Chem. Soc., 2002, 124, 15055–15063 CrossRef CAS PubMed .
- J. Cui, Z. Shen and X. Wan, Langmuir, 2010, 26, 97–103 CrossRef CAS PubMed .
- C. Yang, M. Bian and Z. Yang, Biomater. Sci., 2014, 2, 651–654 RSC .
- G. Pont, L. Chen, D. G. Spiller and D. J. Adams, Soft Matter, 2012, 8, 7797 RSC .
- Y. Zhang, R. Zhou, J. Shi, N. Zhou, I. R. Epstein and B. Xu, J. Phys. Chem. B, 2013, 117, 6566–6573 CrossRef CAS PubMed .
- L. Chen, S. Revel, K. Morris, D. G. Spiller, L. C. Serpell and D. J. Adams, Chem. Commun., 2010, 46, 6738 RSC .
- D. A. Stone, N. D. Wanasekara, D. Jones, N. R. Wheeler, E. Wilusz, W. Zukas, G. E. Wnek and L. T. J. Korley, ACS Macro Lett., 2012, 1, 80–83 CrossRef CAS .
- L. Yao, T. W. Haas, A. Guiseppi-Elie, G. L. Bowlin, D. G. Simpson and G. E. Wnek, Chem. Mater., 2003, 15, 1860–1864 CrossRef CAS .
- B. O. Okesola, V. M. P. Vieira, D. J. Cornwell, N. K. Whitelaw and D. K. Smith, Soft Matter, 2015, 4768–4787 RSC .
- T. A. Shepard, C. R. Delsorbo, R. M. Louth, J. L. Walborn, D. A. Norman, N. G. Harvey and R. J. Spontak, J. Polym. Sci., Part B: Polym. Phys., 1997, 35, 2617–2628 CrossRef CAS .
- K. Mai, K. Wang and H. Zeng, J. Appl. Polym. Sci., 2003, 88, 1608–1611 CrossRef CAS .
- W.-C. Lai and L.-T. Cheng, Desalination, 2014, 332, 7–17 CrossRef CAS .
- D. A. Stone and L. T. J. Korley, Macromolecules, 2010, 43, 9217–9226 CrossRef CAS .
Footnote |
| † Electronic supplementary information (ESI) available: Microscopy of PVA electrospun mats and MDBS gels, diffusion coefficients of control layers, and videos of hygromorphic response. See DOI: 10.1039/c6sm00749j |
|
| This journal is © The Royal Society of Chemistry 2017 |