Preparation of high performance supercapacitor materials by fast pyrolysis of corn gluten meal waste†
Bin-Hai
Cheng
 ab,
Ke
Tian
a,
Raymond J.
Zeng
ab and
Hong
Jiang
 *a
*a
aCAS Key Laboratory of Urban Pollutant Conversion, Department of Chemistry, University of Science & Technology of China, Hefei, 230026, P. R. China. E-mail: jhong@ustc.edu.cn; Fax: +86-551-63607482
bSchool of Life Sciences, University of Science and Technology of China, Hefei 230026, China
First published on 3rd April 2017
Abstract
Fast pyrolysis of biomass wastes which is usually finished in a few seconds for the preparation of porous carbonaceous materials (PCMs) is much faster and more energy-efficient than the conventional hydrothermal carbonization (HTC) method and does not require the use of solvents. In this study, PCMs were prepared using corn gluten meal (CGM) waste by fast pyrolysis combined with chemical activation by KOH, and the capacitance performance of the resulting PCMs was investigated. The specific capacitance of PCMP500 (fast pyrolysis at 500 °C) was 488 F g−1 at a current density of 0.5 A g−1, which is better than those of PCMs obtained at other pyrolytic temperatures (PCMP300 and PCMP400). Under the same conditions, the PCMs prepared by the HTC process exhibited relatively lower supercapacitance performance, i.e., PCMH250 (HTC at 250 °C) is 433 F g−1. The high performance of PCMP500 was mainly attributed to the high specific surface area and pore structure, which depends on the thermal treatment methods. This work demonstrates that fast pyrolysis may be a promising technology for massive production of high performance PCMs from biomass wastes.
Introduction
Porous carbonaceous materials (PCMs) are widely used as electrode materials in electrochemical double-layer capacitors (EDLCs) due to their large surface area and porosity, good electronic conductivity, high chemical stability, low-cost, and wide availability.1–5 Recently, polymer precursors,6 metal carbides,7 metal–organic frameworks,8 and hard templates9 have been used to produce PCMs. However, these methods have drawbacks, such as complicated fabrication processes and high cost, limiting their practical applications. There is growing interest in using organic wastes to prepare carbon materials as an environmentally beneficial and cost-effective method. Hydrothermal carbonization (HTC) and pyrolysis are two basic processes to obtain carbon materials from biomass wastes.10–13 To improve the electrochemical performance, activation by NaOH, KOH, ZnCl2, or H3PO4 is often used to enhance the specific surface area and porosity of the as-prepared PCMs.14–16The HTC process can be divided into two main parts: high-temperature HTC (300–800 °C) and low-temperature HTC (<300 °C). The process is usually conducted in a suspension with water under saturated pressure for several hours. Generally, biomass or biomass-derived precursors (carbohydrates) undergo a dehydration–polymerization process to produce carbon particles decorated with polar functional groups. For example, functional carbon micro-particles have been synthesized by the simple HTC of glucose in the presence of acrylic acid monomers.10 This method offers a general platform for the production of carbonaceous materials with abundant functional groups on the surface.17 Cellulose, potato starch, and eucalyptus wood saw dust have been transformed into PCMs using the HTC/KOH activation process. The specific capacitance of the produced carbons approaches 236 F g−1 when measured in a symmetric configuration in an organic electrolyte.11
Fast pyrolysis is often used for the conversion of renewable energy from lignocellulosic biomass, in which feedstock is rapidly heated in the absence of air. The volatiles are condensed to a dark brown mobile liquid (bio-oil) or uncondensed gas (bio-gas). A solid residue (biochar) is also obtained. The bio-oil can be used as a bio-fuel or chemical resource, and the biochar can be used as a carbon raw material for the synthesis of PCMs. Compared to the HTC method, fast pyrolysis is a solvent-free process that can be accomplished in seconds.18–20 Biochar-based functional materials are widely used as electrode materials for supercapacitors.21–26 These raw biochar materials have an abundance of oxygenated functional groups, e.g., OH, C![[double bond, length as m-dash]](https://www.rsc.org/images/entities/char_e001.gif) O, and COOH. The functionalities act to greatly enhance the pseudocapacitance performance and increase the amount of energy stored in the supercapacitor. In our previous work, we prepared nanofiber/mesoporous biochar composites via the pyrolysis of Fe(III)-preloaded fir sawdust biomass. The as-synthesized materials can be directly employed as electrode materials for electrochemical energy storage and exhibit favorable energy storage performance, good retention capability, and excellent stability and durability.27
O, and COOH. The functionalities act to greatly enhance the pseudocapacitance performance and increase the amount of energy stored in the supercapacitor. In our previous work, we prepared nanofiber/mesoporous biochar composites via the pyrolysis of Fe(III)-preloaded fir sawdust biomass. The as-synthesized materials can be directly employed as electrode materials for electrochemical energy storage and exhibit favorable energy storage performance, good retention capability, and excellent stability and durability.27
Although the fast pyrolysis approach has many advantages over the HTC method in preparing PCMs, however, to our knowledge, the direct comparison of the electrochemical performance of PCMs obtained by fast pyrolysis and HTC technologies has not been found, which is important for decreasing the cost of recycling biomass wastes. Thus, it is necessary to determine the capacitive performance of PCMs obtained by different methods and under different conditions.
Corn gluten meal (CGM) is a byproduct of corn (maize) processing that has historically been used as an animal feed. The main composition of CGM is corn protein, starch, and fiber.28–30 Here, we used CGM as a model waste to prepare PCMs using HTC and fast pyrolysis methods. The main objective of the present study was to systematically compare the HTC and fast pyrolysis methods for the preparation of high performance PCMs by characterizing their electrochemical properties. The subordinate purpose was to obtain the optimum parameters for PCM preparation. We therefore synthesized seven materials (four derived from HTC/KOH activation and three from fast pyrolysis/KOH activation). We then analyzed the surface and porosity characteristics, determined their electric capacitive performance, and investigated the key factors influencing the capacitance of the prepared materials.
Experimental section
Materials
The CGM was purchased from a corn starch factory in Shandong, China. The acquired CGM particles were dried in an oven at 105 °C overnight, and then crushed with a high-speed rotary cutting mill and screened through a 100-mesh sieve to collect the particles. All the reagents used in this experiment were of analytical grade and used without further purification.Preparation of porous carbon materials
The PCMs were produced from CGM using HTC and fast pyrolysis methods. The procedure for the synthesis of the PCMs consisted of the following steps: hydrothermal treatment (or fast pyrolysis) followed by chemical activation with KOH. For the HTC process, 24 g dry CGM was added to 100 mL deionized water, stirred, and transferred into a 200 mL Teflon-lined autoclave in an electric oven and incubated at 250 °C for 2 h. The products were collected by centrifuging and then were washed three times with deionized water. Finally, the products were dried at 105 °C overnight, and hydrochar was obtained (denoted as HC). In the fast pyrolysis process, 5.0 g of CGM was placed in the feed pipe under a N2 flow (400 mL min−1). The N2 flow was maintained for 30 min to remove air from the pyrolysis system, and the pyrolysis temperature was set to 300, 400, or 500 °C. When the temperature rose to the set value, the CGM was quickly inserted into the quartz tubular reactor using a piston. The produced volatiles were removed by using a 200 mL min−1 N2 flow and condensed using cold ethanol to obtain bio-oil. Once the pyrolysis process was completed, the quartz tubular was immediately removed from the heating zone, and cooled to room temperature in a N2 flow of 200 mL min−1 to obtain the biochar (denoted as BC).In the activation process, the HC was evenly mixed with KOH powder at a weight ratio of 1![[thin space (1/6-em)]](https://www.rsc.org/images/entities/char_2009.gif) :
:![[thin space (1/6-em)]](https://www.rsc.org/images/entities/char_2009.gif) 4 (HC
4 (HC![[thin space (1/6-em)]](https://www.rsc.org/images/entities/char_2009.gif) :
:![[thin space (1/6-em)]](https://www.rsc.org/images/entities/char_2009.gif) KOH) in an agate mortar. Next, the mixture was heated to 600 to 900 °C using a heating rate of 5 °C min−1 in a horizontal furnace under a 60 mL min−1 argon gas flow, and the setting temperature was held for 1 h. After cooling down, the activated sample was thoroughly washed with 10 wt% HCl solution three times to remove the inorganic compounds, and then washed with deionized water until reaching a neutral pH. Finally, the sample was dried at 105 °C overnight, and the PCMs (denoted as PCMHT, where H refers to the HTC process and T is the activation temperature) were obtained. Similarly, the BC obtained at different pyrolysis temperatures was activated using the same procedures, held at a fixed end temperature (700 °C), and the activated pyrolysis carbon materials were denoted as PCMPT (P for fast pyrolysis, and T indicates the fast pyrolysis temperature).
KOH) in an agate mortar. Next, the mixture was heated to 600 to 900 °C using a heating rate of 5 °C min−1 in a horizontal furnace under a 60 mL min−1 argon gas flow, and the setting temperature was held for 1 h. After cooling down, the activated sample was thoroughly washed with 10 wt% HCl solution three times to remove the inorganic compounds, and then washed with deionized water until reaching a neutral pH. Finally, the sample was dried at 105 °C overnight, and the PCMs (denoted as PCMHT, where H refers to the HTC process and T is the activation temperature) were obtained. Similarly, the BC obtained at different pyrolysis temperatures was activated using the same procedures, held at a fixed end temperature (700 °C), and the activated pyrolysis carbon materials were denoted as PCMPT (P for fast pyrolysis, and T indicates the fast pyrolysis temperature).
Characterization of the materials
The thermogravimetric analysis of CGM was performed on a TGA instrument (TGA, Q5000, V3.15, Build 263). The morphology of the PCMs was examined by scanning electron microscopy (SEM, Sirion 200, FEI electron optics company, USA) and transmission electron microscopy (TEM, JEOL-2100F, Japan). The Raman analysis of the materials was carried out on a laser Raman spectrometer (LabRamHR, HORIBA Jobin Yvon. Co., France) with a laser radiation source operating at a wavelength of 514 nm and a power of 25 mW. An X-ray diffractometer (XRD) with an 18 kW rotating anode (MXPAHF, Japanese Make Co., Japan) was used to analyze the crystal structure. N2 adsorption–desorption isotherms were measured at −196 °C from a relative pressure P/P0 of 3.5 × 10⁻⁷ to 0.99 to assess the surface area and porosity data of the PCMs using a Quantachrome Autosorb iQ Station, Quantachrome Instruments. Before measurements, the samples were outgassed at 300 °C for 6 h. The specific surface areas of the samples were determined with the Brunauer–Emmett–Teller (BET) method, and the pore-size distributions were deduced using the density functional theory (DFT) method. The elemental compositions (C, H, N, and O) of the CGM and PCMs were determined using an elemental analyzer (VARIO EL III, Elementar Inc., Germany). X-ray photoelectron spectroscopy (XPS) was performed in a Constant Analyzer Energy (CAE) mode (70 eV pass energy for survey spectra and 20 eV for high resolution spectra) using a Thermo VG-Scientific spectrometer (ESCALAB250, UK) with monochromatized Al Kα radiation (1486.92 eV).Electrochemical measurements
For the electrochemical measurements of the PCMs, the working electrodes were prepared by loading a slurry consisting of 90 wt% PCMs and 10 wt% binder (polytetrafluoroethylene (PTFE) in methanol) on nickel foam and dried at 80 °C for 30 min. The as-formed electrodes were then pressed and further dried in an oven at 80 °C overnight. The effective geometric area of the coating was 1 × 1 cm2. Electrochemical measurements were performed using a three-electrode system in 6 M KOH solution. Platinum wire and a Hg/HgO electrode were used as the counter electrode and reference electrode, respectively. The measurements were carried out at room temperature on a CHI 760E (CH Instrument Co., China) electrochemical workstation. Cyclic voltammetry (CV) curves were obtained within the potential window from −1.0 to 0 V (vs. Hg/HgO). Galvanostatic charge–discharge (GCD) measurements were carried out at 0.5 to 20 A g−1 over a potential range from −1.0 to 0 V (vs. Hg/HgO). The discharge specific capacitance was calculated from the GCD curves using formula (1):31 | (1) |
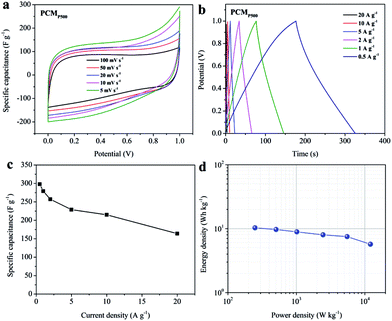
The electrochemical performance of PCMP500 was measured in a symmetrical two-electrode cell with two nearly identical (by weight and size) film electrodes using glass fiber as the separator. The working electrode was fabricated by mixing PCMP500 (90 wt%) and PTFE (10 wt%) with NMP as the solvent. Afterwards, the electrode films were dried and pressed under 10 MPa for 30 seconds. The weight of each electrode film was ∼2 mg per 1 cm2 area. The cyclic voltammetry (CV) curve and galvanostatic charge/discharge (GCD) voltage profiles data were obtained with a CHI760E electrochemical workstation. The gravimetric specific capacitance Cg (F g−1) of a single electrode was calculated from the discharge curve after the IR drop according to formula (2):32
 | (2) |
 | (3) |
 | (4) |
Results and discussion
Pre-carbonization of CGM
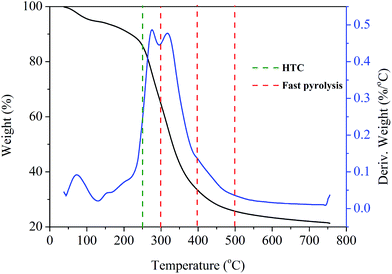
To select optimum thermal treatment temperature, the TG analysis of CGM was first performed. Fig. 1 shows the TG analysis of the original CGM in a nitrogen flow with the derivative TG (DTG) signal. The DTG curve shows a small peak below 100 °C, possibly owing to moisture loss. Next, two significant peaks appear at around 300 °C. Weight loss occurs rapidly from 200 to 400 °C, leading to nearly 60% loss of the total sample weight. After 600 °C, the weight remains almost unchanged. Since the CGM can decompose in a range of temperatures from 200 to 500 °C, a relatively mild temperature (250 °C) was chosen for the hydrothermal treatment temperature. 300, 400, and 500 °C were selected as fast pyrolysis temperatures considering the yield of bio-oil.Structural and chemical properties of porous carbon materials
The morphology and structure of the prepared PCMs were examined by SEM. Fig. 2a–d show the SEM images of PCMs obtained at different activation temperatures ranging from 600 to 900 °C following HTC treatment at 250 °C. At relatively low temperature, the porosity of PCMH600 was not well formed. As activation temperature increased, uniform pore structures formed (PCMH700 and PCMH800). However, the porosity began to collapse at an activation temperature of 900 °C and multiple flakes were observed on the surface of PCMH900. A similar trend was also observed by Qian.33 This indicates that optimization of the activation temperature is a prerequisite for the preparation of high performance PCMs. Usually, uniform and porous structures are favorable for electrical energy storage.34–37 A lower activation temperature requires less energy, so we selected an optimum activation temperature of 700 °C. The SEM images of PCMs obtained from the fast pyrolysis of CGM at different temperatures and activated at 700 °C are shown in Fig. 2e–g. PCMP300, PCMP400, and PCMP500 exhibited great porosity with different pore diameters. The pores appear to be interconnected with each other, which facilitates ion transport.38–40 No obvious differences were observed in the morphology and structure of PCMs obtained by fast pyrolysis at different temperatures. The micro-porous structure could be observed clearly in the TEM image (Fig. S1†). The high-resolution TEM of PCMP500 revealed a highly disordered porous carbon structure without graphite ribbons and crystalline impurities (Fig. 2h). Raman spectroscopy was used to elucidate the nature of the samples (Fig. S2†). Two characteristic peaks at 1340 and 1580 cm−1 are assigned to the D band and the G band. The disorder degree of the carbon material can be generally described by the intensity ratio between the D and the G band (ID/IG). In this work, the ID/IG of PCMH600–900 is 1.06, 1.05, 1.03, and 0.57, respectively, indicating the existence of considerable structural disorder in the carbon matrix (PCMH900 has a higher degree of graphitization because of higher thermal conditions). The ID/IG of PCMP300–500 is 0.93, 0.93, and 0.94, respectively, which show no difference owing to the same activation temperature. As shown in Fig. S3,† no sharp peaks are observed in the XRD pattern, indicative of the amorphous state of carbon in PCMs. SEM images of the CGM show a irregular dense structure with a rough surface (Fig. S4†).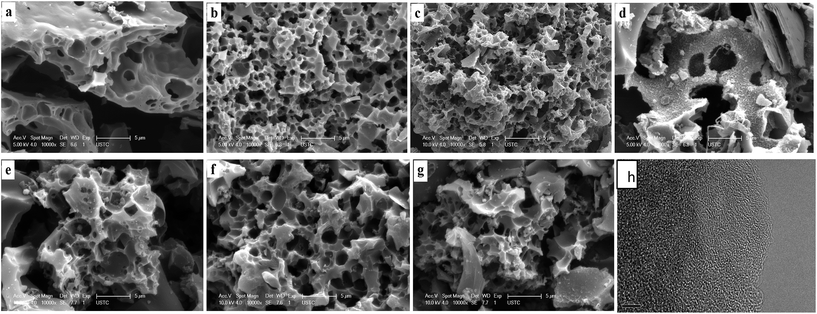 | ||
| Fig. 2 (a–d) SEM images of PCMH600–900; (e–g) SEM images of PCMP300–500; (h) HRTEM image of PCMP500 (5 nm). | ||
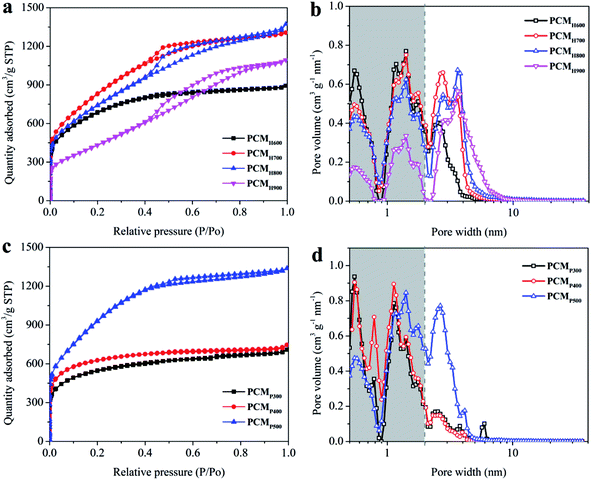
The surface area and pore texture of the PCMs were analyzed using the N2 adsorption–desorption method. Fig. 3a shows the N2 adsorption–desorption isotherms of PCMH600, PCMH700, PCMH800, and PCMH900. As the activation temperature increased, a small hysteresis loop appeared from P/P0 values of 0.5 to around 0.8, and the loop types gradually changed from type I to IV according to the IUPAC classification.41 This agrees with the observed pore size distribution shown in Fig. 3b, indicating the growth of micropores (<2 nm) to mesopores (2–50 nm) in these PCMs. The average pore diameters of the PCMs were 2.4 nm, 2.7 nm, 3.2 nm and 4.1 nm, respectively (Table 1). The BET specific surface area (SSA) increased from 2268 to 2968 m2 g−1 as the activation temperature increased from 600 to 700 °C. However, as the temperature increased to 800 °C, the BET SSA decreased to 2630 m2 g−1, and dropped to 1636 m2 g−1 at 900 °C. This supports the finding that 700 °C is an optimum activation temperature for PCMs. The surface area, pore volume, and average pore size of the PCMs are summarized in Table 1. A high surface area and fine porosity can provide an efficient electrode–electrolyte interface for the accumulation of charges or ions, which is very important for the function of a supercapacitor.32
| Sample code | S BET (m2 g−1) | V P (cm3 g−1) | Pore size (nm) | Elemental analysis | XPS analysis | ||
|---|---|---|---|---|---|---|---|
| N (wt%) | O (wt%) | N (at%) | O (at%) | ||||
| a Pore volume determined at P/P0 = 0.99. | |||||||
| CGM | 1.51 | 0.001 | 2.8 | 9.87 | 33.59 | — | — |
| PCMH600 | 2268 | 1.38 | 2.4 | 1.00 | 20.58 | 1.08 | 9.97 |
| PCMH700 | 2968 | 2.02 | 2.7 | 0.64 | 11.62 | 0.74 | 8.47 |
| PCMH800 | 2630 | 2.12 | 3.2 | 0.64 | 16.53 | 0.89 | 15.00 |
| PCMH900 | 1636 | 1.69 | 4.1 | 0.58 | 18.94 | 1.54 | 13.08 |
| PCMP300 | 1711 | 1.10 | 2.6 | 1.49 | 29.61 | 3.73 | 11.84 |
| PCMP400 | 1905 | 1.15 | 2.4 | 0.73 | 17.27 | 1.81 | 9.54 |
| PCMP500 | 3353 | 2.07 | 2.5 | 0.69 | 8.52 | 1.38 | 11.94 |
Fig. 3c–d show the N2 adsorption–desorption isotherms and pore distributions of PCMP300, PCMP400, and PCMP500. The SSA increased with the elevation of the pyrolysis temperature, i.e., 1711 m2 g−1 for PCMP300, 1905 m2 g−1 for PCMP400, and 3353 m2 g−1 for PCMP500 (Table 1). The pore volume increases nearly linearly with the SSA, and was 1.10, 1.15, and 2.07 cm3 g−1 for PCMP300, PCMP400, and PCMP500, respectively. However, the average pore diameters of PCMs are slightly different (2.6 nm for PCMP300, 2.4 nm for PCMP400, and 2.5 nm for PCMP500).
Electrochemical performance
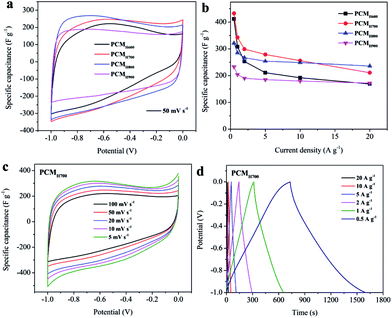
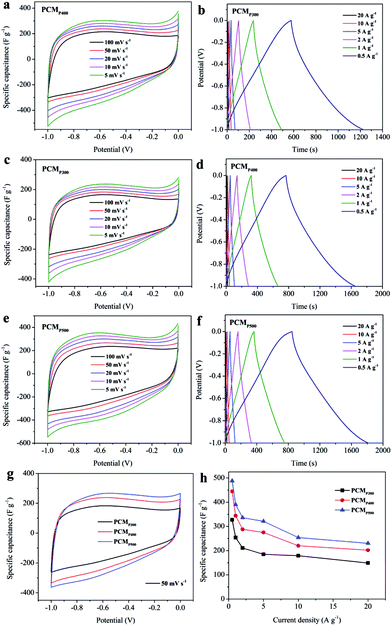
The electrochemical performance of the synthesized PCMs was investigated using cyclic voltammetry (CV) and galvanostatic charge–discharge (GCD) in a three-electrode system with 6 M KOH electrolyte. The CV curves of PCMH600, PCMH700, PCMH800, and PCMH900 are shown in Fig. 4a. The CV curve of PCMH700 at 50 mV s−1 has a larger integral area and a finer rectangular and symmetric shape, compared to the pattern shown by the other PCMs. The maximum specific capacitance of PCMH700 calculated from the GCD curve was 433 F g−1 at a current density of 0.5 A g−1 and 211 F g−1 at a high current density of 20 A g−1, which is higher than the values of PCMH600, PCMH800, and PCMH900. The CV curves of PCMH700 over a wide range of scan rates from 5 to 100 mV s−1 show a similar rectangular and symmetric shape (Fig. 4c), which indicates that PCMH700 has good ion transporting capabilities and an accessible surface area.42 The GCD profiles display approximately triangular shapes (Fig. 4d). Instead of the typical rectangular shape, a region of reversible pseudofaradaic reaction can be observed at about −0.6 V in the CV curves of PCMH700. Additionally, the nonlinear characteristic and relatively longer discharge time of the GCD curves of PCMH700 are consistent with both EDLC and pseudocapacitive performance.43 Detailed CV and GCD results of PCMH600, PCMH800, and PCMH900 are presented in Fig. S6 in the ESI.† Combining the results of CV and GCD, the PCMH700 exhibits favorable EDLC performance.The CV and GCD of PCMP300, PCMP400, and PCMP500 were also measured using a three-electrode system with a 6 M KOH electrolyte. The typical CV curves of PCMs display a rectangular shape as well as triangular GCD profiles, demonstrating the reversible capacitive behavior as EDLC (Fig. 5a–f). Instead of the typical rectangular shape, a region of reversible pseudofaradaic reaction was observed at −0.9 to −0.5 V from the CV curves of the pyrolytic-obtained PCMs, especially at a low scan rate. Moreover, the nonlinear characteristic and relatively longer discharge time of the GCD curves exhibited additional pseudocapacitive performance.43 CV curves at scan rates from 5 to 100 mV s−1 were determined. PCMP500 shows a larger integral area in the CV curves than PCMP300 and PCMP400 (Fig. 5g). In addition, the GCD profiles show that PCMP500 has the longest discharge time at current densities from 0.5 to 20 A g−1. The specific capacitance was calculated from GCD profiles at different current densities (Fig. 5h). PCMP500 shows better capacitive behavior compared to PCMP300 and PCMP400. The maximum specific capacitance of PCMP500 was 488 F g−1 at a current density of 0.5 A g−1, which indicates excellent electric capacity among carbon-based supercapacitors (summarized in ESI Table S1†). These results demonstrated that the capacitive performance of PCMs obtained from fast pyrolysis is better than that of PCMs prepared by the HTC process.
In addition to larger specific capacitance, good ion/charge transport and diffusion kinetics, and smaller internal resistance of carbon materials are important for the fabrication of efficient supercapacitors.7,44–46Fig. 6 shows that the PCMs have a similar, almost vertical curve in the low frequency region, indicating good capacitance behavior in a frequency range from 10 mHz to 100 kHz.47 In the high frequency region (inset in Fig. 6a and b), the PCMs exhibit low equivalent series resistance (<0.5 Ω) for ion diffusion efficiency. Smaller contact resistance between the material and ions produce low equivalent series resistance (ESR) for the PCMs, indicating lower charge-transfer resistance on the electrode surface.
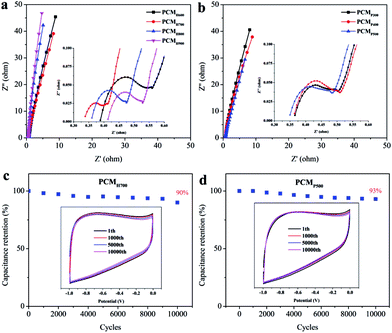 | ||
Fig. 6 EIS of (a) PCMH600–900 and (b) PCMP300–500; cycling stability of (c) PCMH700 and (d) PCMP500 over 10![[thin space (1/6-em)]](https://www.rsc.org/images/entities/char_2009.gif) 000 cycles at a scan rate of 50 mV s−1, and (insets) CV curves of the selected cycles. 000 cycles at a scan rate of 50 mV s−1, and (insets) CV curves of the selected cycles. | ||
The stability of the cell was evaluated by long-term CV cycling at a sweep rate of 50 mV s−1. It can be seen that the capacitance was retained at 90% for PCMH700 and 93% for PCMP500 after 10![[thin space (1/6-em)]](https://www.rsc.org/images/entities/char_2009.gif) 000 cycles, proving their fine stability (Fig. 6c and d). Therefore, taking into account cost-effective and scalable characteristics coupled with specific capacitance and stability, PCMP500 has great potential for both research and industrial applications.
000 cycles, proving their fine stability (Fig. 6c and d). Therefore, taking into account cost-effective and scalable characteristics coupled with specific capacitance and stability, PCMP500 has great potential for both research and industrial applications.
Comparison of thermo treatment types on capacitive performance
Considering the SSA, pore characterization, and capacitance performance results (Table 1 and Fig. 7), PCMs prepared by fast pyrolysis show improved properties relative to those prepared by HTC. This difference in capacitive performance is attributed to differences in the surface characteristics. Many studies have reported the effects of SSA and pore distribution.37,46,48,49 The higher SSA and pore volume of PCMP500 are responsible for the observed high CV and GCD and the excellent specific capacitance.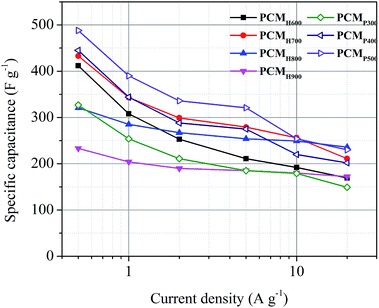 | ||
| Fig. 7 Specific capacitance of the PCMs calculated from GCD profiles at different current densities. | ||
Elemental composition and functional groups on PCMs can also affect the capacitive performance of PCMs.50–54 The amounts of heteroatoms (N and O) in the bulk materials are 8.5–29.6% (O) and 0.7–1.5% (N), and these amounts gradually decrease with increasing pyrolysis temperature (Table 1). XPS was used to identify the surface elemental composition of the pyrolytic derived PCMs obtained under different conditions (see ESI Fig. S5†). However, there was no obvious association between the elemental composition and capacitance among different PCMs observed in this work, suggesting that the dominant factors determining the capacitive performance are the SSA and pore characteristics, which may be attributed to the difference in thermo treatment types.
Electrochemical tests in a two-electrode system
The results of electrochemical measurement are shown in Fig. 8. The CV curves of PCMP500 over a wide range of scan rates from 5 to 100 mV s−1 show a similar rectangular and symmetric shape (Fig. 8a). Moreover, the GCD profiles display approximately triangular shapes (Fig. 8b), which indicates a favorable EDLC performance. The specific capacitance of PCMP500 in 6 M KOH is 298, 279, 257, 229, 215 and 165 F g−1 at current densities of 0.5, 1, 2, 5, 10 and 20 A g−1, respectively (Fig. 8c). The values are lower than those measured in a three-electrode system, which is quite reasonable considering the remarkable difference between the two configurations. Furthermore, the energy density and power density were calculated, and the results are shown in Fig. 8d. PCMP500 in 6 M KOH electrolyte exhibits an energy density of 10.3 or 5.7 W h kg−1 which corresponds to a power density of 0.25 or 12.1 kW kg−1.Conclusions
In summary, we compared two thermochemical methods (HTC and fast pyrolysis, combined with KOH activation) to produce high SSA PCMs from low-cost CGM. The high SSA of over 3000 m2 g−1 and porous properties of PCMP500 provide short ion diffusion paths and, consequently, rapid transport of ions throughout the carbon matrix, leading to a high specific capacitance of 488 F g−1 and fine cycling stability. All the results indicate that fast pyrolysis is a faster and more economic thermochemical process for the preparation of high performance supercapacitor materials, and can be performed in large-scale applications with high yields (about 15% of feedstocks).Acknowledgements
The authors gratefully acknowledge financial support from the National Natural Science Foundation of China (21677138), and the Key Special Program on the S&T for the Pollution Control, and Treatment of Water Bodies (No. 2012ZX07103-001).Notes and references
- M. Winter and R. J. Brodd, Chem. Rev., 2004, 104, 4245–4270 CrossRef CAS PubMed.
- A. G. Pandolfo and A. F. Hollenkamp, J. Power Sources, 2006, 157, 11–27 CrossRef CAS.
- L. L. Zhang and X. S. Zhao, Chem. Soc. Rev., 2009, 38, 2520–2531 RSC.
- Y. Zhai, Y. Dou, D. Zhao, P. F. Fulvio, R. T. Mayes and S. Dai, Adv. Mater., 2011, 23, 4828–4850 CrossRef CAS PubMed.
- M. Sevilla and R. Mokaya, Energy Environ. Sci., 2014, 7, 1250–1280 CAS.
- D. Puthusseri, V. Aravindan, S. Madhavi and S. Ogale, Energy Environ. Sci., 2014, 7, 728–735 CAS.
- J. Chmiola, G. Yushin, Y. Gogotsi, C. Portet, P. Simon and P. L. Taberna, Science, 2006, 313, 1760–1763 CrossRef CAS PubMed.
- W. Zhang, Z.-Y. Wu, H.-L. Jiang and S.-H. Yu, J. Am. Chem. Soc., 2014, 136, 14385–14388 CrossRef CAS PubMed.
- H. Nishihara and T. Kyotani, Adv. Mater., 2012, 24, 4473–4498 CrossRef CAS PubMed.
- B. Hu, K. Wang, L. Wu, S.-H. Yu, M. Antonietti and M.-M. Titirici, Adv. Mater., 2010, 22, 813–828 CrossRef CAS PubMed.
- L. Wei, M. Sevilla, A. B. Fuertes, R. Mokaya and G. Yushin, Adv. Energy Mater., 2011, 1, 356–361 CrossRef CAS.
- J. J. Manyà, Environ. Sci. Technol., 2012, 46, 7939–7954 CrossRef PubMed.
- W.-J. Liu, H. Jiang and H.-Q. Yu, Chem. Rev., 2015, 115, 12251–12285 CrossRef CAS PubMed.
- H. Marsh and F. R. Reinoso, Activated Carbon, Elsevier, 2006 Search PubMed.
- Y. Zhu, S. Murali, M. D. Stoller, K. J. Ganesh, W. Cai, P. J. Ferreira, A. Pirkle, R. M. Wallace, K. A. Cychosz, M. Thommes, D. Su, E. A. Stach and R. S. Ruoff, Science, 2011, 332, 1537–1541 CrossRef CAS PubMed.
- J. Wang and S. Kaskel, J. Mater. Chem., 2012, 22, 23710–23725 RSC.
- R. Demir-Cakan, N. Baccile, M. Antonietti and M.-M. Titirici, Chem. Mater., 2009, 21, 484–490 CrossRef CAS.
- R. Lu, G. P. Sheng, Y. Y. Hu, P. Zheng, H. Jiang, Y. Tang and H. Q. Yu, Biomass Bioenergy, 2011, 35, 671–678 CrossRef CAS.
- D. Mohan, C. U. Pittman and P. H. Steele, Energy Fuels, 2006, 20, 848–889 CrossRef CAS.
- H. S. Ding and H. Jiang, Bioresour. Technol., 2013, 133, 16–22 CrossRef CAS PubMed.
- M. Biswal, A. Banerjee, M. Deo and S. Ogale, Energy Environ. Sci., 2013, 6, 1249 CAS.
- H. Jin, X. Wang, Z. Gu and J. Polin, J. Power Sources, 2013, 236, 285–292 CrossRef CAS.
- J. Hou, C. Cao, X. Ma, F. Idrees, B. Xu, X. Hao and W. Lin, Sci. Rep., 2014, 4, 7260 CrossRef CAS PubMed.
- H. Jin, X. Wang, Y. Shen and Z. Gu, J. Anal. Appl. Pyrolysis, 2014, 110, 18–23 CrossRef CAS.
- H. Wang, Z. Li and D. Mitlin, ChemElectroChem, 2014, 1, 332–337 CrossRef.
- W.-H. Qu, Y.-Y. Xu, A.-H. Lu, X.-Q. Zhang and W.-C. Li, Bioresour. Technol., 2015, 189, 285–291 CrossRef CAS PubMed.
- W.-J. Liu, K. Tian, Y.-R. He, H. Jiang and H.-Q. Yu, Environ. Sci. Technol., 2014, 48, 13951–13959 CrossRef CAS PubMed.
- E. C. Titgemeyer, N. R. Merchen and L. L. Berger, J. Anim. Sci., 1989, 67, 262–275 CrossRef CAS PubMed.
- J. W. Lawton, Cereal Chem., 2002, 79, 1–18 CrossRef CAS.
- M. Park, J. Ryu, Y. Kim and J. Cho, Energy Environ. Sci., 2014, 7, 3727–3735 CAS.
- B. Wang, J. S. Chen, Z. Wang, S. Madhavi and X. W. Lou, Adv. Energy Mater., 2012, 2, 1188–1192 CrossRef CAS.
- L. Qie, W. Chen, H. Xu, X. Xiong, Y. Jiang, F. Zou, X. Hu, Y. Xin, Z. Zhang and Y. Huang, Energy Environ. Sci., 2013, 6, 2497–2504 Search PubMed.
- W. Qian, F. Sun, Y. Xu, L. Qiu, C. Liu, S. Wang and F. Yan, Energy Environ. Sci., 2014, 7, 379–386 CAS.
- C. O. Ania, V. Khomenko, E. Raymundo-Piñero, J. B. Parra and F. Béguin, Adv. Funct. Mater., 2007, 17, 1828–1836 CrossRef CAS.
- S. Kondrat, C. R. Perez, V. Presser, Y. Gogotsi and A. A. Kornyshev, Energy Environ. Sci., 2012, 5, 6474–6479 CAS.
- T. Kim, G. Jung, S. Yoo, K. S. Suh and R. S. Ruoff, ACS Nano, 2013, 7, 6899–6905 CrossRef CAS PubMed.
- C. Tran and V. Kalra, J. Power Sources, 2013, 235, 289–296 CrossRef CAS.
- D. Pech, M. Brunet, H. Durou, P. Huang, V. Mochalin, Y. Gogotsi, P.-L. Taberna and P. Simon, Nat. Nanotechnol., 2010, 5, 651–654 CrossRef CAS PubMed.
- B. G. Choi, J. Hong, W. H. Hong, P. T. Hammond and H. Park, ACS Nano, 2011, 5, 7205–7213 CrossRef CAS PubMed.
- H. Jiang, P. S. Lee and C. Li, Energy Environ. Sci., 2013, 6, 41–53 CAS.
- Y. Tao, H. Kanoh, L. Abrams and K. Kaneko, Chem. Rev., 2006, 106, 896–910 CrossRef CAS PubMed.
- M. Sevilla and A. B. Fuertes, ACS Nano, 2014, 8, 5069–5078 CrossRef CAS PubMed.
- G. A. Ferrero, A. B. Fuertes and M. Sevilla, J. Mater. Chem. A, 2015, 3, 2914–2923 CAS.
- C. Largeot, C. Portet, J. Chmiola, P.-L. Taberna, Y. Gogotsi and P. Simon, J. Am. Chem. Soc., 2008, 130, 2730–2731 CrossRef CAS PubMed.
- Z.-S. Wu, Y. Sun, Y.-Z. Tan, S. Yang, X. Feng and K. Müllen, J. Am. Chem. Soc., 2012, 134, 19532–19535 CrossRef CAS PubMed.
- Y. Li, Z. Li and P. K. Shen, Adv. Mater., 2013, 25, 2474–2480 CrossRef CAS PubMed.
- L. Wang, G. Mu, C. Tian, L. Sun, W. Zhou, P. Yu, J. Yin and H. Fu, ChemSusChem, 2013, 6, 880–889 CrossRef CAS PubMed.
- J. Chmiola, G. Yushin, R. Dash and Y. Gogotsi, J. Power Sources, 2006, 158, 765–772 CrossRef CAS.
- Z.-F. Li, H. Zhang, Q. Liu, L. Sun, L. Stanciu and J. Xie, ACS Appl. Mater. Interfaces, 2013, 5, 2685–2691 CAS.
- D. Hulicova-Jurcakova, M. Seredych, G. Q. Lu and T. J. Bandosz, Adv. Funct. Mater., 2009, 19, 438–447 CrossRef CAS.
- C. H. Choi, S. H. Park and S. I. Woo, Green Chem., 2011, 13, 406–412 RSC.
- L.-F. Chen, Z.-H. Huang, H.-W. Liang, H.-L. Gao and S.-H. Yu, Adv. Funct. Mater., 2014, 24, 5104–5111 CrossRef CAS.
- Z.-S. Wu, K. Parvez, A. Winter, H. Vieker, X. Liu, S. Han, A. Turchanin, X. Feng and K. Müllen, Adv. Mater., 2014, 26, 4552–4558 CrossRef CAS PubMed.
- J. Li, K. Liu, X. Gao, B. Yao, K. Huo, Y. Cheng, X. Cheng, D. Chen, B. Wang, W. Sun, D. Ding, M. Liu and L. Huang, ACS Appl. Mater. Interfaces, 2015, 7, 24622–24628 CAS.
Footnote |
| † Electronic supplementary information (ESI) available. See DOI: 10.1039/c7se00029d |
| This journal is © The Royal Society of Chemistry 2017 |

