The effect of KOH concentration on chemical activation of porous carbon sorbents for carbon dioxide uptake and carbon dioxide–methane selectivity: the relative formation of micro- (<2 nm) versus meso- (>2 nm) porosity†
Saunab
Ghosh
a and
Andrew R.
Barron
 *abc
*abc
aDepartment of Chemistry, Rice University, Houston, Texas 77005, USA. E-mail: arb@rice.edu
bEnergy Safety Research Institute, College of Engineering, Swansea University, Bay Campus, Swansea, SA1 8EN, Wales, UK. E-mail: a.r.barron@swansea.ac.uk
cDepartment of Materials Science and Nanoengineering, Rice University, Houston, Texas 77005, USA
First published on 21st March 2017
Abstract
Porous carbon (PC) sorbents are synthesized from polymer precursors mixed with a chemical activation reagent and pyrolised (>500 °C). KOH is known to be the best activator for a wide range of precursors, as it creates PCs with a large surface area (1200–4000 m2 g−1). In order to determine the optimum KOH![[thin space (1/6-em)]](https://www.rsc.org/images/entities/char_2009.gif) :
:![[thin space (1/6-em)]](https://www.rsc.org/images/entities/char_2009.gif) polymer ratio for both CO2 adsorption and CO2/CH4 selectivity, we prepared a set of five S-containing porous carbon (SPC) samples from polythiophene (PTh) with increasing KOH
polymer ratio for both CO2 adsorption and CO2/CH4 selectivity, we prepared a set of five S-containing porous carbon (SPC) samples from polythiophene (PTh) with increasing KOH![[thin space (1/6-em)]](https://www.rsc.org/images/entities/char_2009.gif) :
:![[thin space (1/6-em)]](https://www.rsc.org/images/entities/char_2009.gif) PTh ratio (1 to 5), and investigated CO2 and CH4 uptake measurements on carbonaceous SPC samples up to a pressure limit of 30 bar. The SPCs have been characterised by XPS, SEM, TEM and BET surface area analysis. Although the apparent surface area and total pore volume increased with increasing KOH concentration, the maximum CO2 uptake (5–30 bar) was demonstrated for samples with KOH
PTh ratio (1 to 5), and investigated CO2 and CH4 uptake measurements on carbonaceous SPC samples up to a pressure limit of 30 bar. The SPCs have been characterised by XPS, SEM, TEM and BET surface area analysis. Although the apparent surface area and total pore volume increased with increasing KOH concentration, the maximum CO2 uptake (5–30 bar) was demonstrated for samples with KOH![[thin space (1/6-em)]](https://www.rsc.org/images/entities/char_2009.gif) :
:![[thin space (1/6-em)]](https://www.rsc.org/images/entities/char_2009.gif) PTh = 3. This equates to SPC samples with a surface area and total pore volume of ∼2700 m2 g−1 and 1.5 cm3 g−1, respectively. Greater values for either parameter do not enhance the CO2 uptake, showing that it is not total porosity that is important. SPC samples formed with KOH
PTh = 3. This equates to SPC samples with a surface area and total pore volume of ∼2700 m2 g−1 and 1.5 cm3 g−1, respectively. Greater values for either parameter do not enhance the CO2 uptake, showing that it is not total porosity that is important. SPC samples formed with KOH![[thin space (1/6-em)]](https://www.rsc.org/images/entities/char_2009.gif) :
:![[thin space (1/6-em)]](https://www.rsc.org/images/entities/char_2009.gif) PTh = 3 show both a maximum C composition (85%), and a maximum fraction of micro-pores (<2 nm) with a concomitant decrease in meso-pores (>2 nm). KOH
PTh = 3 show both a maximum C composition (85%), and a maximum fraction of micro-pores (<2 nm) with a concomitant decrease in meso-pores (>2 nm). KOH![[thin space (1/6-em)]](https://www.rsc.org/images/entities/char_2009.gif) :
:![[thin space (1/6-em)]](https://www.rsc.org/images/entities/char_2009.gif) PTh = 3 is also the synthetic condition to maximise CH4 uptake (5–30 bar); however, the optimum CO2/CH4 selectivity occurred with KOH
PTh = 3 is also the synthetic condition to maximise CH4 uptake (5–30 bar); however, the optimum CO2/CH4 selectivity occurred with KOH![[thin space (1/6-em)]](https://www.rsc.org/images/entities/char_2009.gif) :
:![[thin space (1/6-em)]](https://www.rsc.org/images/entities/char_2009.gif) PTh = 2. This correlates with a different surface area (2200 m2 g−1) and total pore volume (1.2 cm3 g−1) that are required for optimum CO2 uptake. These results suggest that process conditions that lead to high relative microporosity need to be considered rather than the total surface area or pore volume.
PTh = 2. This correlates with a different surface area (2200 m2 g−1) and total pore volume (1.2 cm3 g−1) that are required for optimum CO2 uptake. These results suggest that process conditions that lead to high relative microporosity need to be considered rather than the total surface area or pore volume.
1. Introduction
Carbon capture and storage (CCS) is going to become an increasingly important process due to the effects of CO2 on global climate change.1–3 In a related manner, the separation of CO2 from natural gas (natural gas sweetening) is important since it is a major source of infrastructure corrosion.4–6 Despite the importance of the topic, research is still needed into more efficient materials to perform the capture/separation. To this end an understanding of the basic physico-chemical properties affecting adsorbent efficiency is desirable.Various solid or liquid sorbent materials that utilize either physical or chemical adsorption processes can capture CO2. One highly selective way is the use of amine derivatives as chemical sorbents.7 However, these have various limitations such as cost, corrosive nature, high regeneration temperature and toxicity. In addition, they are not ideal for high pressure gas uptake compared to other sorbents, such as metal–organic frameworks (MOFs),8 mesoporous silica,9 zeolites,10,11 and different hybrid solid materials,12–14 which demonstrate superior high pressure CO2 capture capacity than aminated sorbents.
For solid sorbents, the major parameters that contribute to CO2 capture are the surface area and the total pore volumes; thus most of the recent research has been devoted to improving CO2 capture capacity by means of fabrication of materials that have ever-increasing surface areas with abundant micro-pores. Among such sorbents with microporous structures, activated porous carbons (PCs) are unique adsorbents due to their high surface area and pore volumes, and micro- and meso-porous structures with significant adsorption capacity. Microporous activated PC sorbents can be prepared from different precursors, such as bio-waste, dry coconut shells, wood, sawdust,15 lignite, anthracite, petroleum coke and synthetic polymers.16 Typically, most of the carbon-rich polymers can be converted into activated carbons by high temperature carbonization treatment under an inert atmosphere. In general, activated PCs from such precursors are fabricated in two steps: the first step involves carbonization of the precursor <500 °C under an inert gas flow and the second step involves further chemical activation of the carbonized precursor using a strong oxidizing reagent. For the production of high surface area PCs, to date, researchers have explored a vast range of chemical reagents, such as strong bases (KOH and NaOH),16–19 salts (ZnCl2 and K2S),20 acids (H2SO4 and H3PO4),21 and borates (NaBO2·4H2O and Na2B4O7).22 The KOH activation of carbon rich precursors for the synthesis of PC materials was first introduced by Amoco Corporation in the 1980s.23 One major advantage of utilizing KOH as an activation agent is that it is less expensive and less corrosive to the carbonization reactors compared to other regents, such as acids. In addition, researchers found that PC sorbents synthesized from polymers of S or N or O-containing precursors and chemically activated with KOH at high temperature do not require any carbonization prior to chemical activation and demonstrate a significantly high surface area and porosity with remarkably high CO2 capture properties.15–18
In a seminal piece of work in this field, Sevilla and co-workers reported a new type of activated PC prepared from sulphur-containing polymer poly[2-thiophenemethanol], which had a remarkably high surface area and porosity and could be utilized for H2 storage application.18 This S-containing porous carbon (SPC) sorbent can be used for CO2 capture as well. However, to date, most of the S-containing sorbents prepared from polythiophene (PTh) have been investigated for CO2 uptake performance up to a pressure limit of only 1 bar due to the limitation of available instruments.24 Recently we have utilized SPC sorbents activated with a KOH![[thin space (1/6-em)]](https://www.rsc.org/images/entities/char_2009.gif) :
:![[thin space (1/6-em)]](https://www.rsc.org/images/entities/char_2009.gif) PTh weight ratio of ∼2 for CO2 capture up to a pressure of 30 bar.16 This pressure range is apropos to the removal of CO2 from natural gas since the well-head pressure remains as high as 300 bar25 and if natural gas contains 10% CO2 with an approximate pressure of 30 bar, gas uptake measurements are required to be performed up to a pressure range of 30 bar.
PTh weight ratio of ∼2 for CO2 capture up to a pressure of 30 bar.16 This pressure range is apropos to the removal of CO2 from natural gas since the well-head pressure remains as high as 300 bar25 and if natural gas contains 10% CO2 with an approximate pressure of 30 bar, gas uptake measurements are required to be performed up to a pressure range of 30 bar.
One of the keys to our study was the observation that there was a surface area and a total pore volume of any PC above which no improvement was possible.16 With regard to CO2 uptake this was a surface area >2800 m2 g−1, a total pore volume >1.35 cm3 g−1, and a carbon content of 80–95 wt% (as determined by XPS). We also note that there is a correlation between the carbon content and the pore size.16 While it has been assumed that the parameters that make a good CO2 adsorbent are the same as those that provide a material with high CO2/CH4 selectivity, our results indicate instead that for the best selectivity a surface area >2000 m2 g−1, a total pore volume >1.0 cm3 g−1, and a carbon content of <90 wt% are necessary. The subsequent performance map could be used as a guide to designing/choosing materials for both future studies and large-scale fluid bed applications using pelletized materials.
One parameter that was not explored was the effect of the KOH![[thin space (1/6-em)]](https://www.rsc.org/images/entities/char_2009.gif) :
:![[thin space (1/6-em)]](https://www.rsc.org/images/entities/char_2009.gif) precursor ratio; however, it is expected that the surface area and porosity of PC samples should improve systematically with further addition of KOH during the high temperature activation process and so the CO2 uptake capacity. To examine the validity of this postulate, we have carried out careful volumetric CO2 and CH4 excess uptake measurements on a set of SPC sorbents, prepared from PTh and activated at a stable temperature of 700 °C (previously determined to be the optimum16) with different KOH
precursor ratio; however, it is expected that the surface area and porosity of PC samples should improve systematically with further addition of KOH during the high temperature activation process and so the CO2 uptake capacity. To examine the validity of this postulate, we have carried out careful volumetric CO2 and CH4 excess uptake measurements on a set of SPC sorbents, prepared from PTh and activated at a stable temperature of 700 °C (previously determined to be the optimum16) with different KOH![[thin space (1/6-em)]](https://www.rsc.org/images/entities/char_2009.gif) :
:![[thin space (1/6-em)]](https://www.rsc.org/images/entities/char_2009.gif) PTh weight ratios. Our results suggest that besides the surface area and total pore volume of a particular sample, the relative composition of meso- and micro-pores is the defining structural feature for optimising CO2 uptake.
PTh weight ratios. Our results suggest that besides the surface area and total pore volume of a particular sample, the relative composition of meso- and micro-pores is the defining structural feature for optimising CO2 uptake.
2. Experimental
2.1. Materials and methods
FeCl3, 2-thiophenemethanol (purchased from Sigma Aldrich, 98% purity), CH3CN, powdered KOH, distilled water, acetone, HCl, Ar (99.9% pure), CO2 (99.99% pure, Matheson TRIGAS) and CH4 (99.9% pure) were used as supplied.The polymer precursors and SPC materials were characterised by X-ray photoelectron spectroscopy (XPS), Fourier transform infrared spectroscopy (FTIR), scanning electron microscopy (SEM), high resolution transmission electron microscopy (HRTEM) and BET surface area analysis. The XPS measurements were carried out on a PHI Quantera scanning XPS microprobe. The wt% of chemical elements was determined by XPS survey scans with a pass energy of 140 eV. For detailed elemental analysis high-resolution multi-cycle elemental scans with a pass energy of 26 eV were performed. Each spectrum was then deconvoluted by appropriate basis functions. Before spectral fitting, each spectrum was corrected for the reference binding energy of C 1s to 284.8 eV. FTIR spectral measurements were performed on a Nicolet FTIR Infrared Microscope equipped with a liquid N2 cooled detector. Scanning electron microscopy images were obtained using a FEI Quanta 400 ESEM FEG high-resolution field emission scanning electron microscope. The high-resolution TEM images of activated SPCs were obtained using a JEOL 2100 field emission gun transmission electron microscope.
The textural properties, including surface areas, distributions of pore volumes and the total pore volume of carbonaceous materials, were obtained by analysing N2 sorption isotherms (measured at 77 K), measured on a Quantachrome Autosorb-3b BET Surface Analyser. Before measurements, the samples were dried at 130 °C for 6 h in a high vacuum system equipped with a liquid N2 cold trap. The apparent BET surface area (SBET) was calculated from N2 adsorption isotherms in the partial pressure (P/P0) range of 0.05–0.30 by the multipoint BET (Brunauer–Emmett–Teller) method. The total pore volume was estimated from the amount of adsorbed N2 at P/P0 = 0.99. The distributions of pore volumes were determined by analysing the data via non-local density functional theory. The pore volumes and surface area of micropores were determined by analysing N2 isotherms by the t-plot method.26 Results are given in Table 1.
| Samplea | Cb (wt%) | Ob (wt%) | Sb (wt%) | Surface area SBET (m2 g−1) | Total pore volume Vp (cm3 g−1) | CO2 uptake at 30 bar (mmol g−1) | CO2 uptake at 30 bar (mg g−1) |
|---|---|---|---|---|---|---|---|
a PC-KOH![[thin space (1/6-em)]](https://www.rsc.org/images/entities/char_2009.gif) : :![[thin space (1/6-em)]](https://www.rsc.org/images/entities/char_2009.gif) precursor ratio. All SPC samples were activated at 700 °C.
b Determined by XPS.
c Purchased from Mallinckrodt Chemical Works.
d Purchased from Calgon Carbon Corp. Total pore volumes are measured at P/P0 ∼ 0.99. precursor ratio. All SPC samples were activated at 700 °C.
b Determined by XPS.
c Purchased from Mallinckrodt Chemical Works.
d Purchased from Calgon Carbon Corp. Total pore volumes are measured at P/P0 ∼ 0.99.
|
|||||||
| Act. charcoalc | 94.10 | 5.90 | 0.00 | 845 | 0.47 | 8.45 | 372 |
| BPLd | 91.30 | 8.70 | 0.00 | 951 | 0.53 | 8.66 | 381 |
| SPC-1 | 76.96 | 14.30 | 8.74 | 1680 | 0.98 | 14.68 | 646 |
| SPC-2 | 78.89 | 13.73 | 7.37 | 2180 | 1.22 | 19.18 | 844 |
| SPC-3 | 85.53 | 13.70 | 0.77 | 2675 | 1.51 | 22.64 | 996 |
| SPC-4 | 84.63 | 15.37 | 0.00 | 2860 | 1.66 | 21.82 | 960 |
| SPC-5 | 84.38 | 15.62 | 0.00 | 2980 | 1.76 | 21.29 | 937 |
| PTh | 61.45 | 5.39 | 29.49 | 40 | 0.02 | 2.40 | 106 |
2.2. Synthesis of the S-containing polymer precursor (PTh)
The polymer precursor was prepared by a modification of previously reported protocols.18 A solution of 2-thiophenemethanol (5 g, Sigma Aldrich, 98% purity) mixed with CH3CN (20 mL) was slowly added to a solution of FeCl3 (25 g) in CH3CN (200 mL). The mixture was stirred for 2 h under continuous Ar purging. The brown polythiophene (PTh) was separated by filtration, washed with DI water (4 L) and acetone (1 L), and dried at 60 °C for 12 h under vacuum (yield = 98%).2.3. Conversion of PTh to S-containing porous carbon (SPC)
In a typical activation process, PTh (500 mg) was thoroughly mixed with KOH powder (crushed previously) in a mortar for 10 min with the KOH![[thin space (1/6-em)]](https://www.rsc.org/images/entities/char_2009.gif) :
:![[thin space (1/6-em)]](https://www.rsc.org/images/entities/char_2009.gif) PTh weight ratio varied from 1 to 5. The mixture was then placed inside a quartz tube/tube furnace, dried for 10 min and then heated for 1 h at a stable temperature of 700 °C, under a flow of Ar (99.9%, flow rate 600 sccm). The activated samples were then washed with DI water, HCl (100 mL, 1.4 M) to remove the excess inorganic salt residue and DI water until the filtrate attained pH = 7. The product was dried at 80 °C for 12 h under vacuum.
PTh weight ratio varied from 1 to 5. The mixture was then placed inside a quartz tube/tube furnace, dried for 10 min and then heated for 1 h at a stable temperature of 700 °C, under a flow of Ar (99.9%, flow rate 600 sccm). The activated samples were then washed with DI water, HCl (100 mL, 1.4 M) to remove the excess inorganic salt residue and DI water until the filtrate attained pH = 7. The product was dried at 80 °C for 12 h under vacuum.
2.4. CO2 and CH4 uptake measurements
The volumetric uptake measurements (pressure dependent excess isotherms) of CO2 and CH4 were performed on an automated Sievert instrument (Setaram PCTPRO).14 Various SPC samples were first crushed into powders and packed in a stainless steel autoclave sample cell. Initial sample pre-treatment was carried out at 130 °C for 1.5 h under high vacuum. The free volume inside the sample cell was determined by a series of calibration procedures done under helium. Gas uptake experiments were carried out with high purity research grade CO2 (99.99% purity, Matheson TRIGAS) and CH4 (99.9% purity). A summary of selected results is given in Table 1.3. Results and discussion
The polymer precursor we selected for the synthesis of activated sulphur containing porous carbon (SPC) sorbents was poly[2-thiophenemethanol] (PTh) synthesized by reaction with FeCl3 following the protocol reported elsewhere.18 This polymer was further activated using a strong oxidant, KOH, at a fixed temperature under an inert atmosphere. In general, the optimization procedure for the synthesis of a PC sorbent with a high surface area, from a polymer precursor activated using KOH, depends on two major parameters, namely, finding the right KOH to PTh weight ratio and, the second, identifying the correct temperature of activation that gives satisfactory porosity and yield. Earlier reports suggest that the porosity of a SPC sorbent increased with activation temperature.18 However, the final yield of the activated product decreases significantly with activation temperature above 700 °C. Additionally, previous reports suggest that the overall porosity and the surface area of a chemically activated PC material increase with KOH concentration.18 We, therefore, synthesized a set of SPC samples activated at a fixed activation temperature with gradually increasing KOH![[thin space (1/6-em)]](https://www.rsc.org/images/entities/char_2009.gif) :
:![[thin space (1/6-em)]](https://www.rsc.org/images/entities/char_2009.gif) PTh ratio r, where r varies from 1 to 5. These samples are labelled SPC-r (Table 1).
PTh ratio r, where r varies from 1 to 5. These samples are labelled SPC-r (Table 1).
The structural and textural morphology of the synthesized PTh and activated SPC samples was characterized by scanning electron microscopy (SEM). The precursor demonstrated a more rigid rock-like blunt texture (Fig. 1a), while the SEM image of a SPC-2 sample (Fig. 1b) exhibits a texture full of micron-sized holes, and multiple corners and edges that are absent in the precursor. Energy dispersive X-ray spectroscopy (EDS) confirmed that the SPCs are primarily composed of carbon, oxygen and sulphur.
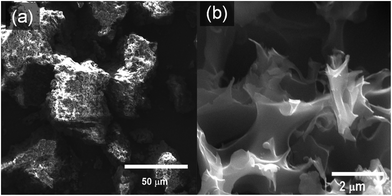 | ||
| Fig. 1 Scanning electron microscope (SEM) images of (a) the polymer precursor (PTh) and (b) a SPC-2 sample. | ||
3.1. CO2 uptake
The volumetric CO2 excess uptake (mmol of adsorbed CO2 per g of sample) measurements for the SPC sorbent specimens activated at 700 °C with different KOH![[thin space (1/6-em)]](https://www.rsc.org/images/entities/char_2009.gif) :
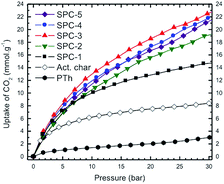
:![[thin space (1/6-em)]](https://www.rsc.org/images/entities/char_2009.gif) PTh weight ratios are shown in Fig. 2 as a function of adsorbate pressure for the labelled SPC specimens, PTh and commercial charcoal powders (Mallinckrodt Chemical Works). In this set of isotherms, the C-precursor PTh adsorbed the least amount of CO2 and the SPC-1 specimen demonstrated twice as much CO2 adsorption as activated charcoal at 30 bar. The difference in the shape of the uptake isotherms confirms that gas uptake strongly depends on the KOH
PTh weight ratios are shown in Fig. 2 as a function of adsorbate pressure for the labelled SPC specimens, PTh and commercial charcoal powders (Mallinckrodt Chemical Works). In this set of isotherms, the C-precursor PTh adsorbed the least amount of CO2 and the SPC-1 specimen demonstrated twice as much CO2 adsorption as activated charcoal at 30 bar. The difference in the shape of the uptake isotherms confirms that gas uptake strongly depends on the KOH![[thin space (1/6-em)]](https://www.rsc.org/images/entities/char_2009.gif) :
:![[thin space (1/6-em)]](https://www.rsc.org/images/entities/char_2009.gif) PTh weight ratio (r), i.e., the higher the value of r, the greater the uptake amount for a specific adsorbate pressure >12 bar up to r = 3. Interestingly, the SPC-4 and SPC-5 samples captured less CO2 than SPC-3. The reproducibility of both the synthesis and the measurements is shown by a comparison of the volumetric CO2 excess uptake of two batches of SPC-4 (Fig. 3).
PTh weight ratio (r), i.e., the higher the value of r, the greater the uptake amount for a specific adsorbate pressure >12 bar up to r = 3. Interestingly, the SPC-4 and SPC-5 samples captured less CO2 than SPC-3. The reproducibility of both the synthesis and the measurements is shown by a comparison of the volumetric CO2 excess uptake of two batches of SPC-4 (Fig. 3).
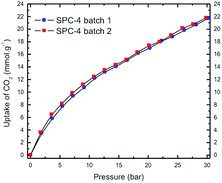 | ||
| Fig. 3 High pressure volumetric CO2 uptake as a function of CO2 pressure for two batches of SPC-4 activated at 700 °C. Uptake measurements were performed at 24 °C. | ||
Additional information on the dependence of gas uptake amounts at a specific pressure on the KOH![[thin space (1/6-em)]](https://www.rsc.org/images/entities/char_2009.gif) :
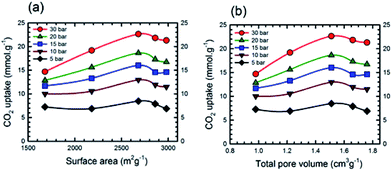
:![[thin space (1/6-em)]](https://www.rsc.org/images/entities/char_2009.gif) PTh weight ratio is presented in Fig. 4. The CO2 capture capacity increased from r = 1 to 3 and then decreased at higher r values. Previous low pressure study (1 bar) results for KOH activation of petroleum coke show that the KOH ratios of 3 and 4 show similar results.27 Conventional wisdom would suggest that the decreased uptake for SPC-4 and SPC-5 would be the consequence of a decreased surface area and/or pore volume. However, as may be seen from Fig. 5 this is not true. Instead, above a surface area value of 2675 m2 g−1 and a total pore volume of 1.51 cm3 g−1 the gas uptake began to drop. This indicates that there are other factors besides the surface area and pore volume that influence the CO2 uptake capacity of a specific SPC sample.
PTh weight ratio is presented in Fig. 4. The CO2 capture capacity increased from r = 1 to 3 and then decreased at higher r values. Previous low pressure study (1 bar) results for KOH activation of petroleum coke show that the KOH ratios of 3 and 4 show similar results.27 Conventional wisdom would suggest that the decreased uptake for SPC-4 and SPC-5 would be the consequence of a decreased surface area and/or pore volume. However, as may be seen from Fig. 5 this is not true. Instead, above a surface area value of 2675 m2 g−1 and a total pore volume of 1.51 cm3 g−1 the gas uptake began to drop. This indicates that there are other factors besides the surface area and pore volume that influence the CO2 uptake capacity of a specific SPC sample.
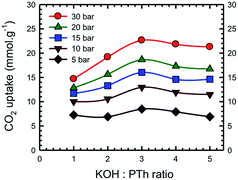 | ||
Fig. 4 Dependence of CO2 uptake at the labelled pressure on the KOH![[thin space (1/6-em)]](https://www.rsc.org/images/entities/char_2009.gif) : :![[thin space (1/6-em)]](https://www.rsc.org/images/entities/char_2009.gif) PTh ratio for the activated SPC-r samples activated at 700 °C. Experiments were performed at 24 °C. PTh ratio for the activated SPC-r samples activated at 700 °C. Experiments were performed at 24 °C. | ||
The chemical composition of the SPCs activated with different amounts of KOH was determined by X-ray photoelectron spectroscopy (XPS) and compared with that of PTh and commercial activated carbons. We note that XPS only provides the surface (and near surface) chemical composition that may differ from bulk chemical composition; however, surface composition is what matters in a surface adsorption process. It should also be noted that the H content is not provided by XPS data, and so percentage values measured by other techniques will vary. The wt% of elements present as determined by XPS survey scans is presented in Table 1. The PTh and consequently the SPC-r samples were primarily composed of C, O, and S and chemical activation by increasing the amount of KOH gradually changed the wt% of all three elements. Fig. 6 depicts these changes.
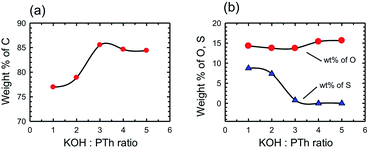 | ||
Fig. 6 Chemical composition of the activated SPC samples by XPS spectroscopy showing the wt% of elemental (a) carbon and (b) oxygen and sulphur versus the KOH![[thin space (1/6-em)]](https://www.rsc.org/images/entities/char_2009.gif) : :![[thin space (1/6-em)]](https://www.rsc.org/images/entities/char_2009.gif) PTh ratio. PTh ratio. | ||
We have previously determined that for a wide range of PCs the maximum CO2 uptake occurs when the C composition (as determined by XPS) is in the range of 80–95 wt%.16 In the present case this range may be further specified as being >85%. However, the most important observation is that the trend observed in Fig. 6 is essentially the same as that in Fig. 4, i.e. the CO2 uptake increases with C% (Fig. 7), rather than the expected relationship with the surface area or pore volume.
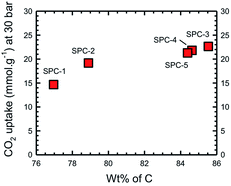 | ||
| Fig. 7 Dependence of CO2 uptake of the activated SPC samples as a function of carbon composition as determined by XPS spectroscopy. | ||
By consideration of the change in the S content with increasing KOH![[thin space (1/6-em)]](https://www.rsc.org/images/entities/char_2009.gif) :
:![[thin space (1/6-em)]](https://www.rsc.org/images/entities/char_2009.gif) PTh ratio it is clear that the loss of the majority of S correlates with the formation of PC samples with the highest CO2 uptake (c.f.Fig. 4 and 6b). However, replacement of S with O (at high KOH
PTh ratio it is clear that the loss of the majority of S correlates with the formation of PC samples with the highest CO2 uptake (c.f.Fig. 4 and 6b). However, replacement of S with O (at high KOH![[thin space (1/6-em)]](https://www.rsc.org/images/entities/char_2009.gif) :
:![[thin space (1/6-em)]](https://www.rsc.org/images/entities/char_2009.gif) PTh ratios) decreases the CO2 uptake. Clearly, there is some significant physical change that occurs in these two regimes. In order to determine if there are distinct structural features that are associated with the C% and hence CO2 uptake we have determined the pore structure changes that occur with changing KOH
PTh ratios) decreases the CO2 uptake. Clearly, there is some significant physical change that occurs in these two regimes. In order to determine if there are distinct structural features that are associated with the C% and hence CO2 uptake we have determined the pore structure changes that occur with changing KOH![[thin space (1/6-em)]](https://www.rsc.org/images/entities/char_2009.gif) :
:![[thin space (1/6-em)]](https://www.rsc.org/images/entities/char_2009.gif) PTh ratio.
PTh ratio.
The surface area, total pore volume and pore size distribution of the SPC samples activated with different KOH![[thin space (1/6-em)]](https://www.rsc.org/images/entities/char_2009.gif) :
:![[thin space (1/6-em)]](https://www.rsc.org/images/entities/char_2009.gif) PTh ratios were determined by measuring low temperature (77 K) N2 adsorption isotherms on a BET (Brunauer–Emmett–Teller) surface area analyser. Fig. 8 shows such a set of isotherms of five SPC-r samples activated at 700 °C. Here, KOH
PTh ratios were determined by measuring low temperature (77 K) N2 adsorption isotherms on a BET (Brunauer–Emmett–Teller) surface area analyser. Fig. 8 shows such a set of isotherms of five SPC-r samples activated at 700 °C. Here, KOH![[thin space (1/6-em)]](https://www.rsc.org/images/entities/char_2009.gif) :
:![[thin space (1/6-em)]](https://www.rsc.org/images/entities/char_2009.gif) PTh ratio dependent differences in the shape of these isotherms were noticed; the isotherms of SPC-3 to SPC-5 are much steeper than those of SPC-1 or SPC-2 in the relative pressure range of 0.05–0.3, indicating rapid increase of the surface area and adsorption capacity with higher amounts of KOH.
PTh ratio dependent differences in the shape of these isotherms were noticed; the isotherms of SPC-3 to SPC-5 are much steeper than those of SPC-1 or SPC-2 in the relative pressure range of 0.05–0.3, indicating rapid increase of the surface area and adsorption capacity with higher amounts of KOH.
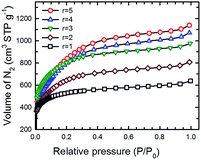 | ||
Fig. 8 N2 adsorption isotherms (measured at 77 K) of five different SPC samples activated at 700 °C with the KOH![[thin space (1/6-em)]](https://www.rsc.org/images/entities/char_2009.gif) : :![[thin space (1/6-em)]](https://www.rsc.org/images/entities/char_2009.gif) PTh ratio varied from 1 to 5. PTh ratio varied from 1 to 5. | ||
The estimated surface area (SBET) and the total pore volume (Vp) gradually increased with activation temperature (Fig. 9a and b, respectively) describing the incremental trend from mild to strong activation conditions. As expected based upon conventional wisdom the surface area increases with increasing KOH![[thin space (1/6-em)]](https://www.rsc.org/images/entities/char_2009.gif) :
:![[thin space (1/6-em)]](https://www.rsc.org/images/entities/char_2009.gif) PTh ratio, although there is a change in the relationship above KOH
PTh ratio, although there is a change in the relationship above KOH![[thin space (1/6-em)]](https://www.rsc.org/images/entities/char_2009.gif) :
:![[thin space (1/6-em)]](https://www.rsc.org/images/entities/char_2009.gif) PTh = 3. A similar trend is observed for the total pore volume (Fig. 9b), and the two show a near linear relationship. These demonstrate the strong influence of KOH on the porous properties of the activated samples.
PTh = 3. A similar trend is observed for the total pore volume (Fig. 9b), and the two show a near linear relationship. These demonstrate the strong influence of KOH on the porous properties of the activated samples.
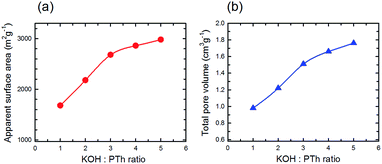 | ||
Fig. 9 Estimated surface area (a) and total pore volume (b) versus the KOH![[thin space (1/6-em)]](https://www.rsc.org/images/entities/char_2009.gif) : :![[thin space (1/6-em)]](https://www.rsc.org/images/entities/char_2009.gif) PTh ratio for five different SPC samples activated at 700 °C. PTh ratio for five different SPC samples activated at 700 °C. | ||
One key piece of information that can be obtained from the BET surface area analysis is the pore size distribution as a function of pore sizes of a specific porous solid. Fig. 10 plots the pore size distribution as a function of pore size for a set of five SPCs activated under mild (KOH![[thin space (1/6-em)]](https://www.rsc.org/images/entities/char_2009.gif) :
:![[thin space (1/6-em)]](https://www.rsc.org/images/entities/char_2009.gif) PTh = 1) to strong (KOH
PTh = 1) to strong (KOH![[thin space (1/6-em)]](https://www.rsc.org/images/entities/char_2009.gif) :
:![[thin space (1/6-em)]](https://www.rsc.org/images/entities/char_2009.gif) PTh = 5) activation conditions. These plots show that the SPC-1 sample primarily contains pores narrower than ∼2 nm. As the KOH amount increases wider pores began to form as evidenced by the PSD plot of SPC-2. The samples activated with a minimal amount of KOH (i.e., SPC-1) contained pores in the range of 1–3 nm. In contrast, the distribution plots of SPC-4 and SPC-5 indicate that chemical activation with large amounts of KOH created some additional mesopores in the 3–4.5 nm range. The SPC-5 sample even contained pores larger than 4 nm. Confirmation of the pore sizes is obtained from high resolution transmission electron microscopy (HRTEM). For example, Fig. 11 displays an image of SPC-2, demonstrating randomly distributed micropores with dimensions in the range of 1–2 nm.
PTh = 5) activation conditions. These plots show that the SPC-1 sample primarily contains pores narrower than ∼2 nm. As the KOH amount increases wider pores began to form as evidenced by the PSD plot of SPC-2. The samples activated with a minimal amount of KOH (i.e., SPC-1) contained pores in the range of 1–3 nm. In contrast, the distribution plots of SPC-4 and SPC-5 indicate that chemical activation with large amounts of KOH created some additional mesopores in the 3–4.5 nm range. The SPC-5 sample even contained pores larger than 4 nm. Confirmation of the pore sizes is obtained from high resolution transmission electron microscopy (HRTEM). For example, Fig. 11 displays an image of SPC-2, demonstrating randomly distributed micropores with dimensions in the range of 1–2 nm.
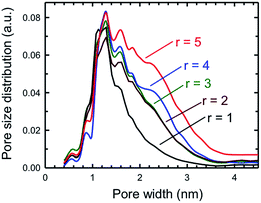 | ||
| Fig. 10 Pore size distributions of the same samples as determined by the NLDFT method for five different SPC-r samples activated at 700 °C. | ||
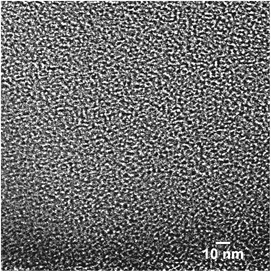 | ||
| Fig. 11 High resolution transmission electron microscope (HRTEM) image of a SPC-2 sample. Scale bar = 10 nm. | ||
It is clear from Fig. 9b that the total pore volumes (sum of pore volumes of narrower micro- (<1 nm), micro-, meso- and macro-sized pores) systematically increase with the KOH![[thin space (1/6-em)]](https://www.rsc.org/images/entities/char_2009.gif) :
:![[thin space (1/6-em)]](https://www.rsc.org/images/entities/char_2009.gif) PTh ratio and volume change behaves differently for different sizes of pores. The micro- and meso-porosity analysis of these samples was performed by the t-plot method26 and revealed interesting pore volume dependencies on KOH amounts (Table 2).
PTh ratio and volume change behaves differently for different sizes of pores. The micro- and meso-porosity analysis of these samples was performed by the t-plot method26 and revealed interesting pore volume dependencies on KOH amounts (Table 2).
| Samplea | V MICRO (0–2 nm) (cm3 g−1) | V NARROW (0–1 nm) (cm3 g−1) | V i (1–2 nm) (cm3 g−1) | V MESO (2–50 nm) (cm3 g−1) | V MACRO (>50 nm) (cm3 g−1) |
|---|---|---|---|---|---|
a PC-KOH![[thin space (1/6-em)]](https://www.rsc.org/images/entities/char_2009.gif) : :![[thin space (1/6-em)]](https://www.rsc.org/images/entities/char_2009.gif) precursor ratio. All SPC samples were activated at 700 °C.
b Purchased from Mallinckrodt Chemical Works.
c Purchased from Calgon Carbon Corp. Micropore volumes are determined by the t-plot method. Micropores include pores between 0.4 and 2 nm. Within parentheses, % of the total pore volume is shown. precursor ratio. All SPC samples were activated at 700 °C.
b Purchased from Mallinckrodt Chemical Works.
c Purchased from Calgon Carbon Corp. Micropore volumes are determined by the t-plot method. Micropores include pores between 0.4 and 2 nm. Within parentheses, % of the total pore volume is shown.
|
|||||
| Act. charcoalb | 0.32 | 0.11 (23%) | 0.21 (45%) | 0.11 (24%) | 0.04 (8%) |
| BPLc | 0.38 | 0.13 (25%) | 0.25 (47%) | 0.12 (23%) | 0.03 (5%) |
| SPC-1 | 0.71 | 0.19 (19%) | 0.52 (54%) | 0.18 (18%) | 0.09 (9%) |
| SPC-2 | 0.76 | 0.16 (13%) | 0.60 (49%) | 0.35 (29%) | 0.11 (9%) |
| SPC-3 | 1.01 | 0.18 (12%) | 0.83 (55%) | 0.38 (25%) | 0.12 (8%) |
| SPC-4 | 0.87 | 0.16 (10%) | 0.71 (43%) | 0.64 (38%) | 0.15 (9%) |
| SPC-5 | 0.88 | 0.10 (6%) | 0.78 (44%) | 0.72 (41%) | 0.16 (9%) |
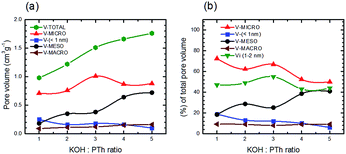
Fig. 12 depicts absolute volumes and the percentage of the total pore volume for a set of five SPC samples as a function of the KOH![[thin space (1/6-em)]](https://www.rsc.org/images/entities/char_2009.gif) :
:![[thin space (1/6-em)]](https://www.rsc.org/images/entities/char_2009.gif) PTh ratio. In contrast to total pore volumes (Fig. 9b) the relative pore composition of micropores (defined as <2 nm) shows a marked increase with increasing KOH
PTh ratio. In contrast to total pore volumes (Fig. 9b) the relative pore composition of micropores (defined as <2 nm) shows a marked increase with increasing KOH![[thin space (1/6-em)]](https://www.rsc.org/images/entities/char_2009.gif) :
:![[thin space (1/6-em)]](https://www.rsc.org/images/entities/char_2009.gif) PTh ratio until SPC-3; above this the fraction of the total pore volume associated with these size regimes decreases (Fig. 12a). The mesopore composition shows the obverse trend. Interestingly, the micropore volumes show the strongest dependence on KOH.
PTh ratio until SPC-3; above this the fraction of the total pore volume associated with these size regimes decreases (Fig. 12a). The mesopore composition shows the obverse trend. Interestingly, the micropore volumes show the strongest dependence on KOH.
The relationship between the relative composition of the various pore sizes and the CO2 uptake is shown in Fig. S4.† It clearly shows that in order to maximise CO2 uptake, activation conditions (in this case the KOH![[thin space (1/6-em)]](https://www.rsc.org/images/entities/char_2009.gif) :
:![[thin space (1/6-em)]](https://www.rsc.org/images/entities/char_2009.gif) PTh ratio) should be chosen to maximise the relatively narrower micro- and micro-pores (especially those between 1–2 nm) rather than maximizing surface area or pore volume. A comparison of Fig. 12b with Fig. 6a suggests that narrower micropore formation is associated with the increased C content; however, mesopore formation appears to be controlled by the increased O content.
PTh ratio) should be chosen to maximise the relatively narrower micro- and micro-pores (especially those between 1–2 nm) rather than maximizing surface area or pore volume. A comparison of Fig. 12b with Fig. 6a suggests that narrower micropore formation is associated with the increased C content; however, mesopore formation appears to be controlled by the increased O content.
Previous work with carbide-derived carbons (CDCs) and PCs (at 1 bar) suggests that it is the pore volume less that 1 nm that is important.27–32 In contrast, it has also been suggested that mesopores (>2 nm) are the most important.27,33 There has also been a proposal that the important gas uptake selectivity depends on the pressure used.27 Our results clearly show that at higher pressures (>10 bar) it is a larger set (1–2 nm) that controls the uptake.
3.2. CO2/CH4 selectivity
The selective removal of CO2 from natural gas, which essentially contains CH4 and other gases such as CO2, H2S, and N2, is one of the important industrial research goals, because these contaminant gases decrease the power efficiency of natural gas. Thus, we have been directed to explore the selective CO2 capture capacity of different carbon-based porous sorbents at different gas pressures and temperatures.16 To be an ideal sorbent for the selective removal of CO2 from natural gas, the sorbent should demonstrate significantly lower CH4 uptake than CO2 uptake. In order to compare the high pressure CH4 uptake capacities of the five SPC samples with their CO2 uptakes, we measured the room temperature volumetric CH4 uptake of the same set of samples under similar conditions.
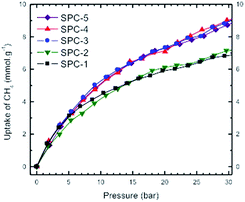
Fig. 13 represents a set of such uptake isotherms. In contrast to the CO2 uptake isotherms, we see two distinct set of isotherms; one set comprises SPC-1 and SPC-2 and the other comprises SPC-3, 4, and 5. This feature is further demonstrated by a set of plots showing the dependence of CH4 uptake on the KOH![[thin space (1/6-em)]](https://www.rsc.org/images/entities/char_2009.gif) :
:![[thin space (1/6-em)]](https://www.rsc.org/images/entities/char_2009.gif) PTh weight ratio of the corresponding sorbent at a specific capture pressure (Fig. 14). For example, at 30 bar, there was negligible difference in the CH4 uptakes of all three samples SPC-3 to 5 (∼9 mmol g−1) suggesting that the amount of KOH had a much weaker effect on the CH4 uptake properties relative to CO2 uptake, though the surface area and porosity had changed significantly.
PTh weight ratio of the corresponding sorbent at a specific capture pressure (Fig. 14). For example, at 30 bar, there was negligible difference in the CH4 uptakes of all three samples SPC-3 to 5 (∼9 mmol g−1) suggesting that the amount of KOH had a much weaker effect on the CH4 uptake properties relative to CO2 uptake, though the surface area and porosity had changed significantly.
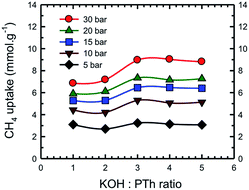 | ||
Fig. 14 Dependence of CH4 uptake at the labeled pressure on the KOH![[thin space (1/6-em)]](https://www.rsc.org/images/entities/char_2009.gif) : :![[thin space (1/6-em)]](https://www.rsc.org/images/entities/char_2009.gif) PTh ratio of the activated SPC samples. Experiments were performed at 24 °C. PTh ratio of the activated SPC samples. Experiments were performed at 24 °C. | ||
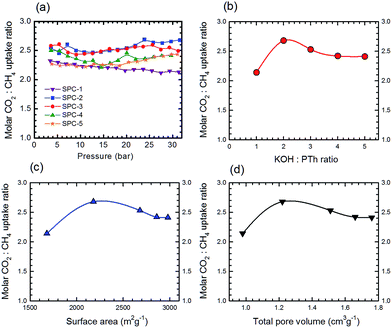
From the data for CO2 and CH4 (Table S2†), the molar uptake selectivity (molar CO2![[thin space (1/6-em)]](https://www.rsc.org/images/entities/char_2009.gif) :
:![[thin space (1/6-em)]](https://www.rsc.org/images/entities/char_2009.gif) CH4 uptake ratio) of the SPC samples as a function of gas pressure is shown in Fig. 15a. The selectivity traces for SPC-1 to SPC-3 varied smoothly between 10 and 30 bar. The dependence of high pressure selectivity at 30 bar on the KOH
CH4 uptake ratio) of the SPC samples as a function of gas pressure is shown in Fig. 15a. The selectivity traces for SPC-1 to SPC-3 varied smoothly between 10 and 30 bar. The dependence of high pressure selectivity at 30 bar on the KOH![[thin space (1/6-em)]](https://www.rsc.org/images/entities/char_2009.gif) :
:![[thin space (1/6-em)]](https://www.rsc.org/images/entities/char_2009.gif) PTh ratio, surface area and total pore volume of the corresponding SPCs is presented in Fig. 15b–d, respectively. Surprisingly, the SPC-2 sample (with surface area = 2180 m2 g−1 and total pore volume = 1.22 cm3 g−1) demonstrated the highest molar selectivity (2.68) at 30 bar, though SPC-3 exhibited the highest CO2 uptake.
PTh ratio, surface area and total pore volume of the corresponding SPCs is presented in Fig. 15b–d, respectively. Surprisingly, the SPC-2 sample (with surface area = 2180 m2 g−1 and total pore volume = 1.22 cm3 g−1) demonstrated the highest molar selectivity (2.68) at 30 bar, though SPC-3 exhibited the highest CO2 uptake.
The shift from a KOH![[thin space (1/6-em)]](https://www.rsc.org/images/entities/char_2009.gif) :
:![[thin space (1/6-em)]](https://www.rsc.org/images/entities/char_2009.gif) PTh ratio of 3 to 2 for optimum uptake selectivity as opposed to uptake of both CO2 and CH4 is due to the relative shape of the uptake as a function of reagent ratios, c.f.Fig. 4 and 14. While the CO2 uptake increased uniformly with the KOH
PTh ratio of 3 to 2 for optimum uptake selectivity as opposed to uptake of both CO2 and CH4 is due to the relative shape of the uptake as a function of reagent ratios, c.f.Fig. 4 and 14. While the CO2 uptake increased uniformly with the KOH![[thin space (1/6-em)]](https://www.rsc.org/images/entities/char_2009.gif) :
:![[thin space (1/6-em)]](https://www.rsc.org/images/entities/char_2009.gif) PTh ratio from 1 to 3, that for CH4 is a step function. This suggests that in determining optimum selectivity it is important to understand the variations between CO2 and CH4 adsorption rather than the maximum for both.
PTh ratio from 1 to 3, that for CH4 is a step function. This suggests that in determining optimum selectivity it is important to understand the variations between CO2 and CH4 adsorption rather than the maximum for both.
4. Conclusions
Our prior work has demonstrated that the best CO2 uptake and CO2/CH4 differentiation is obtained with a defined set of parameters involving the surface area, pore volume, and carbon content which are in turn a function of the polymer precursor and the process activation temperature.16 The present study extends this work and demonstrates that there is an optimum KOH![[thin space (1/6-em)]](https://www.rsc.org/images/entities/char_2009.gif) :
:![[thin space (1/6-em)]](https://www.rsc.org/images/entities/char_2009.gif) PTh ratio for activation of SPC. The ratio for optimum CO2 (and CH4) uptake is 3, which equates to SPC samples with a surface area and total pore volume of 2700 m2 g−1 and 1.5 cm3 g−1, respectively. In contrast, the ratio is 2 for the best CO2/CH4 differentiation, which produces a surface area of 2200 m2 g−1 and a total pore volume of 1.2 cm3 g−1. Once again, the conditions for one goal are different from the other.16
PTh ratio for activation of SPC. The ratio for optimum CO2 (and CH4) uptake is 3, which equates to SPC samples with a surface area and total pore volume of 2700 m2 g−1 and 1.5 cm3 g−1, respectively. In contrast, the ratio is 2 for the best CO2/CH4 differentiation, which produces a surface area of 2200 m2 g−1 and a total pore volume of 1.2 cm3 g−1. Once again, the conditions for one goal are different from the other.16
More importantly, the optimum CO2 uptake is not for a material with the highest pore volume or surface area, but for the material with SBET > 2000 m2 g−1 and the highest percentage of narrower micro- (<1 nm) and micro- (<2 nm) pores as compared to meso-pores (>2 nm). Increasing the latter type of pore does increase both the surface area and pore volume, but not the CO2 uptake. Previous work by Zhang et al. has suggested that the most important criterion for designing N-doped PC sorbents for CO2 is that the adsorbents should be primarily rich in extremely small micropores.34 Thus, future studies should be aimed at designing the pore structure rather than seeking higher and higher surface area and pore volume materials.
Acknowledgements
Financial support was provided by Apache Corporation, the Welsh Government Sêr Cymru Programme and the Robert A. Welch Foundation (C-0002). We gratefully thank Dr Bruce Brinson, Dr Gedeng Ruan, Ethan, Carter Kittrell, and Dr Almaz Jalilov for technical and instrumental assistance. The authors declare no conflict of interest.Notes and references
- J. Olivier and G. Janssens-Maenhout, CO2 Emissions from Fuel Combustion-Highlights, International Energy Agency, Paris, France, 2012 Search PubMed.
- Carbon Dioxide Capture and Storage, ed. B. Metz, H. de Coninck, M. Loos and L. Meyer, Intergovernamental Panel on Climate Change, Cambridge University Press, 2005 Search PubMed.
- M. Z. Jacobson, Energy Environ. Sci., 2009, 2, 148–173 CAS.
- T. E. Rufford, S. Smart, G. C. Y. Watson, B. F. Graham, J. Boxall, J. C. Diniz da Costa and E. F. May, J. Pet. Sci. Eng., 2012, 94–95, 123–154 CrossRef CAS.
- Z. Y. Yeo, T. L. Chew, P. W. Zhu, A. R. Mohamed and S. P. Chai, J. Nat. Gas Chem., 2012, 21, 282–298 CrossRef CAS.
- A. Bahadori, S. Mokhatab and B. F. Towler, J. Nat. Gas Chem., 2007, 16, 349–353 CrossRef CAS.
- A. B. Rao and E. S. Rubin, Environ. Sci. Technol., 2002, 36, 4467–4475 CrossRef CAS PubMed.
- J. R. Li, Y. Ma, M. C. McCarthy, J. Sculley, J. Yu, H. K. Jeong, P. B. Balbuena and H. C. Zhou, Coord. Chem. Rev., 2011, 255, 1791–1823 CrossRef CAS.
- S. Araki, H. Doi, Y. Sano, S. Tanaka and Y. Miyake, J. Colloid Interface Sci., 2009, 339, 382–389 CrossRef CAS PubMed.
- R. E. Morris and P. S. Wheatley, Angew. Chem., Int. Ed., 2008, 47, 4966–4981 CrossRef CAS PubMed.
- S. Choi, J. H. Drese and C. W. Jones, ChemSusChem, 2009, 2, 796–854 CrossRef CAS PubMed.
- E. Andreoli, E. P. Dillon, L. Cullum, L. B. Alemany and A. R. Barron, Sci. Rep., 2014, 4, 7304, DOI:10.1038/srep07304.
- E. Andreoli and A. R. Barron, ChemSusChem, 2015, 8, 2635–2644 CrossRef CAS PubMed.
- E. Andreoli and A. R. Barron, Energy Fuels, 2015, 29, 4479–4487 CrossRef CAS.
- M. Sevilla and A. B. Fuertes, Energy Environ. Sci., 2011, 4, 1765–1771 CAS.
- S. Ghosh, M. Sevilla, A. B. Fuertes, E. Andreoli, J. Ho and A. R. Barron, J. Mater. Chem. A, 2016, 4, 14739–14751 CAS.
- M. Sevilla, P. Valle-Vigón and A. B. Fuertes, Adv. Funct. Mater., 2011, 21, 2781–2787 CrossRef CAS.
- M. Sevilla and A. B. Fuertes, Microporous Mesoporous Mater., 2012, 158, 318–323 CrossRef CAS.
- M. A. Lillo-Ródenas, D. Cazorla-Amorós and A. Linares-Solano, Carbon, 2003, 41, 267–275 CrossRef.
- F. Caturla, M. Molina-Sabio and F. Rodriguez-Reinoso, Carbon, 1991, 29, 999–1007 CrossRef CAS.
- M. Molina-Sabio and F. Rodriguez-Reinoso, Colloids Surf., A, 2004, 241, 15–25 CrossRef CAS.
- S. Ghosh and A. R. Barron, C, 2016, 2, 5, DOI:10.3390/c2010005.
- A. N. Wennerberg and T. M. O'Grady, US Pat., 4082694, 1978.
- M. Sevilla, J. B. Parra and A. B. Fuertes, ACS Appl. Mater. Interfaces, 2013, 5, 6360–6368 CAS.
- A. S. Jalilov, G. Ruan, C. C. Hwang, D. E. Schipper, J. J. Tour, Y. Li, H. Fei, E. L. G. Samuel and J. M. Tour, ACS Appl. Mater. Interfaces, 2015, 7, 1376–1382 CAS.
- S. Storck, H. Bretinger and W. F. Maier, Appl. Catal., A, 1998, 174, 137–146 CrossRef CAS.
- X. Hu, M. Radosz, K. A. Cychosz and M. Thommes, Environ. Sci. Technol., 2011, 45, 7068–7074 CrossRef CAS PubMed.
- V. Presser, J. McDonough, S.-H. Yeon and Y. Gogotsi, Energy Environ. Sci., 2011, 4, 3059–3066 CAS.
- L. K. C. de Souza, N. P. Wickramaratne, A. S. Ello, M. J. F. Cost, C. E. F. da Costa and M. Jaroniec, Carbon, 2013, 5, 334–340 CrossRef.
- D. Qian, C. Lei, E.-M. Wang, W.-C. Li and A.-H. Lu, ChemSusChem, 2014, 7, 291–298 CrossRef CAS PubMed.
- N. P. Wickramaratne and M. Jaroniec, J. Mater. Chem. A, 2013, 1, 112–116 CAS.
- N. P. Wickramaratne and M. Jaroniec, ACS Appl. Mater. Interfaces, 2013, 5, 1849–1855 CAS.
- G. Dura, V. L. Budarin, J. A. Castro-Osma, P. S. Shuttleworth, S. C. Z. Quek, J. H. Clark and M. North, Angew. Chem., Int. Ed., 2016, 55, 9173–9177 CrossRef CAS PubMed.
- Z. Zhang, J. Zhou, W. Xing, Q. Xue, Z. Yan, S. Zhuo and S. Z. Qiao, Phys. Chem. Chem. Phys., 2013, 15, 2523–2529 RSC.
Footnote |
| † Electronic supplementary information (ESI) available: Plots of volumetric CO2 uptake as a function of S and O contents, FTIR spectra, and XPS scans. See DOI: 10.1039/c6se00102e |
| This journal is © The Royal Society of Chemistry 2017 |

