Influence of La2O3 composition in MgO–La2O3 mixed oxide-supported Co catalysts on the hydrogen yield in glycerol steam reforming†
Received
26th October 2016
, Accepted 5th January 2017
First published on 23rd January 2017
Abstract
MgO–La2O3 mixed oxide (MLx) supports with varying La2O3 content (x = 1, 2, 3, 4, and 5 by wt) were synthesized by a co-precipitation method. A constant composition (20 wt%) of an active metal, cobalt, was loaded on MLx supports by the wet impregnation method. The physico-chemical properties of these solids were determined by BET surface area, ICP-OES, XRD, H2-TPR, CO2-TPD, FT-IR, H2-pulse chemisorption and CHN techniques. All the catalysts were evaluated for hydrogen production by vapor phase glycerol steam reforming at atmospheric pressure. Partial substitution of La in LaCoO3 with MgO has increased the reducibility of the perovskite, enhanced the dispersion of the active metal and played a vital role in carbon removal from the active site. The best catalytic activity with 100% glycerol conversion to gas products (H2, CO, CH4 and CO2) and a maximum hydrogen yield of 72.8% has been achieved for 20 wt% of the Co/1MgO![[thin space (1/6-em)]](https://www.rsc.org/images/entities/char_2009.gif) :
:![[thin space (1/6-em)]](https://www.rsc.org/images/entities/char_2009.gif) 3La2O3 catalyst at 700 °C. The catalyst activity also remained stable up to 35 h on stream analysis.
3La2O3 catalyst at 700 °C. The catalyst activity also remained stable up to 35 h on stream analysis.
1. Introduction
Hydrogen is emerging as the best source for the production of a high amount of energy during oxidation without leaving carbon footprints in the atmosphere. The importance of hydrogen in the energy sector has been increasing tremendously.1 Currently, hydrogen is produced mostly by steam reforming of natural gas, a non-renewable source. However, deriving hydrogen from biomass acquires importance because of the renewable nature of the feedstock. Among the biosources, glycerol has the economic advantage since it is produced in the biodiesel industry as a major byproduct (∼10 wt%) and available at a cheaper price. With the projections for biodiesel production touching 33 billion liters by 2020,2 the amount of glycerol availability will be plenty; while the other methods for the utilization of glycerol by small-scale industries require pure glycerol, steam reforming can take crude glycerol as the reactant. Thus, the reforming process is adjudged as a promising method for the generation of clean energy even from crude glycerol. Among the several methods available for the production of hydrogen from glycerol, aqueous phase reforming, partial oxidation and steam reforming are important. The efficiency of steam reforming is higher than the others and it enables the production of fuel-cell grade hydrogen. However, glycerol steam reforming is a complex process as it is accompanied by several reactions as stated below.| | | C3H8O3 + 3H2O → 7H2O + 3CO2, glycerol steam reforming | (i) |
| | | C3H8O3 → 4H2 + 3CO, direct decomposition | (ii) |
| | | 3CO + 3H2O → 3H2 + 3CO2, WGS reaction | (iii) |
| | | CO + 3H2 → CH4 + H2O, methanation | (iv) |
| | | 2CO → CO2 + C, Boudouard reaction | (v) |
Different catalysts have been reported for glycerol steam reforming (GSR). GSR, being an endothermic reaction demanding high temperature operation, places several restrictions on the selection of the catalyst. The active metal oxide should be easily reducible. The catalyst should exhibit high metal dispersion with a smaller particle size. Ni is the most commonly reported catalyst for this purpose. But under severe operating conditions, Ni is susceptible to coking and sintering preventing its commercial scale application. Cobalt, on the other hand, exhibits the capacity to cleave the C–C bond and its active sites are less prone to deactivation during the reforming reaction.3,4 In recent years, studies on Co-based catalysts have increased considerably. It has been reported that the GSR activity of the Co catalyst increases with the addition of promoters like Ru and alkali metals like Na.5 CeO2 addition also favors the reaction as it facilitates metal–support interactions.6
A support also plays a major role in improving the performance of GSR catalysts offering stability to the metal by decreasing the sintering phenomenon.7 Carbon formation is sensitive to the nature of the support. Co–Ni/Al2O3 is reported to suffer from carbon formation due to high concentration of the acidic sites.8 The deactivation of Ni/Al2O3 catalysts has been minimized by the addition of MgO.9 La2O3 has a crucial role in the development of Co and Ni-based catalysts, as it helps achieve better distribution of the active metal on the support. Decreasing coke formation is also affected by the addition of basic La2O3 to the supports. Viinikainen et al.10 and Fleys et al.11 reported that higher basicity limits carbon deposition and enhances catalyst stability.12 La2O3 also prevents sintering of the active metal catalyst. Cheng-xiong et al.13 reported the possible methods for the suppression of sintering of metallic Ni particles in the oxidative glycerol steam reforming to hydrogen. 2 wt% of La2O3 addition to Ni/Al2O3 is shown to greatly enhance the metal surface area of Ni.14 Similarly, MgO also improves the performance of reforming catalysts. The addition of 10 wt% MgO to the Ni–Sn/Al2O3 catalyst has resulted in the formation of MgAl2O4 spinels which helped restrict the incorporation of the Ni metal in Al2O3 and thereby accord high dispersion of Ni on the support. The addition of MgO to Ni/Al2O3 increases its basicity.15 A correlation between carbon formation and the basicity of the support is reported in the literature.16 Recently, Guo et al.,17 have reported that MgO is the best support for aqueous phase reforming in terms of minimization of carbon formation. Besides, the water activation property of MgO is found to be attractive for obtaining a high amount of hydrogen through the water gas shift (WGS) reaction. However, MgO has the disadvantage of plugging the reactor due to its low thermal stability. Thus, there is a strong need to improve the thermal stability of MgO-containing catalysts. Attempts have also been made to reduce the deactivation due to carbon formation by changing the structure of the catalysts. In this regard the adoption of perovskite type materials as precursors/catalysts for GSR has gained enormous importance. Perovskites are efficient in carbon removal from the active site by gasification using the lattice oxygen present in them.18
Considering all the points reported in the literature it would be prudent to design a catalyst that exists in the perovskite structure during preparation and includes Co3O4, La2O3 and MgO. In our previous study we found that La2O3 plays a vital role in controlling the metal surface area, particle size, metal dispersion as well as thermal stability of the catalyst.19 The addition of Pt to LaCoO3 enhanced the catalyst stability.20 In the present study, we have attempted to identify the influence of La2O3 composition in the MgO–La2O3 mixed oxide to be used as a support for the Co catalyst in maximizing the yield of hydrogen during the GSR reaction. The effect of change in the support composition on Co oxide reducibility, dispersion and the particle size of the active metal and finally the basicity of the catalyst has been investigated.
2. Experimental
2.1 Catalyst preparation (20 wt% Co/MgO–La2O3 (CMLx; x = 1, 2, 3, 4 and 5))
MgO–La2O3 mixed oxide supports with varying La2O3 composition (MgO/La2O3 = 1–5, by wt) were prepared initially by a co-precipitation method. The desired MgO/La2O3 ratio in the mixed oxides was obtained by dissolving pre-calculated amounts of the corresponding nitrates in distilled water. The mixed metal solution was precipitated at pH = 10 using ammonium hydroxide solution as the precipitating agent. The obtained precipitate was washed with distilled water to remove the excess base, was filtered and the solid was dried at 100 °C for 12 h. The obtained samples were ground in a mortar and subjected to calcination for 5 h at 750 °C. These supports were then used to load a constant amount of 20 wt% cobalt by the wet-impregnation method taking the required amount of cobalt nitrate hexahydrate dissolved in distilled water. The solution was kept on a hot plate to remove the excess amount of water by evaporation at 80 °C. The resulting solids were further oven-dried at 100 °C for 12 h and finally subjected to calcination at 750 °C for 5 h to obtain the final catalysts. The catalyst samples are designated as CMLx, where C stands for Co, M for MgO, L for La2O3 and x for the weight ratio of La2O3 to MgO.
2.2 Characterization techniques
BET surface areas were determined by N2 adsorption at liquid nitrogen temperature using a SMART SORB 92/93 instrument (M/s SMART Instruments, India). Prior to the measurement, the samples were dried at 150 °C for 2 h. Chemical analysis of the samples was carried out by inductively coupled plasma optical emission spectroscopy (ICP-OES) using a Varian 725 ES instrument. X-ray diffraction (XRD) patterns of the catalysts were obtained on an Ultima-IV diffractometer (M/s Rigaku Corporation, Japan) using nickel-filtered Cu Kα radiation (λ = 1.54 Å). The nature of the phase in the sample was checked using the database of the Joint Committee on Powder Diffraction Standards (JCPDS). An XRD study was also carried out on the reduced catalysts to investigate the structural changes during reduction. The catalysts were reduced with H2 (30 mL min−1) at 650 °C/5 h, cooled to the room temperature and passivated in a N2 flow, before the analysis. Temperature-programmed reduction (TPR) of the sample was performed in a flow of a 5% H2/Ar gas mixture flowing at a rate of 30 mL min−1 with a temperature ramp of 10 °C min−1. Prior to the TPR run, the sample (20 mg) was pretreated with Ar at 200 °C for 2 h. The hydrogen consumption was monitored with the thermal conductivity detector (TCD) of a gas chromatograph. Temperature-programmed desorption (TPD) of CO2 was carried out in a laboratory-built apparatus coupled to a gas chromatograph using a TCD detector. In a typical experiment, about 0.1 g of the oven-dried sample was taken in a quartz tube. The catalyst sample was initially activated at 300 °C for 2 h under flowing helium (He) gas (99.995%, 50 mL min−1) to clean the surface of the catalyst. After cooling the sample to 100 °C the sample was exposed to 10% CO2 balanced He gas for 1 h. The sample was then flushed with He to drive off physisorbed CO2. TPD of the catalyst was then carried out in a He flow at a rate of 30 mL min−1, in the temperature range of 100–700 °C and with a ramp of 10 °C min−1. The amount of CO2 desorbed was calculated from the peak area of the already calibrated TCD signal. H2 chemisorption studies were performed using an Autosorb iQ (M/s Quantachrome USA) unit. The catalyst samples (100 mg), taken in a quartz reactor, were first reduced in H2 gas at a flow rate of 60 mL min−1 and with a heating rate of 10 °C min−1 up to 650 °C. The samples were then flushed with He for 1 h followed by cooling. H2 gas was then introduced in pulses and the adsorption uptake was analyzed. The active metal area and dispersion and crystal sizes were calculated from H2 monolayer uptake values by using the following equations. Active metal surface area (ASA) = (Nm × S × Am)/166; where ASA is in m2 g−1 of the sample. Average crystal size (d) = (100 × L × f)/(ASA × Z); dispersion (%) =(Nm × S × M)/100 × L; Nm = the number of adsorbed gas molecules, S = adsorption stoichiometry, Am = the cross-sectional area occupied by each active metal surface atom, M and L are the molecular weight and percent loading of the supported metal, respectively, and f is a particle shape correction factor (6 for spherical particles). Z = the density of the supported metal. The coke content of the used catalysts was determined using a CHNS analyzer (M/s ElementaV, Germany).
2.3 Evaluation of catalysts
The glycerol steam reforming reaction was conducted in a fixed bed reactor whose details are available elsewhere.20 Typically, 500 mg of the catalyst was loaded in the middle of the reactor suspended between two quartz wool plugs. The bottom and top portions of the reactor were filled with porcelain beads. Prior to the reaction measurement, the catalyst was reduced at 650 °C for 5 h under a 60 mL min−1 hydrogen flow. After reduction, the reactor was brought to the reaction temperature under the hydrogen flow. The hydrogen present in the reactor was completely swept away with the N2 flow (60 mL min−1) till no hydrogen peak in the TCD signal was observed. A glycerol solution with a water to glycerol (W/G) mole ratio (1![[thin space (1/6-em)]](https://www.rsc.org/images/entities/char_2009.gif) :
:![[thin space (1/6-em)]](https://www.rsc.org/images/entities/char_2009.gif) 9) was used for the activity tests. The feed was introduced into the pre-heater zone of the reactor at a flow rate of 0.08 mL min−1 using a HPLC pump (M/s Lab Chemi, India). The feed was carried over to the catalyst with N2 (10 mL min−1) which served as the carrier. The reactor outlet mixer was passed through a condenser maintained at 0 °C. The liquid and gaseous products were separated in a gas–liquid separator. The gases were sent online to the GC (Agilent 7560) equipped with a TCD detector and a carbosphere (60/80 mesh) packed column for analyzing H2, CO, CH4 and CO2. The liquid products like methanol (MeOH), ethanol (EtOH), 2-propanol (2-Pr-OH), ethylene glycol (EG), 1,2-propanediol and 1,3-propanediol were analyzed offline in a GC equipped with an FID detector and an innowax column.
9) was used for the activity tests. The feed was introduced into the pre-heater zone of the reactor at a flow rate of 0.08 mL min−1 using a HPLC pump (M/s Lab Chemi, India). The feed was carried over to the catalyst with N2 (10 mL min−1) which served as the carrier. The reactor outlet mixer was passed through a condenser maintained at 0 °C. The liquid and gaseous products were separated in a gas–liquid separator. The gases were sent online to the GC (Agilent 7560) equipped with a TCD detector and a carbosphere (60/80 mesh) packed column for analyzing H2, CO, CH4 and CO2. The liquid products like methanol (MeOH), ethanol (EtOH), 2-propanol (2-Pr-OH), ethylene glycol (EG), 1,2-propanediol and 1,3-propanediol were analyzed offline in a GC equipped with an FID detector and an innowax column.
The data were interpreted with the help of the following equations:
R is the H
2/CO
2 reforming ratio (7/3) of glycerol.
where i is CO, CH
4 or CO
2 produced experimentally.
The material balance carried out across the reactor for all evaluations was within 95–97%, indicating the reliability of the data.
3. Results & discussion
3.1 BET surface area
The BET surface area shows a decreasing trend (Table 1) with increasing La2O3 composition up to the composition of the CML3 catalyst in the fresh samples. Beyond this the change in the surface area is negligible, possibly due to the formation of bulk perovskite. The chemical composition of the catalysts as determined by the ICP-OES technique is also presented in Table 1. The data indicate a close correspondence between the theoretical and experimental compositions. The data were verified for their accuracy taking the average of 3 consecutive values for the composition of catalysts and the variation was within 5%.
Table 1 BET surface area, H2-consumption and ICP-OES data of the CMLx (x = 1, 2, 3, 4 and 5) catalysts
| Catalyst |
Surface area (m2 g−1) |
H2-consumption (TPR) (mmol per g cat.) |
Chemical composition (ICP-OES) (wt%) |
| 1st peak |
2nd peak |
(2nd peak)/(1st peak) |
Mg |
La |
Co |
| CML1 |
26.3 |
0.51 |
0.98 |
1.9 |
39.5 |
39.6 |
19.8 |
| CML2 |
15.0 |
0.54 |
1.13 |
2.0 |
26.0 |
52.8 |
19.9 |
| CML3 |
11.6 |
0.58 |
1.18 |
2.0 |
19.9 |
59.2 |
19.8 |
| CML4 |
13.9 |
0.50 |
1.04 |
1.9 |
15.8 |
63.5 |
19.8 |
| CML5 |
14.1 |
0.59 |
1.18 |
1.9 |
12.7 |
66.0 |
19.7 |
3.2 X-ray diffraction
The XRD patterns of calcined CMLx catalysts are shown in Fig. 1. The presence of the LaCoO3 structure is confirmed by the peaks at 2θ values of 23.5, 32.9, 33.3, 47.5 and 58.9° which match well with those reported in the literature (JCPDS 840894). The absence of diffraction peaks related to cobalt oxide suggests that either the cobalt oxide is utilized progressively in LaCoO3 formation or it exists in an amorphous form. The continuous decrease in the surface area from CML1 to CML3 supports the formation of the perovskite from its individual oxides. At a higher composition of La2O3, the crystallinity of the LaCoO3 phase increases indicating the presence of the perovskite in its bulk form. Approximately, the constant values of the surface area of these catalysts also support this proposition. In addition, the peaks observed at 38.2 and 39.2° in CML4 and CML5, respectively, represent hexagonal La2O3, that has phased out after the perovskite formation. Moving from CML5 to CML1 (increasing the Mg ratio) the XRD patterns reveal the interesting phenomenon of shifting of the perovskite peaks at 32.9 and 33.3° to lower 2θ values. This indicates partial insertion of Mg2+ in place of La3+ sites in the LaCoO3 perovskite. Previously, it was reported that the partial insertion of La3+ into Ce4+ results in the shifting of CeO2 diffractions to lower 2θ values.21 Similarly, Pt substitution in the LaCoO3 phase caused the shifting of the perovskite peaks to lower 2θ values.20 Diffractions with a very low intensity, identified at 42.6 and 62.1°, particularly in CML1 and CML2 catalysts, may be attributed to the presence of MgO. But in catalysts with higher La2O3 compositions they are not clear. Instead, the presence of isolated La2O3 in the cubic phase is observed by the peaks at 27.4 and 28.1° (JCPDS 401284).
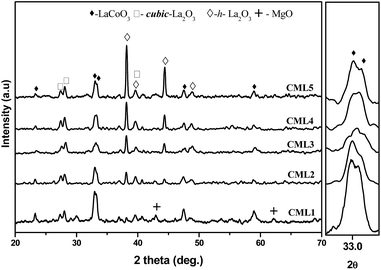 |
| | Fig. 1 XRD patterns of CMLx (x = 1, 2, 3, 4 and 5) calcined catalysts. | |
3.3 Temperature-programmed H2-reduction (H2-TPR)
The reduction profiles of the catalysts are shown in Fig. 2. The profiles are almost similar for all the catalysts, except for the change in the positions of reduction maxima. Each catalyst exhibits two reduction maxima, one in the region of 300–600 °C and the other in the region of 600–900 °C. For catalysts containing lanthanum oxides, the peak in the high-temperature region could be due to the decomposition of dioxycarbonate. To rule out this possibility, the TPR of the support without Co was also traced. As can be seen from the TPR pattern of the support no such peak is observed. Further, as listed in Table 1, in each catalyst the ratio of the hydrogen consumption represented by the second peak to that of the first one is almost close to 2. It confirms the two-step reduction of cobalt oxide i.e., Co3+ to Co2+ and Co2+ to Co0, respectively. The profiles conform to the two-step reduction of cobalt oxide i.e., Co3+ to Co2+ and Co2+ to Co0, respectively. There is a general shift in the low and high temperature maxima to the lower side in samples CML1 to CML3. From CML4 to CML5 the maxima have shifted to the higher side. The shifting towards lower temperature may be due to the partial substitution of Mg in the LaCoO3 which makes some of the Co3+ ions to exist as Co4+ to balance the total charge in the non-stoichiometric LaCoO3 perovskite, similar to the results reported in the literature for the partial substitution of LaMnO3 perovskite by Mg.22,23 The high temperature shifting observed in CML4 and CML5 might be due to the presence of bulk LaCoO3, which is relatively difficult to reduce. The formation of the bulk perovskite in the XRD patterns supports this observation. The TPR results reveal the easy reducibility achieved in the case of CML1 to CML3, particularly in CML3.
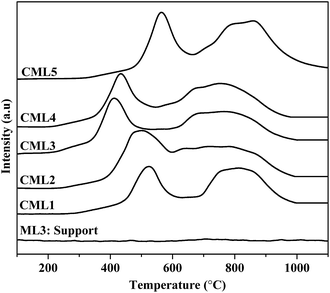 |
| | Fig. 2 H2 TPR of CMLx (x = 1, 2, 3, 4 and 5) catalysts. | |
3.4 Fourier transform infrared spectroscopy (FT-IR)
FT-IR spectra of the calcined CMLx (x = 1, 2, 3, 4 and 5) catalysts are shown in Fig. 3. The formation of the perovskite phase can be confirmed from the LaCoO3 characteristic vibrational bands observed at 422.4, 572.8, 649.6, 1387.2 and 1499.2 cm−1 in the IR spectra of the samples.24 As reported in the literature, the peaks at 572.8 and 649.6 cm−1 can be assigned to the stretching of the Co–O band of the CoO6 octahedral unit while the one at 422.4 cm−1 can be assigned to the O–Co–O bending frequency of the CoO4 tetrahedral unit present in the LaCoO3 perovskite.25 However, the presence of MgO cannot be verified by the Mg–O stretching frequency as the O–Co–O bending vibration of the tetrahedral unit (CoO4) overlaps with this band.26
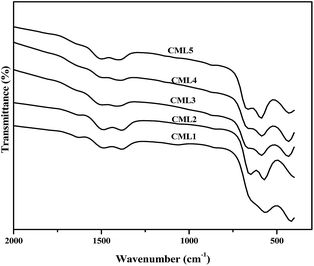 |
| | Fig. 3 FT-IR spectra of the calcined CMLx (x = 1, 2, 3, 4 and 5) catalysts. | |
3.5 Temperature-programmed desorption of CO2 (CO2-TPD)
Temperature-programmed CO2 desorption studies are widely used to evaluate the strength and amount of basic sites. The data on surface basicity are included in Table 2 and the TPD curves are shown in Fig. 4. The TPD curves of the catalysts consist of two CO2 desorption peaks. The maximum temperature Tmax of the first peak representing the moderate basic sites is observed in the range of 300–600 °C and the second desorption Tmax with the shoulder peak positioned in the range of 600–900 °C is assignable to the strong basic sites.27 One important observation is that the intensity of the peak associated with the strong basic site increases with the increase in the La2O3 composition. Regardless of the compositions of the catalysts, the strong basic sites have dominated the patterns. It can be observed that not much of a change can be observed in the intensity of the peak corresponding to the moderate basic sites, whereas a considerable change is observed in the peaks representing the strong basic sites of the catalysts.28 The strong basicity progressively (Table 2) increases up to CML4 and then on remained almost constant reiterating the attainment of the bulk nature of the perovskite in the high La2O3 catalysts, as observed by the XRD patterns. The total basicity also showed a similar trend.
Table 2 Basicity of the catalysts determined from CO2 TPD
| Catalyst |
Basicity of the catalysts (mmol per g catalyst) |
| Moderate |
Strong |
Total |
| CML1 |
0.093 |
0.218 |
0.311 |
| CML2 |
0.101 |
0.244 |
0.345 |
| CML3 |
0.094 |
0.273 |
0.367 |
| CML4 |
0.101 |
0.294 |
0.395 |
| CML5 |
0.125 |
0.297 |
0.422 |
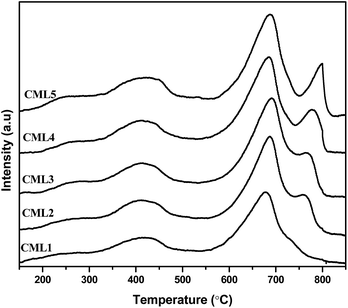 |
| | Fig. 4 CO2-TPD of CMLx (x = 1, 2, 3, 4 and 5) catalysts. | |
3.6 H2-Pulse chemisorption
The H2-pulse technique is utilized to know the active metal (Co) area, its dispersion and particle size on the catalyst surface. The variation in these three parameters with changes in the La2O3 composition is presented in Table 3. It can be observed that the first two parameters have increased, whereas the third i.e., the particle size, decreased up to CML3 and then on showed a reverse trend. Higher values for the active metal surface area (4.05 m2 per g cat.) and metal dispersion (56.1%) are achieved for the CML3 catalyst. The same catalyst has shown the least value for the particle size (3.3 nm). Therefore, the La2O3 composition in the support has its positive influence till CML3, beyond which it is not much effective. These data correlate well with the XRD data indicating Mg insertion in La2O3 and the TPR data on reducibility.
Table 3 Pulse chemisorption data obtained on the catalysts
| Catalyst |
Active metal surface area (m2 g−1) |
Dispersion (%) |
Average crystal size (nm) |
| CML1 |
2.20 |
30.50 |
6.1 |
| CML2 |
2.47 |
34.20 |
5.5 |
| CML3 |
4.05 |
56.13 |
3.3 |
| CML4 |
1.44 |
19.90 |
9.4 |
| CML5 |
0.80 |
11.10 |
16.8 |
3.7 XRD patterns of the reduced catalysts
The XRD patterns of the reduced catalysts are recorded in order to understand the structural changes of the calcined CMLx catalysts under the reduction process. The patterns are shown in Fig. 5. The peaks due to perovskite disappear after reduction indicating that its structure has completely collapsed. The diffraction peaks observed at 27.3, 28.0, 37.4, 39.5, 43.6, 48.6 and 62.2° are of La2O3.29 The only peak observed at 44.3° can be assigned to metallic cobalt.30 No diffraction lines belonging to MgO are noticed. In the case of CML3 the peak due to metallic cobalt is not clearly seen. This may be because the particle size of the Co species might be below the detection limit of the XRD analysis, as also revealed by the hydrogen chemisorption data.
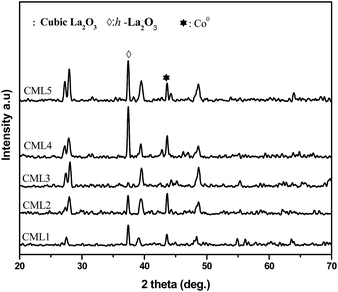 |
| | Fig. 5 XRD of reduced CMLx (x = 1, 2, 3, 4 and 5) catalysts. | |
3.8 Glycerol steam reforming activity of the catalysts
All the cobalt catalysts were investigated for glycerol steam reforming in the temperature range of 500–700 °C with 100 °C intervals. The glycerol conversion is almost complete in the temperature region studied. At 700 °C the percentage conversion of glycerol to vapor-phase products increased from CML1 to CML3, reaching its maximum value of 99.9% on CML3. The hydrogen yield touched a value of 72.8% on this catalyst, which is remarkable. The efficient performance of CML3 can be due to a combination of the ease of reducibility of the metal oxide, and the smallest metal particle size. The easy reducibility as shown by its TPR pattern is a result of the incorporation of Mg ions in the perovskite lattice, which seems to occur up to CML3. From the XRD patterns of the reduced catalysts it may be inferred that Co exists in a highly dispersed state on La2O3, and MgO helps in maintaining the dispersion of this catalyst. The space time yield (STY), which is a useful concept to compare the performance of the catalysts, was calculated and the results are shown in Fig. 6. It may be emphasized that the STY and particle size of the cobalt are in inverse relationship. As the particle size increases the hydrogen STY of the catalysts decreases. The STY is found to have reached its maximum (339.6 g kg−1 h−1) on the catalyst with a minimum particle size of 3.3 nm on CML3. Thus, high reducibility and the small particle size seem to contribute to the efficient performance of CML3. High hydrogen yield from glycerol also means that the catalyst could effectively decrease the formation of liquid products. In the case of CML4 and CML5, where the La2O3 composition is high the reaction has resulted in the formation of a high amount of liquid products (Tables S1–S5†) with a consequent decrease in the vapor-phase products.
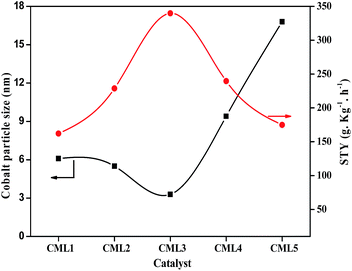 |
| | Fig. 6 Comparison of catalysts in terms of the hydrogen STY and particle size. | |
The effect of reaction temperature on glycerol conversion to vapor-phase products over the CML3 is shown in Fig. 7. It can be seen that with an increase in the reaction temperature, the selectivity to CO decreases with a simultaneous rise in the selectivity to CO2. It indicates that CO participates in the WGS reaction. The extent of CH4 formation remains almost stable suggesting that as it is formed it participates in the reforming reaction in the presence of water. Both the above two reactions help increase the yield of hydrogen at a higher temperature (700 °C). Increasing hydrogen yield with increasing temperature is also in accordance with the endothermic nature of the steam reforming reaction. Fig. 8 compares the hydrogen yield and the extent of the coke formation rate on various catalysts. It can be seen that CML3 offers the highest yield of 72.8% with minimum carbon formation.
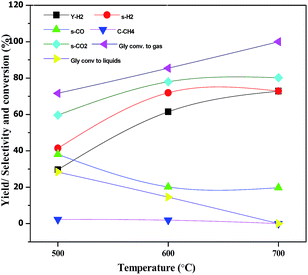 |
| | Fig. 7 Effect of temperature on glycerol steam reforming activity of CML3 catalyst. | |
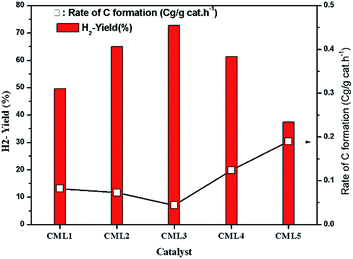 |
| | Fig. 8 Variation of H2 yield and carbon formation with the catalyst composition. | |
3.9 Coke formation during the reaction
The extent of coke formation during the reaction in different catalysts, as determined by CHN analysis is presented in Fig. 8. There is less coke formation (as expressed by its C content) in catalysts up to CML3. CML3 has exhibited the lowest coke content. The catalyst also shows the smallest cobalt particle size after reduction. As reported in the literature,31 the initiation step for carbon formation is difficult on small metal particles. da Silva et al.,32 have reported that the rate of the deactivation depends on the particle size of the cobalt species and the small cobalt particles exhibit strong resistance to deactivation caused by the carbon formation. The present results agree with this report. Coke formation is more in CML4 and CML5 catalysts. This may be due to the high ratio of the La2O3 which has resulted in bulk (LaCoO3) perovskite formation, as evidenced by the XRD of the fresh samples. The intensities of peaks related to the isolated lanthana and perovskite material are found to be high in CML4 and CML5. It may be assumed that the perovskite phase is partly covered with the isolated lanthana which makes it difficult for the reduction of the perovskite precursors to the active metal (Co). H2-TPR data of the fresh catalysts also support this speculation well because the reduction profiles of the CML4 and CML5 have shifted towards high temperature. The basicity of the catalysts also has a strong influence on controlling the coking on the catalyst. The basicity of the catalysts, as determined by the CO2-TPD, is presented in Table 2. The strong, as well as the total basicity can be seen increasing rapidly up to CML4 and then on remains almost the same. The results indicate that there is no direct correlation between the coke resistance and the basicity of the catalysts. Thus, the particle size of the Co metal seems to be the decisive factor in controlling the deactivation. The results of the time on stream analysis that reflects the stability of the CML3 catalyst are shown in Fig. 9. The catalyst has remained stable without any deactivation for a period of 35 h indicating its resistance to coke formation.
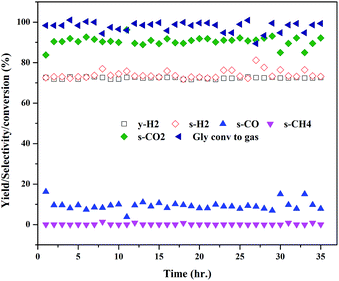 |
| | Fig. 9 Time on stream study of the CML3 catalyst. | |
In order to understand the nature of the carbon formed during the GSR reaction the spent catalysts were investigated by H2-TPR. The profiles obtained are shown in Fig. 10. CML1 and CML2 exhibit a positive and a negative peak in the temperature range of 400–700 °C. A literature report20 assigns the positive peak to the solid carbon without hydrogen while the negative peak is assigned to the partially hydrogenated carbonaceous species (CHx; x = 2–3). In the case of the CML3 catalyst, the absence of both the peaks indicates that the formation of solid carbon and the unsaturated carbonaceous moiety is minimized. In CML4 and CML5 again the formation of the solid carbon is evidenced by the positive peak positioned in the range of 400–600 °C. A high temperature peak in the region of 750–900 °C is attributed to the reduction of La3+ present in the form of La2O2CO3, as reported in the literature.33 The role of La2O2CO3 in controlling coke formation also needs to be understood.
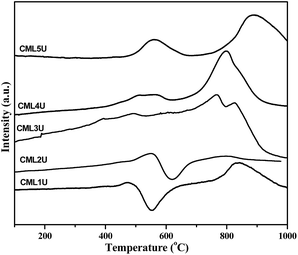 |
| | Fig. 10 H2-TPR profiles of the spent catalysts. | |
La2O2CO3 is formed by the interaction of CO2 with La2O3 as shown in reaction (vi). The reaction (reaction (vii)) showing the removal of the solid carbon on the catalyst surface by La2O2CO3, akin to the Boudouard reaction (CO disproportionation) is reported in the literature.34 Xiaoya Huang et al.,35 reported that the hexagonal La2O2CO3 phase remains stable under the reforming conditions. The formation of La2O2CO3 is also evidenced in the XRD patterns of the spent catalyst of the samples which are shown in Fig. S1.† Hence, it may be believed that in the present investigation lanthana has also played a similar role in successfully removing the solid carbon formed over the cobalt active site. The existence of lanthana in the dispersed state in CML1 to CML3 implies the favorable removal of coke from the surface. The role of MgO is also significant. It activates water (reaction (viii)), which in turn reacts with CO and produces H2 and CO2 (reaction (ix)). This again is akin to the WGS reaction (CO + H2O → H2 + CO2).
| | | CO2 + La2O3 → La2O2CO3 | (vi) |
| | | La2O2CO3 + C → La2O3 + 2CO | (vii) |
| | | MgO + H2O → Mg(OH)2 | (viii) |
| | | CO + Mg(OH)2 → H2 + CO2 + MgO | (ix) |
4. Conclusions
The best activity during the catalytic steam reforming of glycerol is achieved at 700 °C on the CML3 catalyst that constitutes 20% Co and is supported on the MgO–La2O3 mixed oxide with a ratio of 1![[thin space (1/6-em)]](https://www.rsc.org/images/entities/char_2009.gif) :
:![[thin space (1/6-em)]](https://www.rsc.org/images/entities/char_2009.gif) 3. Complete conversion of glycerol is achieved on this catalyst. Producing the maximum amount of gaseous products, the catalyst has reached a hydrogen yield of 72.8% at 700 °C. Two factors influence the superior performance of this catalyst: the ease of reducibility and the smaller particle size of the Co metal. Partial substitution of Mg into LaCoO3 increases the reducibility of LaCoO3. At an appropriate ratio, La2O3 plays a crucial role in controlling the average cobalt metal particle size, metal surface area and dispersion after reduction. A high amount of the La2O3 leads to the formation of the bulk LaCoO3 perovskite structure that is difficult to be reduced. The catalysts with the high amount of La2O3 in the support result in the facile formation of liquid products which is detrimental to achieve a high yield of hydrogen. Coke formation is also minimum for the CML3 catalyst. The high resistance of CML3 towards coke formation is explained by the small particle size and the formation of La2O2CO3 from La2O3 and solid carbon and its decomposition into La2O3 and CO. This catalyst is stable up to 35 h during the time on stream analysis.
3. Complete conversion of glycerol is achieved on this catalyst. Producing the maximum amount of gaseous products, the catalyst has reached a hydrogen yield of 72.8% at 700 °C. Two factors influence the superior performance of this catalyst: the ease of reducibility and the smaller particle size of the Co metal. Partial substitution of Mg into LaCoO3 increases the reducibility of LaCoO3. At an appropriate ratio, La2O3 plays a crucial role in controlling the average cobalt metal particle size, metal surface area and dispersion after reduction. A high amount of the La2O3 leads to the formation of the bulk LaCoO3 perovskite structure that is difficult to be reduced. The catalysts with the high amount of La2O3 in the support result in the facile formation of liquid products which is detrimental to achieve a high yield of hydrogen. Coke formation is also minimum for the CML3 catalyst. The high resistance of CML3 towards coke formation is explained by the small particle size and the formation of La2O2CO3 from La2O3 and solid carbon and its decomposition into La2O3 and CO. This catalyst is stable up to 35 h during the time on stream analysis.
Acknowledgements
The authors PSSP and MS thank CSIR, New Delhi, India for the award of Emeritus Fellowship and a Senior Research Fellowship, respectively. Thanks are due to the Department of Science and Technology (DST), New Delhi for providing grants for research.
References
- W. Cai, P. R. de la Piscina, K. Gabrowska and N. Homs, Bioresour. Technol., 2013, 128, 467 CrossRef CAS PubMed.
- P. N. Naresh, P. S. N. Murty, P. Biswas and S. Shishir, Org. Process Res. Dev., 2016, 20, 1059 CrossRef.
- P. R. de la Piscina and N. Homs, Chem. Soc. Rev., 2008, 37, 2459 RSC.
- W. Cai, P. R. de la Piscina and N. Homs, Bioresour. Technol., 2012, 107, 482 CrossRef CAS PubMed.
- E. B. Pereira, P. R. de la Piscina and N. Homs, Bioresour. Technol., 2011, 102, 3419 CrossRef CAS PubMed.
- L. M. Martínez, T. M. Araque, J. C. Vargas and A. C. Roger, Appl. Catal., B, 2013, 132, 499 CrossRef.
- W. Cai, P. Ramírez de la Piscina, K. Gabrowska and N. Homs, Bioresour. Technol., 2013, 128, 467 CrossRef CAS PubMed.
- C. K. Cheng, S. Y. Foo and A. A. Adesina, Ind. Eng. Chem. Res., 2010, 49, 10804 CrossRef CAS.
- M. L. Dieuzeide, M. Jobbagy and N. Amadeo, Catal. Today, 2013, 213, 50 CrossRef CAS.
- T. Viinikainen, H. Ronkkonen, H. Bradshaw, H. Stephenson, S. Airaksinen and M. Reinikainen, Appl. Catal., A, 2009, 362, 169 CrossRef CAS.
- M. Fleys, Y. Simon, D. Swierczynski, A. Kiennemann and P. Marquaire, Energy Fuels, 2006, 20, 2321 CrossRef CAS.
- J. Mazumder and H. de Lasa, Appl. Catal., B, 2014, 160, 67 CrossRef.
- D. Cheng-xiong, Y. Hao-bo, Y. Hao, W. Hong-juan and P. Feng, Acta Phys.-Chim. Sin., 2016, 32, 1527 Search PubMed.
- S. Kah Weng, L. Hua Chyn, G. Jolius and C. Chin Kui, Bull. Chem. React. Eng. Catal., 2013, 8, 160 Search PubMed.
- C. A. Franchini, W. Aranzaez, A. M. D. de Farias, G. Pecchi and M. A. Fraga, Appl. Catal., B, 2014, 147, 193 CrossRef CAS.
- M. L. Dieuzeide, M. Jobbagy and N. Amadeo, Catal. Today, 2013, 213, 50 CrossRef CAS.
- Y. Guo, M. U. Azmat, X. Liu, Y. Wang and G. Lu, Appl. Energy, 2012, 92, 218 CrossRef CAS.
- K. Urasaki, Y. Sekine, S. Kawabe, E. Kikuchi and M. Matsukata, Appl. Catal., A, 2005, 286, 23 CrossRef CAS.
- M. Surendar, T. V. Sagar, B. Hari Babu, N. Lingaiah, K. S. Rama Rao and P. S. Sai Prasad, RSC Adv., 2015, 5, 45184 RSC.
- M. Surendar, T. V. Sagar, G. Raveendra, M. Ashwani Kumar, N. Lingaiah, K. S. Rama Rao and P. S. Sai Prasad, Int. J. Hydrogen Energy, 2016, 41, 2285 CrossRef CAS.
- Y. Cui, V. Galvita, L. Rihko-Struckmann, H. Lorenz and K. Sundmacher, Appl. Catal., B, 2009, 90, 29 CrossRef CAS.
- J. Zhang, X. Weng, Z. Wua, Y. Liu and H. Wang, Appl. Catal., B, 2012, 126, 23 Search PubMed.
- S. Ciminoa, L. Lisib, R. Pironeb, G. Russob and M. Turco, Catal. Today, 2000, 59, 19 CrossRef.
- A. R. Sarker, Int. J. Mater. Sci. Appl., 2015, 4, 159 CAS.
- F. Ma, Z. Ding, W. Chu, S. Hao and T. Qi, Chin. J. Catal., 2014, 35, 1768 CrossRef CAS.
- L. X. Li, D. Xu, X. Q. Li, W. C. Liu and Y. Jia, New J. Chem., 2014, 38, 5445 RSC.
- P. Seetharamulu, D. Hafedh, F. Z. Sharif, Y. A. Alhameda, A. A. Abdulrahim, A. D. Muhammad and L. A. Petrova, J. Mol. Catal. A: Chem., 2016, 414, 130 CrossRef.
- N. Seshu Babu, R. Sree, P. S. Sai Prasad and N. Lingaiah, Energy Fuels, 2008, 22, 1965 CrossRef.
- A. L. A. Marinh, R. C. Rabelo-Neto, F. B. Noronha and L. V. Mattos, Appl. Catal., A, 2016, 520, 53 CrossRef.
- L. He, B. Teng, Y. Zhang and M. Fan, Appl. Catal., A, 2015, 505, 276 CrossRef CAS.
- M. M. Natile, F. Poletto, A. Galenda, A. Glisenti, T. Montini, L. De Rogatis and P. Fornasiero, Chem. Mater., 2008, 20, 2314 CrossRef CAS.
- A. L. M. da Silva, J. P. den Breejen, L. V. Mattos, J. H. Bitter, K. P. de Jong and F. B. Noronha, J. Catal., 2014, 318, 67 CrossRef CAS.
- Q. Shi, B. Li, W. Chen, C. Liu and B. Huang, Adv. Mater. Res., 2012, 457, 314 Search PubMed.
- V. V. Thyssen, T. A. Maia and E. M. Assaf, Fuel, 2013, 105, 358 CrossRef CAS.
- X. Huang, C. Dang, H. Yu, H. Wang and F. Peng, ACS Catal., 2015, 5, 1155 CrossRef CAS.
Footnote |
| † Electronic supplementary information (ESI) available. See DOI: 10.1039/c6se00023a |
|
| This journal is © The Royal Society of Chemistry 2017 |
 *
*
![[thin space (1/6-em)]](https://www.rsc.org/images/entities/char_2009.gif) :
:![[thin space (1/6-em)]](https://www.rsc.org/images/entities/char_2009.gif) 3La2O3 catalyst at 700 °C. The catalyst activity also remained stable up to 35 h on stream analysis.
3La2O3 catalyst at 700 °C. The catalyst activity also remained stable up to 35 h on stream analysis.![[thin space (1/6-em)]](https://www.rsc.org/images/entities/char_2009.gif) :
:![[thin space (1/6-em)]](https://www.rsc.org/images/entities/char_2009.gif) 9) was used for the activity tests. The feed was introduced into the pre-heater zone of the reactor at a flow rate of 0.08 mL min−1 using a HPLC pump (M/s Lab Chemi, India). The feed was carried over to the catalyst with N2 (10 mL min−1) which served as the carrier. The reactor outlet mixer was passed through a condenser maintained at 0 °C. The liquid and gaseous products were separated in a gas–liquid separator. The gases were sent online to the GC (Agilent 7560) equipped with a TCD detector and a carbosphere (60/80 mesh) packed column for analyzing H2, CO, CH4 and CO2. The liquid products like methanol (MeOH), ethanol (EtOH), 2-propanol (2-Pr-OH), ethylene glycol (EG), 1,2-propanediol and 1,3-propanediol were analyzed offline in a GC equipped with an FID detector and an innowax column.
9) was used for the activity tests. The feed was introduced into the pre-heater zone of the reactor at a flow rate of 0.08 mL min−1 using a HPLC pump (M/s Lab Chemi, India). The feed was carried over to the catalyst with N2 (10 mL min−1) which served as the carrier. The reactor outlet mixer was passed through a condenser maintained at 0 °C. The liquid and gaseous products were separated in a gas–liquid separator. The gases were sent online to the GC (Agilent 7560) equipped with a TCD detector and a carbosphere (60/80 mesh) packed column for analyzing H2, CO, CH4 and CO2. The liquid products like methanol (MeOH), ethanol (EtOH), 2-propanol (2-Pr-OH), ethylene glycol (EG), 1,2-propanediol and 1,3-propanediol were analyzed offline in a GC equipped with an FID detector and an innowax column.
![[thin space (1/6-em)]](https://www.rsc.org/images/entities/char_2009.gif) :
:![[thin space (1/6-em)]](https://www.rsc.org/images/entities/char_2009.gif) 3. Complete conversion of glycerol is achieved on this catalyst. Producing the maximum amount of gaseous products, the catalyst has reached a hydrogen yield of 72.8% at 700 °C. Two factors influence the superior performance of this catalyst: the ease of reducibility and the smaller particle size of the Co metal. Partial substitution of Mg into LaCoO3 increases the reducibility of LaCoO3. At an appropriate ratio, La2O3 plays a crucial role in controlling the average cobalt metal particle size, metal surface area and dispersion after reduction. A high amount of the La2O3 leads to the formation of the bulk LaCoO3 perovskite structure that is difficult to be reduced. The catalysts with the high amount of La2O3 in the support result in the facile formation of liquid products which is detrimental to achieve a high yield of hydrogen. Coke formation is also minimum for the CML3 catalyst. The high resistance of CML3 towards coke formation is explained by the small particle size and the formation of La2O2CO3 from La2O3 and solid carbon and its decomposition into La2O3 and CO. This catalyst is stable up to 35 h during the time on stream analysis.
3. Complete conversion of glycerol is achieved on this catalyst. Producing the maximum amount of gaseous products, the catalyst has reached a hydrogen yield of 72.8% at 700 °C. Two factors influence the superior performance of this catalyst: the ease of reducibility and the smaller particle size of the Co metal. Partial substitution of Mg into LaCoO3 increases the reducibility of LaCoO3. At an appropriate ratio, La2O3 plays a crucial role in controlling the average cobalt metal particle size, metal surface area and dispersion after reduction. A high amount of the La2O3 leads to the formation of the bulk LaCoO3 perovskite structure that is difficult to be reduced. The catalysts with the high amount of La2O3 in the support result in the facile formation of liquid products which is detrimental to achieve a high yield of hydrogen. Coke formation is also minimum for the CML3 catalyst. The high resistance of CML3 towards coke formation is explained by the small particle size and the formation of La2O2CO3 from La2O3 and solid carbon and its decomposition into La2O3 and CO. This catalyst is stable up to 35 h during the time on stream analysis.


