 Open Access Article
An ultrasensitive fluorogenic probe for revealing the role of glutathione in chemotherapy resistance†
Yuejing
Jiang
bd,
Juan
Cheng
a,
Chengyu
Yang
c,
Yongzhou
Hu
a,
Jia
Li
b,
Yifeng
Han
c,
Yi
Zang
*b and
Xin
Li
 *a
*a
aCollege of Pharmaceutical Sciences, Zhejiang University, Hangzhou 310058, China. E-mail: lixin81@zju.edu.cn
bState Key Laboratory of Drug Research, Shanghai Institute of Materia Medica, Chinese Academy of Sciences, Shanghai 201203, China. E-mail: yzang@simm.ac.cn
cDepartment of Chemistry, Zhejiang Sci-Tech University, Hangzhou 310018, China
dUniversity of Chinese Academy of Sciences, Beijing 100049, China
First published on 4th October 2017
Abstract
Unveiling the detailed roles of glutathione (GSH) in chemoresistance necessitates a reliable assay for its detection in intact live specimens. Herein, by taking advantage of the susceptibility of electron-poor Csp2–Ssufinyl bond to GSH nucleophilic attack, we developed a naphthalimide–sulfoxide based fluorogenic probe (Na-8) applicable for tracking endogenous GSH fluctuation in live cells. Na-8 features a high degree of sensitivity towards GSH as demonstrated by its utmost 2200-fold fluorogenic response. As a proof of concept, Na-8 has been applied to image GSH in liver cancer HepG2 cells with the normal L02 cell counterparts serving as a control, and elevated GSH level was observed in HepG2 in contrast to L02. Further experiments showed that this elevated GSH level was involved in doxorubicin-resistance but not in cisplatin-resistance. Noteworthy, monitoring GSH change in HepG2 and L02 cells in response to doxorubicin treatment revealed that while normal cells showed a burst of GSH in adaption to doxorubicin treatment, no significant change was detected in HepG2 cells, suggesting that HepG2 cells have been preconditioned by their intrinsic oxidative stress which confers drug-resistance. Given the observed sensitivity and spatiotemporal resolution, Na-8 should hold promise for future study on the detailed roles of GSH in drug-resistance.
Introduction
Despite the tremendous advances against cancer, chemotherapy remains a mainstay in cancer treatment. However, tumor cells may develop resistance to chemotherapy regimens, and this phenomenon poses a major problem to successful chemotherapy. Drug resistance is mediated by multiple factors,1 among which, high levels of glutathione (GSH) is surmised to contribute a lot.2–6 GSH is the predominant sulfhydryl in the biological context. It is widely expressed in normal tissues and functions as a thiol buffer enabling the maintenance of redox homeostasis. While GSH deficiency is implicated in the progression of various cancers due to the increased susceptibility to oxidative stress,7 elevated tumor GSH levels were convicted of leading to chemotherapy resistance. Increased GSH levels have been observed in various multidrug-resistance cells than their drug-sensitive counterparts.8,9 GSH may participate in the development of drug-resistance by counteracting the oxidative stimulus caused by prooxidant therapies,10 favoring the repair processes of DNA damages,11 or by conjugating chemotherapeutic agents to facilitate their efflux.12 GSH has therefore been recommended as a potential biomarker for the diagnosis or prognosis of cancers.13 This has spurred extensive research into the role of the glutathione metabolic system in the development, diagnosis and treatment of cancer.14 In particular, GSH synthetase inhibitor, buthionine sulfoximine (BSO), has been launched for clinical investigations as an adjunct with chemotherapy in the treatment of cancers.15,16 Though no significant breakthroughs have yet been made in these trials, efforts are still on.17,18 However, contrary to the above reports, it has been recently revealed that decreased GSH contributes to erlotinib (an EGFR inhibitor) resistance in non-small cell lung cancer, and that increasing GSH levels works to re-sensitize cells.19 These controversial observations highlight the necessity of assessing in detail the exact roles of GSH in drug-resistance, which demands an operationally easily-accessible assay for the reliable determination of GSH levels in live specimens.Conventionally, GSH is determined by HPLC as GSH–maleimide conjugates or spectrophotometrically by being stained with 5,5′-dithiobis[2-nitrobenzoic acid] or N-alkyl maleimide.20 However, these methods include complicated procedures incompatible with live samples. Recently, fluorescent dyes have emerged as powerful tools to image multiple biological events.21,22 Due to their non-destructive nature and satisfactory sensitivity, fluorescent probes are gaining more and more popularity in the bioanalytical field. Actually, numerous fluorescent probes for GSH detection have been reported.23–26 However, few have been used to detect intracellular GSH levels in cancer cells in relation to chemotherapy treatment. Moreover, most reported probes are Michael-receptor type compounds with the risk of inducing aldo-keto reductase AKR1C1 in live cells.27 Therefore, improvements could be envisioned including developing novel probes and testing their ability to track native GSH change in live cells challenged by chemotherapeutic agents.
Here in this manuscript, we report a naphthalimide–sulfoxide based probe (Na-8) for fluorogenically detecting GSH in live cells. Competency of the probe for real-world application has been exemplified by imaging native GSH in HepG2 tumor cells and its normal L02 counterparts in parallel. Our results showed that GSH was of higher level in HepG2 cells but L02 cells were more sensitive to doxorubicin or cisplatin treatment, which was in agreement with most previous reports on GSH-induced drug resistance. However, whilst inhibiting GSH synthesis with BSO resulted in partial resensitization of HepG2 cells to doxorubicin, BSO failed to resensitize HepG2 towards cisplatin, though it worked well to deplete intracellular GSH as indicated by Na-8 imaging. These results suggest that GSH is not the solitary player for doxorubicin-resistance and has little relevance to cisplatin-resistance. Interestingly, monitoring GSH change in response to doxorubicin in HepG2 and L02 cells revealed totally different response profiles, with L02 showing first a burst of intracellular GSH followed by the gradual balance to the original level, and HepG2 showing no significant GSH fluctuation. These results imply that normal cells produce GSH in reaction to acute oxidative stress as a rapid adaption for maximizing survival, while tumor cells express elevated levels of GSH as a result of adaption to their intrinsic oxidative stress which preconditions tumor cells and confers resistance to chemotherapy.
Results and discussion
Probe design and synthesis
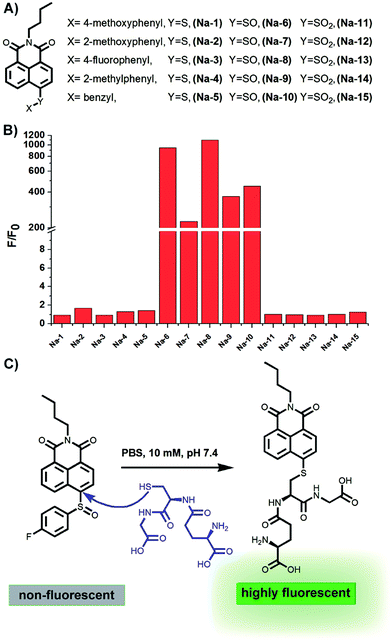
The presence of a free sulfydryl is the typical structure feature of GSH, and most of the special chemical properties of GSH, such as its reducibility, conjugating ability with drugs or metals, etc., are determined by this free sulfydryl. In fact, all reported fluorescent probes for GSH detection are designed based on the nucleophilicity of this sulfydryl. While most probes are Michael receptors which are reported to have potential side-effects of inducing aldo-keto reductase AKR1C1,27 we envisioned that non-Michael receptor type probes may be more biocompatible.The bond between an electron-deficient carbon and a sulphur should be susceptible to nucleophilic attack, because the conjugation and resonance between the sulphur 3p lone pair and the adjacent electron-deficient carbon 2p orbital are poor due to their less fitting p-orbital spacial distribution, as exemplified in the recent publication that the vinylsulfane moiety in a Meldrum's acid derivative is ready to undergo “click chemistry” with amines or other more nucleophilic thiols.28 Based on this chemistry, we constructed a small library of probes by attaching various aryl sulfides to the electron-deficient 4-position of the 1,8-naphthalimide fluorophore. Meanwhile, sulfoxide and sulfone derivatives were also prepared to further improve the electrophilic nature of the 4-position carbon atom in the fluorophore skeleton (Fig. 1).
The target sulfides were facilely synthesized by the nucleophilic substitution of N-butyl 4-bromo-1,8-naphthalimide by various phenylthiols. Their subsequent oxidation by m-chloroperoxybenzoic acid (mCPBA) afforded the sulfoxides, and further oxidation of the sulfoxides by mCPBA gave the sulfones. Detailed synthesis procedures and characterization may be found in the ESI.†
Photophysical property characterization
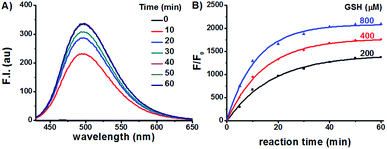
Having prepared the candidate compounds, we first assayed their fluorescent response towards GSH under biomimetic conditions (PBS, 10 mM, pH 7.4, 37 °C). While GSH caused little change to the emission profiles of the sulfide and sulfone derivatives, the sulfoxides responded to GSH with various degrees of sensitivity, with probe Na-8 bearing an electron-withdrawing group at the para-position of the phenyl ring giving the most dramatic fluorogenic response (Fig. 1). Probe Na-8 was therefore selected as a presentative for further systematical study.Probe Na-8 was almost non-fluorescent in PBS (Φ 0.0054). However, treating Na-8 with GSH (1.0 mM) induced a time-dependent fluorogenic response, and this response could be completed in about 40 min yielding a 2100-fold fluorescence enhancement (Φ 0.21) (Fig. 2A). Interestingly, when GSH of lower concentrations was tested, similar fluorogenic profile was observed (Fig. 2B and S1–S5†). It is noteworthy that due to the remarkably weak basal fluorescence, Na-8 is sensitive enough to produce a 120-fold fluorescence intensification towards GSH as low as 100 μM within the first 5 min of incubation, guaranteeing its sensitivity for live cell imaging.
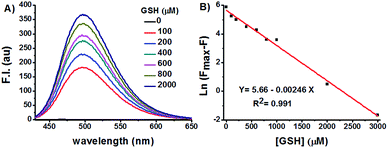
GSH titration experiments demonstrated a dose-dependent increase of Na-8 fluorescence centred at 498 nm (Fig. 3A). Plot of Na-8 fluorescence intensity at 498 nm (F) versus the concentrations of GSH (0–3.0 mM) gave an exponential dependence with GSH concentrations higher than 3.0 mM bringing the response to its maximum (Fmax) (Fig. S6†). Strikingly, the Napierian logarithm of Fmax minus F correlated linearly with GSH concentrations ranging from 0 to 3.0 mM (Fig. 3B), which happens to fall into the biologically relevant range of GSH,29 implying the great potential of probe Na-8 to quantify endogenous GSH. The detection limit of Na-8 was determined to be as low as 25 nM using the IUPAC method,30 further suggesting its high degree of sensitivity towards GSH (Fig. S7†).
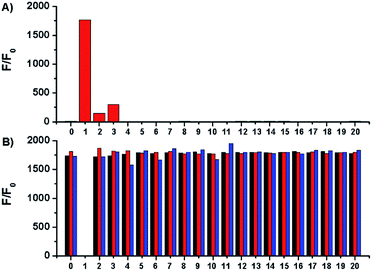
Selectivity of Na-8 was examined by measuring its fluorescent responses upon the treatment of various bio-relevant species. The results demonstrated that only sulfydryl-containing analytes could trigger on the fluorescence of Na-8, with GSH being the most potent one. Actually, GSH triggered more than 1000-fold fluorescence enhancement than equal concentration of Cys or Hcy (Fig. 4A). This observation, together with the far more concentrated physiological GSH level, suggests that biological Cys and Hcy would cause little interference to GSH detection. Moreover, Na-8 remained sensitive towards GSH in the co-presence of other analytes. Furthermore, Na-8 could still respond to GSH with similar degree of sensitivity even after the pre-treatment of various analytes, suggesting its high specificity towards GSH among the complicated biological components (Fig. 4B). Notably, when Na-8 was first incubated with GSH to trigger on the fluorescence and then treated with other analytes, still the response was not interfered by other analytes, further corroborating the high specificity of Na-8 towards GSH.
Since tumor tissues generally features an acidic microenvironment with extracellular pH of 6.5–6.9,31 it was therefore concerned whether probe Na-8 could still sensitively respond to GSH in acidic context. For this purpose, the response of Na-8 towards GSH in PBS of various pH was tested and it was revealed that the environmental pH in the range of 6.5–10 caused little interference to GSH detection (Fig. S8†), suggesting applicability of Na-8 to sense GSH in acidic environments.
Detection mechanism study
To shed light on the detection mechanism, the reaction between Na-8 and GSH was monitored by LC-MS, and a new peak emerged accompanying the consumption of Na-8 (Fig. S9†). Both the intensification of the new peak and the decrease of Na-8 were found in a GSH-dose dependent way, which agreed well with the GSH dose-dependent fluorescent response (Fig. S6†). The structure of the new peak was characterized to be the naphthalimide–GSH conjugate as shown in Fig. 1 by mass spectra (Fig. S10 and S11†), verifying that the detection reaction proceeded via a GSH-mediated nucleophilic way.Reversibility evaluation
We also tested the reversibility of the detection reaction. For this purpose, we first treated Na-8 with GSH to light up its fluorescence and then scavenged GSH with N-methyl maleimide (NMM). It turned out that no significant fluorescence decay was observed (Fig. S12†), although NMM was confirmed to work well to consume GSH (Fig. S13B†). This result indicated the irreversibility between Na-8 and its detection product. However, when the remaining GSH was consumed by NMM after it had lighted up the fluorescence of Na-8, and then the system was treated with peroxynitrite (ONOO−) which is a biorelevant reactive nitrogen species formed by the reaction between nitric oxide and superoxide,32 dramatic fluorescence attenuation was recorded, and this attenuation could be reversed by the subsequent treatment of GSH again (Fig. S13A†). We also checked that the attenuation of the signal by ONOO− ran fast to complete within seconds (Fig. S14†). These results illustrated the reversibility of the naphthalimide–GSH product to ONOO− and GSH. We speculated that ONOO−-induced signal attenuation was due to the oxidation of the naphthalimide–GSH product to its sulfoxide derivative while subsequent addition of GSH would restore its sulfide form (Fig. S15†).Applicability to live cell imaging
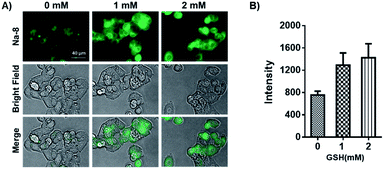
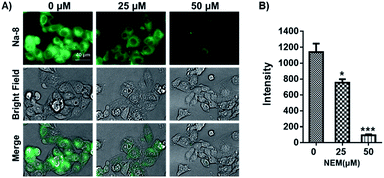
Having confirmed the good performance of Na-8 for detecting GSH in aqueous solution, we moved on to check its ability to image GSH in live cells and its capability to image exogenous GSH was first tested. For this purpose, Na-8 was first confirmed to be non-toxic (Fig. S16†), then imaging experiments were conducted. HepG2 cells were firstly loaded with probe Na-8 (10 μM) for 30 min to ensure sufficient penetration, then the culture was changed to fresh one containing GSH of gradient concentration of 1.0 mM and 2.0 mM. After incubating for 10 min, cells were washed with PBS twice and then immediately observed under microscopy. As shown in Fig. 5A, significant intracellular fluorescence was observed and the intensity was found to increase in a GSH dose-dependent way, which is in agreement with the results obtained in aqueous solution. We further validated this result by using N-acetyl-L-cysteine (NAC), a GSH surrogate, instead. And significant fluorescence intensification was observed in a time-dependent way when cells were treated with NAC (Fig. S17†). These experiments suggested that probe Na-8 was easily membrane permeable, and that the sensing reaction took place with high efficiency in live cells.It is noticeable that significant intracellular Na-8 fluorescence was observed in HepG2 cells even without exogenous GSH treatment. As GSH generally maintains a high level in tumor cells, it is therefore speculated that this intracellular fluorescence was due to endogenous GSH. To make confirmation, HepG2 cells were pretreated with N-ethylmaleimide (NEM), an irreversible chelator of GSH, for 30 min to consume endogenous GSH. Probe Na-8 (10 μM) was then added to the medium. After a further incubation of 30 min, cells were washed with PBS thrice and imaged under microscopy. As shown in Fig. 6, NEM effectively reduced the cellular fluorescence intensity in a dose-dependent way, suggesting that probe Na-8 was sensitive enough to detect endogenous GSH.
Intracellular GSH level comparison between HepG2 and L02 cells
Inspired by the above desirable results, we were interested in if probe Na-8 could be used to differentiate endogenous GSH levels in HepG2 cells and their normal counterpart L02 cells. For this purpose, both HepG2 and L02 cells were loaded with probe Na-8 (10 μM) for 30 min and then imaged under otherwise the same conditions. It was observed that the total fluorescence intensity in HepG2 cells was nearly 5-fold higher than that in L02 cells (Fig. 7), suggesting much higher GSH level in the former, which is in agreement with previous report that tumor cells generally bear high levels of GSH to resist intrinsic oxidative stress. To make double check, the cells were subjected to staining with a commercial GSH dye “monochlorobimane”, and similar results were obtained with HepG2 giving brighter fluorescence (Fig. S18†). It is noteworthy that when the staining results with probe monochlorobimane were quantified, only 2-fold fluorescence difference was observed between HepG2 and L02, which is much less dramatic than the 5-fold difference observed via probe Na-8, suggesting the higher sensitivity of Na-8 than monochlorobimane.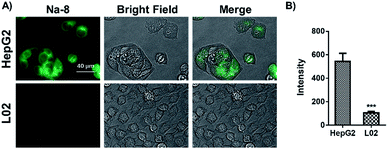 | ||
| Fig. 7 (A) Comparison on endogenous GSH level in HepG2 and L02 cells determined by Na-8 (10 μM) staining. (B) Quantified fluorescence intensities of cells as represented in panel (A). | ||
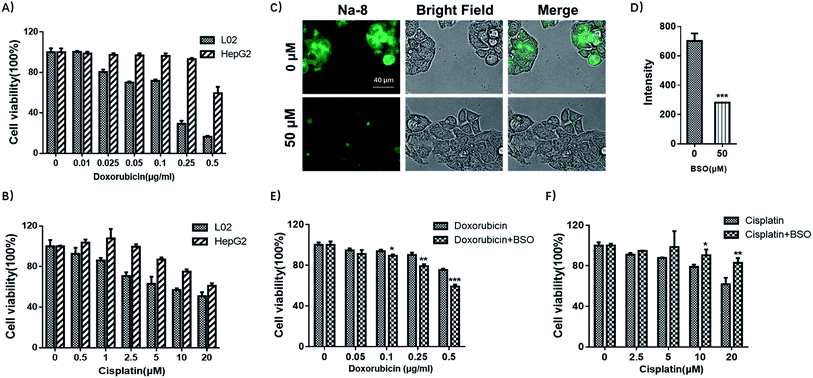
Relevance of GSH in drug-resistance
With the observation of dramatically elevated GSH level in HepG2 cells, together with previous reports that drug-resistance is one of the key factors for the poor prognosis in hepatocellular carcinoma,33 we then were interested in whether HepG2 was drug-resistant and if yes, whether GSH was involved. To elucidate the first concern, both HepG2 and L02 cells were tested for their sensitivity towards doxorubicin or cisplatin, which are among the most active agents towards hepatocellular carcinoma. HepG2 and L02 cells were seeded in 96-well plates and exposed to increasing concentrations of doxorubicin (0, 0.01, 0.025, 0.05, 0.1, 0.25, 0.5 μg ml−1) or cisplatin (0, 1, 2.5, 5, 10, 20 μM) for 72 h. Cell viability detected by MTS assay (Fig. 8A and B) suggested that HepG2 cells were less sensitive towards both anti-tumor drugs. Noteworthy, high dose (0.25 μg ml−1) of doxorubicin that sufficed to reduce L02 viability to 29% only reduced HepG2 viability to 93% (≈3 fold). In terms of cisplatin, it killed both cells in a dose-dependent way, but HepG2 was more resistant (≈1.3 fold). These results agreed well with previous reports that hepatocellular carcinoma was prone to resistance to cytotoxic agents.33Then we tested if GSH contributed to drug-resistance observed in HepG2. For this purpose, HepG2 cells were pretreated with BSO to inhibit GSH production and then tested for their sensitivity towards doxorubicin or cisplatin. Firstly, BSO itself was confirmed to have little effect on cell growth after 48 h exposure (Fig. S19†). Then cells were pretreated with BSO (50 μM) for 24 h to reduce the basal GSH level, followed by being exposed to doxorubicin or cisplatin to test the sensitivity. BSO was confirmed for its potency to deplete endogenous GSH by Na-8 imaging (Fig. 8C and D). MTS assay results suggested that the concomitant application of BSO and doxorubicin improved the sensitivity of doxorubicin in HepG2 (Fig. 8E), suggesting the implication of GSH in doxorubicin-resistance in HepG2 cells. However, when cisplatin was tested with BSO as an adjunct, no improved sensitivity was observed (Fig. 8F), suggesting that GSH contributed little to cisplatin-resistance, which is in agreement with a previous observation in ovarian cancer cells that there was no clear correlation between intracellular GSH content and cell resistance to cisplatin.34
Monitoring GSH change in HepG2 and L02 cells after doxorubicin treatment
To shed light on the mechanism of GSH-mediated doxorubicin-resistance in HepG2 cells, GSH levels in HepG2 or L02 cells challenged with doxorubicin for various time was recorded using Na-8 imaging. For this purpose, we first confirmed that Na-8 fluorescence induced by endogenous GSH could be attenuated by highly oxidative species, such as ONOO−, in live cells (Fig. S20†). Then HepG2 or L02 cells were allowed to incubate with probe Na-8 (10 μM). During the incubation, the medium in different wells were changed to fresh one containing both Na-8 (10 μM) and doxorubicin at different time point. All the wells were finally imaged at the same time end. As shown in Fig. 9 and S21,† a significant elevation of intracellular fluorescence was observed in L02 cells after doxorubicin treatment (0–20 min), while no significant change was detected in HepG2 cells. When the effect of various doses of doxorubicin to GSH change was evaluated, it seemed that lower doses (<0.1 μg ml−1) caused little effect to both HepG2 and L02 cells, while higher doses (>0.1 μg ml−1) resulted in upregulating GSH in L02 cells but slightly downregulating GSH in HepG2 cells (Fig. S22†). We surmised that these distinct response profiles were due to the different adaptive behaviors between HepG2 and L02 cells. As doxorubicin works to stimulate reactive oxidative species (ROS) overproduction,35 L02 might respond with a burst of GSH in adaption of doxorubicin-induced highly oxidative species. However, HepG2 might have been preconditioned by their intrinsic oxidative stress so that no response was observed. To confirm this speculation, both cells were detected for ROS generation after the treatment of doxorubicin by flow cytometry. After being challenged with doxorubicin (0.25 μg ml−1) for various time (0, 0.25, 0.5, 1 h), cells were stained with dichloro-dihydro-fluorescein diacetate (DCFH-DA), a general ROS indicator, and analyzed by flow cytometry. Interestingly, HepG2 cells were found bearing a higher ROS oxidative stress than L02 cells even without drug treatment (Fig. S23†). Further, doxorubicin treatment triggered a quick oxidative stress in L02 but not in HepG2 cells. As doxorubicin at high concentrations (0.4, 0.8 μg ml−1) was observed being less potent than its low-dose counterpart (0.2 μg ml−1) to increase intracellular fluorescence in L02 cells (Fig. S22†), we speculated that the fragile equilibrium between GSH and highly oxidative stress was easily broken if one side became stronger. Moreover, the little change of Na-8 fluorescence in HepG2 cells challenged by doxorubicin might suggest a relatively stable redox equilibrium in HepG2 cells. These results evidenced our speculation and suggested that the high GSH level in HepG2 was both a result of the adaption towards long-term intrinsic oxidative stress and a protective way to neutralize aggravating oxidative stress caused by cytotoxic agents, a status of drug-resistance.Conclusions
By taking advantage of the susceptibility of Csp2–Ssufinyl bond to nucleophilic attack, we have devised a fluorogenic probe with unprecedent sensitivity for GSH detection. The probe showed a high degree of sensitivity and specificity towards GSH by its high spatiotemporal resolution imaging of endogenous GSH in live cells. Facilitated by Na-8, we have imaged GSH change in hepatocellular carcinoma HepG2 cells in response to chemotherapeutic agents in parallel with their normal counterpart L02 cells, and three observations have been obtained: (1) HepG2 cells have much higher GSH levels than their normal L02 counterparts, and (2) this high GSH level contributes to doxorubicin but not to cisplatin resistance, (3) L02 cells respond to doxorubicin with a transient GSH burst but intracellular GSH in HepG2 remains basically unchanged upon similar stimulation, suggesting the generation of GSH as an adaption mechanism in normal cells to environmental stress, while tumor cells are preconditioned by their intrinsic oxidative stress.Conflicts of interest
There are no conflicts to declare.Acknowledgements
This work was supported by National Natural Science Foundations of China (21642007, 81673489, 21778048), Zhejiang Provincial Natural Science Foundation of China (LY15H300003, LR18H300001), Science and Technology Commission of Shanghai Municipality (Grant 16430724100).Notes and references
- K. O. Alfarouk, C. M. Stock, S. Taylor, M. Walsh, A. K. Muddathir, D. Verduzco, A. H. Bashir, O. Y. Mohammed, G. O. Elhassan, S. Harguindey, S. J. Reshkin, M. E. Ibrahim and C. Rauch, Cancer Cell Int., 2015, 15, 71 CrossRef PubMed.
- L. Galluzzi, L. Senovilla, I. Vitale, J. Michels, I. Martins, O. Kepp, M. Castedo and G. Kroemer, Oncogene, 2012, 31, 1869–1883 CrossRef CAS PubMed.
- D. M. Townsend and K. D. Tew, Oncogene, 2003, 22, 7369–7375 CrossRef CAS PubMed.
- D. S. Backos, C. C. Franklin and P. Reigan, Biochem. Pharmacol., 2012, 83, 1005–1012 CrossRef CAS PubMed.
- N. Traverso, R. Ricciarelli, M. Nitti, B. Marengo, A. L. Furfaro, M. A. Pronzato, U. M. Marinari and C. Domenicotti, Oxid. Med. Cell. Longevity, 2013, 2013, 972913 Search PubMed.
- E. Karwicka, Adv. Cell Biol., 2010, 2, 105–124 Search PubMed.
- S. P. Hussain, L. J. Hofseth and C. C. Harris, Nat. Rev. Cancer, 2003, 3, 276–285 CrossRef CAS PubMed.
- D. J. Tai, W. S. Jin, C. S. Wu, H. W. Si, X. D. Cao, A. J. Guo and J. C. Chang, Exp. Ther. Med., 2012, 4, 291–296 CrossRef CAS PubMed.
- V. Lopes-Rodrigues, A. Di Luca, J. Mleczko, P. Meleady, M. Henry, M. Pesic, D. Cabrera, S. van Liempd, R. T. Lima, R. O'Connor, J. M. Falcon-Perez and M. H. Vasconcelos, Sci. Rep., 2017, 7, 44541 CrossRef CAS PubMed.
- G. Barrera, ISRN Oncol., 2012, 2012, 137289 Search PubMed.
- A. Chatterjee, Nutrients, 2013, 5, 525–542 CrossRef CAS PubMed.
- S. Awasthi, S. S. Singhal, R. Sharma, P. Zimniak and Y. C. Awasthi, Int. J. Cancer, 2003, 106, 635–646 CrossRef CAS PubMed.
- M. P. Gamcsik, M. S. Kasibhatla, S. D. Teeter and O. M. Colvin, Biomarkers, 2012, 17, 671–691 CrossRef CAS PubMed.
- S. Singh, A. R. Khan and A. K. Gupta, J. Exp. Ther. Oncol., 2012, 9, 303–316 CAS.
- H. H. Bailey, R. T. Mulcahy, K. D. Tutsch, R. Z. Arzoomanian, D. Alberti, M. B. Tombes, G. Wilding, M. Pomplun and D. R. Spriggs, J. Clin. Oncol., 1994, 12, 194–205 CrossRef CAS PubMed.
- P. J. O'Dwyer, T. C. Hamilton, F. P. LaCreta, J. M. Gallo, D. Kilpatrick, T. Halbherr, J. Brennan, M. A. Bookman, J. Hoffman, R. C. Young, R. L. Comis and R. F. Ozols, J. Clin. Oncol., 1996, 14, 249–256 CrossRef PubMed.
- A. Tagde, H. Singh, M. H. Kang and C. P. Reynolds, Blood Canc. J., 2014, 4, e229 CrossRef CAS PubMed.
- J. L. Roh, H. Jang, E. H. Kim and D. Shin, Antioxid. Redox Signaling, 2017, 27, 106–114 CrossRef CAS PubMed.
- H. Li, W. Stokes, E. Chater, R. Roy, E. de Bruin, Y. Hu, Z. Liu, E. F. Smit, G. J. Heynen, J. Downward, M. J. Seckl, Y. Wang, H. Tang and O. E. Pardo, Cell Discovery, 2016, 2, 16031 CrossRef CAS PubMed.
- D. Giustarini, I. Dalle-Donne, A. Milzani, P. Fanti and R. Rossi, Nat. Protoc., 2013, 8, 1660–1669 CrossRef CAS PubMed.
- M. Gao, F. Yu, C. Lv, J. Choo and L. Chen, Chem. Soc. Rev., 2017, 46, 2237–2271 RSC.
- M. Garland, J. J. Yim and M. Bogyo, Cell Chem. Biol., 2016, 23, 122–136 CrossRef CAS PubMed.
- K. Umezawa, M. Yoshida, M. Kamiya, T. Yamasoba and Y. Urano, Nat. Chem., 2017, 9, 279–286 CrossRef CAS PubMed.
- P. Zhou, J. Yao, G. Hu and J. Fang, ACS Chem. Biol., 2016, 11, 1098–1105 CrossRef CAS PubMed.
- J. Chen, X. Jiang, S. L. Carroll, J. Huang and J. Wang, Org. Lett., 2015, 17, 5978–5981 CrossRef CAS PubMed.
- Z. Liu, X. Zhou, Y. Miao, Y. Hu, N. Kwon, X. Wu and J. Yoon, Angew. Chem., Int. Ed., 2017, 56, 5812–5816 CrossRef CAS PubMed.
- M. E. Burczynski, G. R. Sridhar, N. T. Palackal and T. M. Penning, J. Biol. Chem., 2001, 276, 2890–2897 CrossRef CAS PubMed.
- K. L. Diehl, I. V. Kolesnichenko, S. A. Robotham, J. L. Bachman, Y. Zhong, J. S. Brodbelt and E. V. Anslyn, Nat. Chem., 2016, 8, 968–973 CrossRef CAS.
- V. I. Lushchak, J. Amino Acids, 2012, 2012, 736837 Search PubMed.
- G. L. Long and J. D. Winefordner, Anal. Chem., 1983, 55, 712A–724A CrossRef CAS.
- X. Zhang, Y. Lin and R. J. Gillies, J. Nucl. Med., 2010, 51, 1167–1170 CrossRef CAS PubMed.
- C. Szabó, H. Ischiropoulos and R. Radi, Nat. Rev. Drug Discovery, 2007, 6, 662–680 CrossRef PubMed.
- L. Petraccia, P. Onori, R. Sferra, M. C. Lucchetta, G. Liberati, M. Grassi and E. Gaudio, Clin. Term., 2003, 154, 325–335 CAS.
- N. Nikounezhad, M. Nakhjavani and F. H. Shirazi, J. Exp. Ther. Oncol., 2017, 12, 1–7 Search PubMed.
- S. Y. Kim, S. J. Kim, B. J. Kim, S. Y. Rah, S. M. Chung, M. J. Im and U. H. Kim, Exp. Mol. Med., 2006, 38, 535–545 CrossRef CAS PubMed.
Footnote |
| † Electronic supplementary information (ESI) available: Synthesis of probes and their characterization, biological methods, supplementary figures. See DOI: 10.1039/c7sc03338a |
| This journal is © The Royal Society of Chemistry 2017 |

