
 Open Access Article
 This Open Access Article is licensed under a Creative Commons Attribution-Non Commercial 3.0 Unported Licence
Surface electron dynamics in hematite (α-Fe2O3): correlation between ultrafast surface electron trapping and small polaron formation†
Jakub
Husek
 ,
Anthony
Cirri
,
Somnath
Biswas
and
L. Robert
Baker
*
,
Anthony
Cirri
,
Somnath
Biswas
and
L. Robert
Baker
*
The Ohio State University, Columbus, OH 43210, USA. E-mail: baker.2364@osu.edu
First published on 9th October 2017
Abstract
Spectroscopically following charge carrier dynamics in catalytic materials has proven to be a difficult task due to the ultrafast timescales involved in charge trapping and the lack of spectroscopic tools available to selectively probe surface electronic structure. Transient extreme ultraviolet reflection-absorption (XUV-RA) spectroscopy is able to follow surface electron dynamics due to its element, oxidation-state, and surface specificity, as well as the ultrafast time-resolution which can be achieved with XUV pulses produced by high harmonic generation. Here, we use ultrafast XUV-RA spectroscopy to show that charge localization and small polaron formation in Fe2O3 occur within ∼660 fs. The photoexcitation of hematite at 400 nm initially leads to an electronically-delocalized ligand-to-metal charge transfer (LMCT) state, which subsequently evolves into a surface localized LMCT state. Comparison of the charge carrier dynamics for single and polycrystalline samples shows that the observed dynamics are negligibly influenced by grain boundaries and surface defects. Rather, correlation between experimental results and spectral simulations reveals that the lattice expansion during small polaron formation occurs on the identical time scale as surface trapping and represents the probable driving force for sub-ps electron localization to the hematite surface.
1 Introduction
Hematite (α-Fe2O3) has been studied extensively as a potential catalyst for water splitting1,2 due to its favorable optical band-gap (∼2 eV), low cost, high earth abundance, and long-term stability.3 However, its major limitation as an efficient catalyst is the low mobility of charge carriers (∼10−2 cm2 (V s)−1)4 caused by exciton recombination and trapping. Ultrafast transient absorption experiments have been used to gain insight into the mechanism of exciton formation and subsequent charge transfer dynamics in Fe2O3 in order to identify the factors responsible for the limited charge mobility. Fast charge carrier trapping has been reported under various experimental conditions using both extreme ultraviolet (XUV) and visible light spectroscopies.5–8 In all cases, the initial photoexcited state decays into a subsequently long-lived thermalized state within ∼250 fs as hot electrons relax to the band edge. The formation of a small polaron (i.e., a charge in a bound state mediated by lattice deformation) in hematite has been proposed both theoretically9 and experimentally10 to explain this fast trapping of charge carriers; however, its direct observation has been challenging due to the ultrafast time scale and lack of spectroscopic probe sensitive to this lattice deformation. Furthermore, the majority of ultrafast spectroscopic studies on hematite have been performed as transmission experiments,5–7 where the information obtained is bulk-sensitive due to the penetration of the beam through the entire sample. However, catalyst performance and energy conversion efficiency often depend on surface electron dynamics, which can differ significantly from a bulk material due to under-coordination, interface bonding, chemical and structural defects, and increased structural degrees of freedom at a material surface.11–19 Specifically, it has been suggested that the surface states of hematite are involved in the self-trapping of surface charges,20 yet optical methods with a penetration depth that would be selective for the surface states of this ubiquitous material are not common. Consequently, the ability to study catalytic materials by methods that selectively probe surface charge carrier dynamics with chemical state resolution is critical to provide a better understanding of the fundamental processes that ultimately determine energy conversion efficiency.We have recently demonstrated that probing XUV transitions at near grazing angle reflectivity simultaneously achieves the desired surface-sensitivity and chemical state resolution through measurement of the M2,3-edge transition, as schematically depicted in Fig. 1.22 We have also previously identified that the probe depth of this reflectivity measurement is approximately 3 nm, a depth comparable to that of X-ray photoelectron spectroscopy (XPS). Furthermore, experiments performed in the reflection geometry provide an important advantage over transmission measurements because of the ability to directly probe actual functional materials, as well as single crystal model systems, without respect to sample thickness or substrate. Charge carrier dynamics in single crystalline materials in particular have been elusive to transmission experiments due to attenuation of XUV photons, which typically limits the overall sample thickness to several hundred nm. Though reflection and transmission spectroscopy will report on similar chemical phenomena, the measured signals reported by the two methods are largely distinguishable from one another. The former responds to both the real, n (i.e., reflection and dispersion) and imaginary, k (i.e., resonant absorption) parts of the refractive index, while the latter is sensitive primarily to the imaginary part. Though the physical origin of the two indices is different, their causal relationship requires that they are directly dependent on one another.23
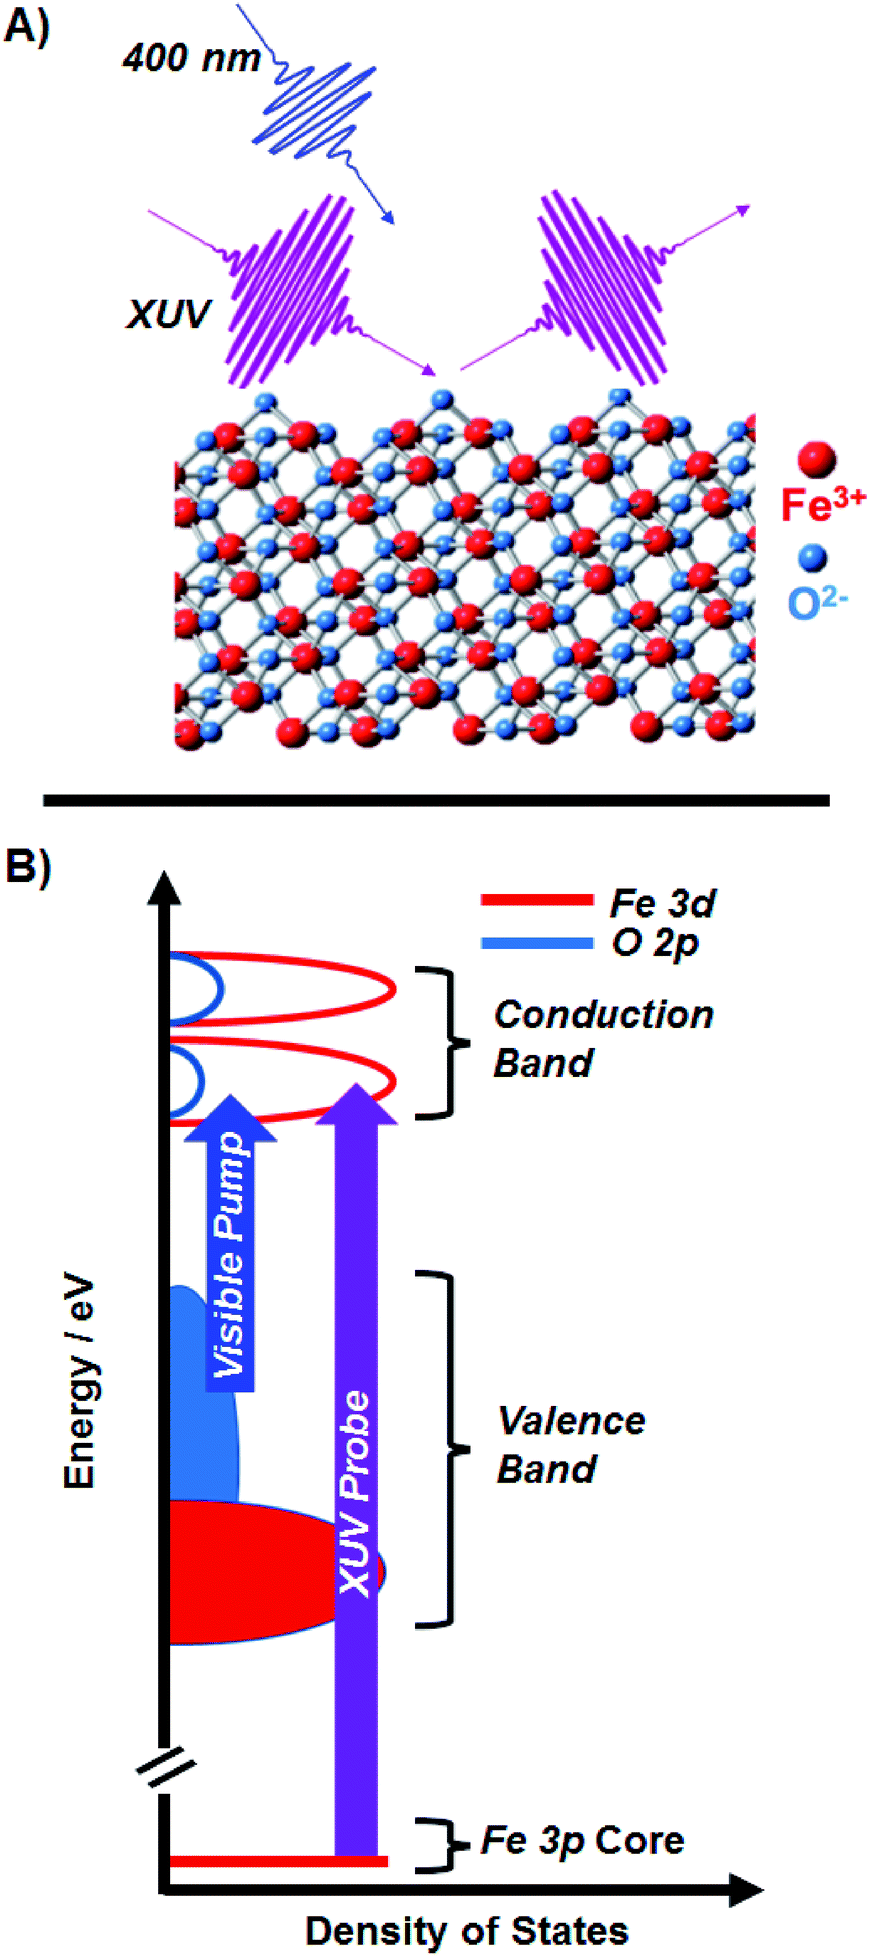 | ||
| Fig. 1 (A) Ultrafast XUV reflection-absorption spectroscopy is used to probe the transient charge transfer dynamics of α-Fe2O3. The angle of the XUV with respect to the sample surface is 8°, giving a probe selective to the first 3 nm of the material. (B) A schematic of the Fe2O3 density of states, where the 400 nm pump is on resonance with the LMCT of the metal oxide, and the XUV probe is on resonance with the M2,3-edge (3d ← 3p). Our qualitative diagram is reproduced from a quantitative calculation by Carter and co-worker.21 | ||
Here, we use transient XUV RA spectroscopy, at a near grazing angle of 8° relative to the sample surface, to show that surface charge localization occurs in 680 ± 30 fs for single-crystalline (SC) hematite and in 640 ± 20 fs for polycrystalline (PC) hematite. The nearly identical rates and spectral evolution observed for these two materials regardless of crystallinity show that these dynamics are negligibly influenced by grain boundaries or surface defect sites; rather, our results indicate that electrons localize to the surface of hematite within ∼660 fs. Furthermore, we find that n and k evolve in the excited state on separate timescales, and by taking each part of the refractive index into consideration, we show that this sub-ps spectral evolution represents a direct observation of surface charge localization and subsequent fast trapping via small polaron formation at the surface – a phenomenon known to occur with charge localization in transition metal oxides.24 Correlation between experimental results and spectral simulations shows that lattice expansion occurs around the transiently-formed Fe2+ metal center, and that this lattice expansion represents a probable driving force for surface trapping of photoexcited electrons on the sub-ps time scale.
2 Experimental
2.1 Sample preparation
Polycrystalline (PC) α-Fe2O3 was prepared by DC sputtering Fe metal onto SiO2 (100) thermal oxide wafer (500 μm) using Kurt J. Lesker Co. Lab-18 Thin Film Deposition System at 0.6 Å s−1 for 30 minutes. After the deposition, the sample was annealed in air at 520 °C for 30 minutes, giving a lustrous red surface.Single crystalline (SC) hematite (0001) was purchased directly from SurfaceNet and used without further modification ((10 × 10 × 0.5) mm3).
Tapping mode Bruker AXS Dimension Icon Atomic/Magnetic Force Microscope with ScanAsyst, equipped with a TESPA-V2 cantilever, was used to determine the surface roughness for both SC and PC samples. The scan area for all images was 10 × 10 μm2 recorded at a resolution of 512 samples per line with a 1.00 Hz scan rate. The resulting images are shown in Fig. 3C and D. The calculated root-mean-square surface roughness (Rq) for each sample was determined using NanoScope Analysis.
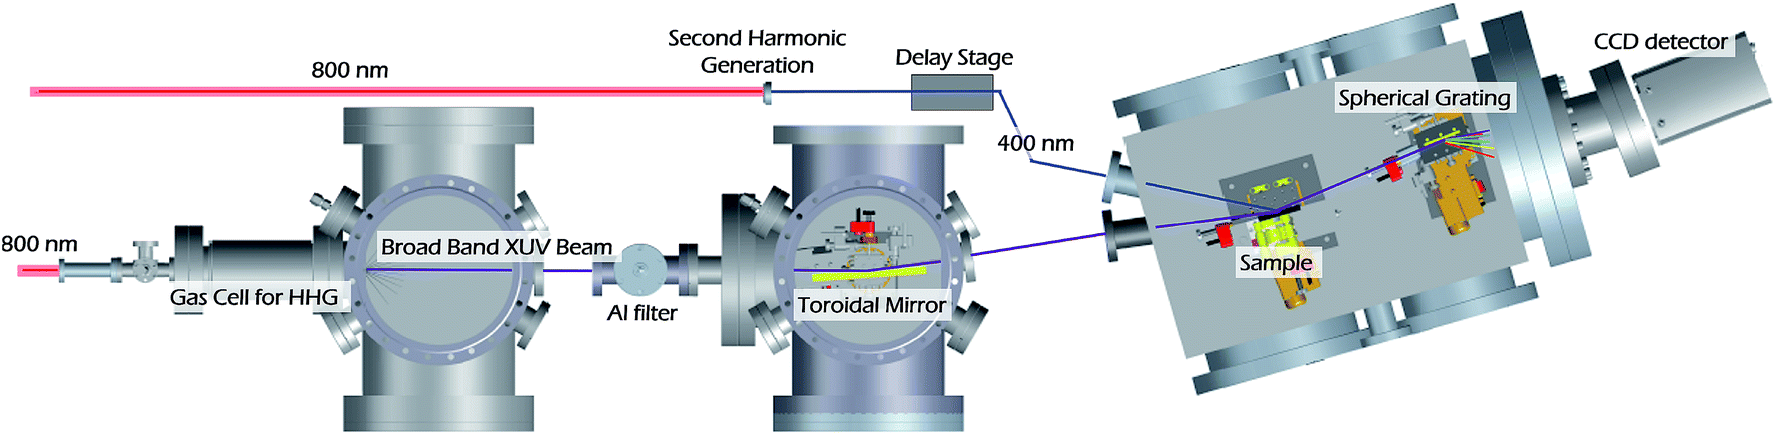 | ||
| Fig. 2 Overview of the XUV reflection-absorption spectrometer. High harmonic generation (HHG) occurs in a semi-infinite gas cell (SIGC) by a two color driving field (2 mJ at 800 nm and 40 μJ at 400 nm). The neon pressure in the gas cell is 75 Torr. Once generated, the remaining 800 nm driving field is removed by a 0.65 μm Al filter which only transmits the XUV flux up to 72 eV. The XUV beam is focused onto the sample by a toroidal mirror and spectrally dispersed onto a CCD camera by a spherical grating. The 400 nm pump beam is focused onto a sample by a 50 cm focal length lens. Once reflected off the sample, the pump beam is collected by a beam block to prevent any stray light from detection. | ||
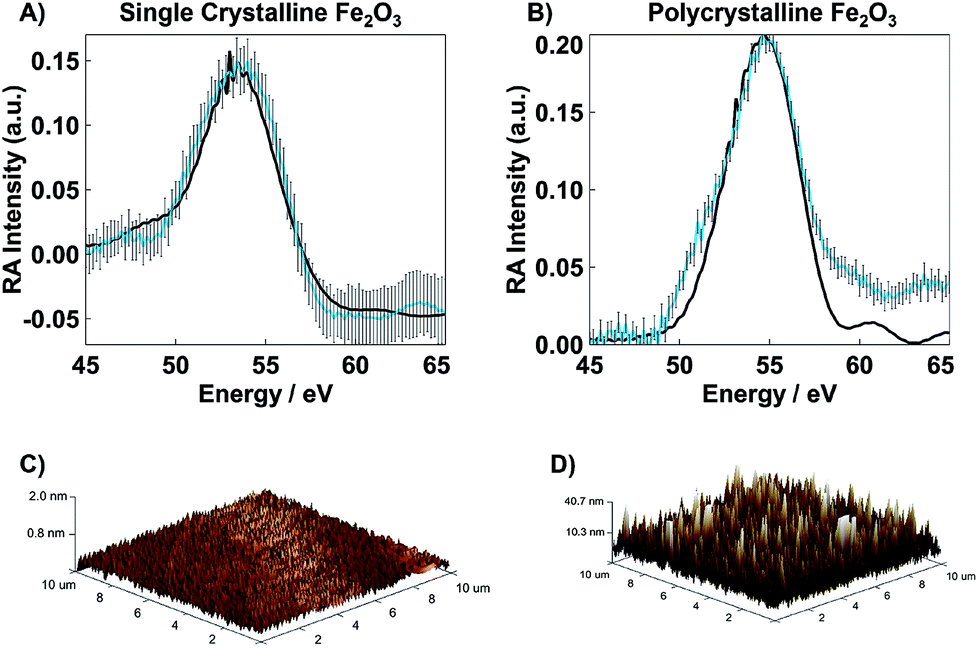 | ||
| Fig. 3 Overlaid experimental (blue) and simulated (black) RA spectra for (A) SC Fe2O3 and (B) PC Fe2O3 along with their error bars which represent the standard deviation at each data point. The only adjustable parameter in the simulated spectra is a relative, wavelength-independent offset in the real part of the refractive index, n, which considers the relative surface roughness of the samples. (C) AFM image for SC Fe2O3 (Rq < 0.2 nm), and (D) AFM image for PC Fe2O3 (Rq = 10 nm). | ||
2.2 Physical measurements
The two-color generating field is removed by a thin Al foil filter (0.65 μm, Lebow) placed 800 mm from the exit of the SIGC. This filter also limits the XUV flux to a maximum attainable energy of ∼72 eV, corresponding to the L-edge absorption of Al. The XUV beam is focused onto the sample using a toroidal mirror (ARW, rt = 13![[thin space (1/6-em)]](https://www.rsc.org/images/entities/char_2009.gif) 747 mm, rs = 66.98 mm). The incidence angle of the XUV beam on the sample is 82° relative to surface normal, and the beam size on the sample is 1.01 ± 0.02 mm and 0.137 ± 0.002 mm FWHM in the tangential and sagittal axes, respectively. The pump beam is incident on the sample at 70° relative to surface normal (pump area – 2.43 mm2). The XUV beam reflected from the sample is then spectrally dispersed using an aberration-corrected concave variable line spaced grating (average of 1200 l mm−1, Hitachi) onto a CCD detector (Newton DO920P-BN, Andor), while the reflected pump beam is collected by a beam block to prevent any stray light from reaching the detector. The spectral resolution of the spectrometer is 200 meV.
747 mm, rs = 66.98 mm). The incidence angle of the XUV beam on the sample is 82° relative to surface normal, and the beam size on the sample is 1.01 ± 0.02 mm and 0.137 ± 0.002 mm FWHM in the tangential and sagittal axes, respectively. The pump beam is incident on the sample at 70° relative to surface normal (pump area – 2.43 mm2). The XUV beam reflected from the sample is then spectrally dispersed using an aberration-corrected concave variable line spaced grating (average of 1200 l mm−1, Hitachi) onto a CCD detector (Newton DO920P-BN, Andor), while the reflected pump beam is collected by a beam block to prevent any stray light from reaching the detector. The spectral resolution of the spectrometer is 200 meV.
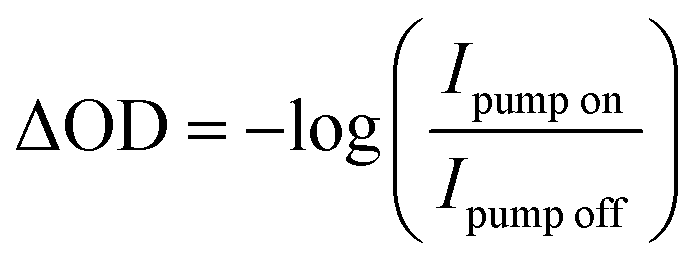
Transient M2,3-edge spectra are recorded by rastering the sample in a grid-like pattern where a horizontal step size is 500 μm and a vertical step size is 300 μm. At each point, a set of two spectra are collected: first, both pump and probe beams are incident on the sample (transient spectrum), and second, the pump beam is blocked and only the probe beam is incident on the sample (reference spectrum). The integration time for both transient and reference spectra is 3 s. A linear stage with ≤1 μm bidirectional repeatability (Newport, ILS150CC) is used to control the time delay between pump and probe pulses. Our transient spectra are calculated viaeqn (1)
 | (1) |
2.3 RA simulations
The methods for simulating RA spectra have also been described in a recent publication.22 To summarize: we begin by (1) simulating a ground-state absorption spectrum using charge transfer multiplet code developed by de Groot and co-workers (CTM4XAS),26,27 (2) derive from it the imaginary part of the refractive index using classical electromagnetic theory, (3) obtain the real part of the refractive index via the Kramers–Kronig transformation, and (4) use the Fresnel coefficient corrected for non-resonant surface scattering (Debye–Waller factor) to derive the RA spectrum. Characterization of SC and PC samples by XPS, XRD, and AFM (Fig. S1 and S2 in ESI† and Fig. 3) confirms the oxidation state assignment, phase purity, and relative roughness used for the Debye–Waller correction, and the parameters used for obtaining n and k for octahedrally-coordinated Fe2+ and Fe3+ metal centers are given in the ESI (Table S2†). The ligand field multiplet parameters used to obtain the initial transmission spectrum of Fe2O3 in the ground state are taken from a previous study by Leone and co-workers on ultrafast XUV transmission spectroscopy of Fe2O3.52.4 Global fit analysis
Global fit analysis of the time-resolved data was performed using the software package Glotaran.28 The data was fit using two 1st-order kinetic components that evolve sequentially into separable (i.e., linearly related) spectral components with finite lifetimes. Singular value decomposition is used to explore the number of spectrally and temporally independent components in the data matrix. We find that our fit to a two kinetic component model provides excellent agreement with the experimental data, with negligible improvement attained with higher order fits. To account for instrumental resolution, the kinetic model is convolved with a Gaussian instrument response function, for which we find a width of 86 ± 30 fs (Fig. S4 in ESI†).3 Results and discussion
The static XUV-RA spectra for SC and PC Fe2O3 (blue traces) and their corresponding simulations (black traces) are given in Fig. 3A and B, respectively. Though the local coordination environment for the Fe3+ metal centers and bulk phase of the two materials are nearly identical, the resulting RA spectra are distinguishable, with a ∼1 eV bathochromic shift of the SC material relative to the PC. We have previously shown that this is a result of measuring a dispersive line shape and the relative surface morphology of the two materials, where an increased roughness leads to a slightly lower apparent refractive index (n).22 This recent work on the spectral simulations of RA spectra for various 3d transition metal oxides confirms that the element and chemical state resolution previously reported for XUV absorption spectroscopy is preserved in reflection spectroscopy, albeit with the added benefit of surface sensitivity.22Transient XUV-RA spectra on SC and PC Fe2O3 (Fig. 4) were collected by exciting the samples with a pump beam centered at 400 nm (P = 190 mW; area = 2.43 mm2) corresponding to a direct O2p2− → Fe3d3+ interband transition.29 This excitation fluence was selected to closely reproduce the power density of previous 400 nm pump/XUV probe experiments.5,30 The higher overall fluence in these experiments is required because in grazing angle reflectivity the pump beam spreads significantly along the tangential axis of the sample, resulting in a much larger excitation area. Previous work using ultrafast visible transient absorption suggests that initial excitation at 400 nm leads to a thermal distribution of electrons across the iron-based eg- and t2g-conduction bands, which subsequently relaxes to the t2g-conduction band edge within 250 fs, and proceeds to live in this excited state for hundreds of ps to ns.6,7 However, the origin of this long-lived species and the placement of the major charge carriers with respect to the catalyst surface remains an open and vital question.
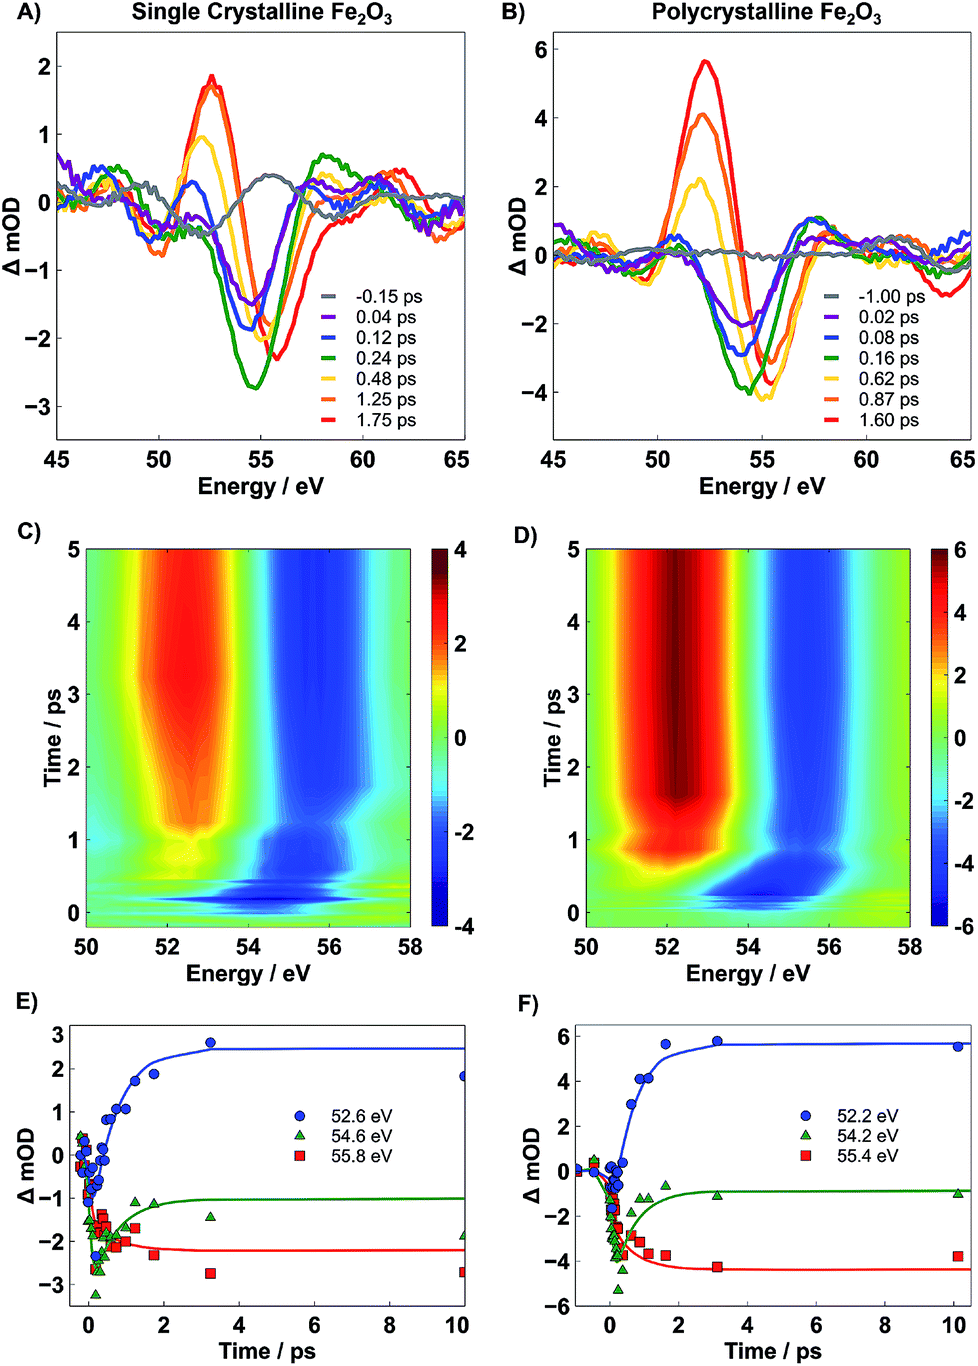 | ||
| Fig. 4 Select transient XUV RA spectra for SC (A) and PC (B) Fe2O3 after photoexcitation at 400 nm depicting the spectral evolution up to ∼2 ps post-excitation. (C and D) are the experimental contour plots for SC and PC Fe2O3, respectively, up to 5 ps post-excitation. Between (A) and (D), photoexcitation of hematite at 400 nm initially leads to a bleach feature centered at 54.2 eV, which evolves into a second transient feature, containing both a positive (52.2 eV) and negative (55.4 eV) feature after ∼660 fs. (E, F) Kinetic traces at ∼52.5, ∼54.5, and ∼55.6 eV for SC and PC Fe2O3, respectively, up to 10 ps post-excitation. Marks are experimental data and solid lines are a result of a global fit using Glotaran. | ||
Immediately after photoexcitation, a spectral bleach centered at 54 eV is observed. This bleach signifies the depopulation of the ground state and grows with a time constant of ∼90 fs, corresponding to the instrument response function of the spectrometer. After ∼660 fs, the bleach evolves into a second transient state where a positive feature centered at 52 eV grows in and a concomitant 1 eV blue-shift in the bleach is observed. The evolution of the transient spectra to the new feature continues for ∼1 ps, and no further spectral evolution is observed for time delays as long as 350 ps. The select traces in Fig. 4A and B reveal that the two different transient states are nearly identical between the SC and PC samples, and the contour plots in Fig. 4C and D indicate that, despite the differences observed in the ground state spectra, both SC and PC hematite follow nearly identical kinetics.
From the qualitative perspective of XUV spectroscopy, it is known that the M-edge transition energy decreases with lower oxidation state. In a one electron reduction of Fe3+ to Fe2+, we anticipate a bleach feature at the resonant position of Fe3+ and a corresponding red-shifted positive peak of newly formed Fe2+. Indeed, the measured experimental spectrum agrees well with this qualitative picture. To quantify the kinetic evolution of the charge transfer states in both hematite samples, a global fitting analysis using Glotaran was performed on time traces collected over the probed 350 ps temporal window.28 The associated spectra predicted by the sequential model are given in Fig. 5A for PC (see Fig. S7 in the ESI† for SC). Higher order fits show minimal improvement and provide no further insight into the mechanism, and thus, are not considered further. The accuracy of the global fit to this two-step sequential model is shown in the form of kinetic traces centered at 52.2, 54.2, and 55.4 eV in Fig. 4E and F, where these energies correspond to the rising positive, early bleach, and late bleach features, respectively. Symbols represent experimental data points, and the lines represent results of the corresponding global fit. The associated lifetimes for the initial transient of SC and PC Fe2O3 are given in Table 1; since the second transient state does not decay within the temporal window accessible by our delay stage, a lifetime was not able to be reliably measured.
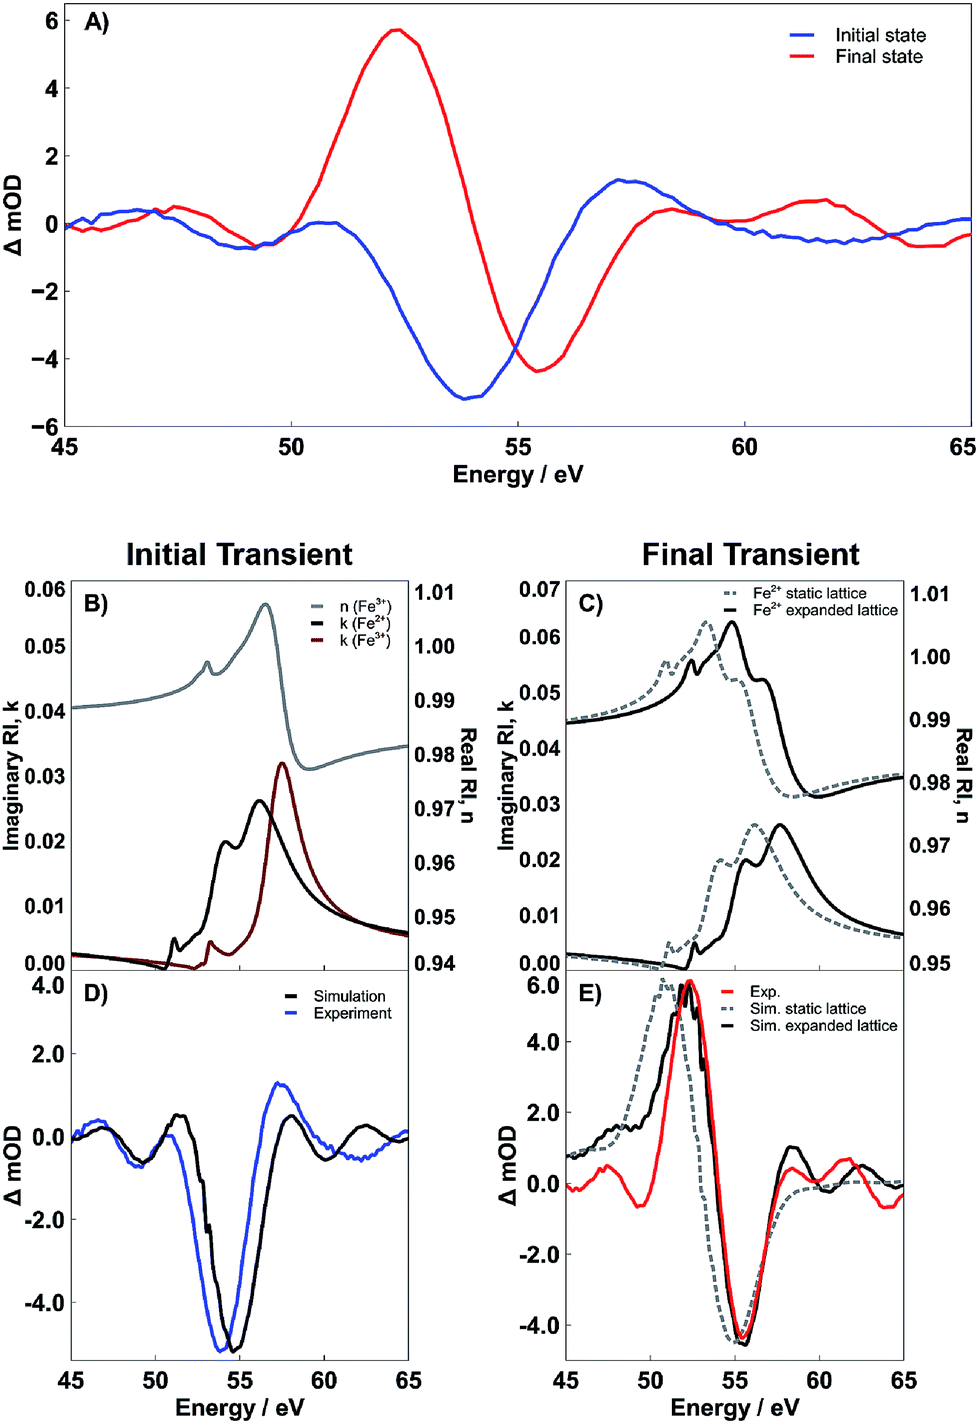 | ||
| Fig. 5 (A) Evolution associated spectra derived by Glotaran for the initial (blue) and final (red) transient spectra of PC Fe2O3. (B) Real part of the refractive index of Fe3+ (gray) and imaginary parts of the refractive index of Fe3+ (dark red) and Fe2+ (black). (C) Real and imaginary parts of the refractive index for Fe2+ with (black) and without (dashed gray) a 1.5 eV energy shift. (D) Experimental (blue) and simulated difference spectrum (black) associated with the initial excited state. This state corresponds to an RA spectrum where n has yet to respond to the formation of the LMCT state, while k already has. (E) Difference spectra resulting from shifted (black) and unshifted (dashed gray) real and imaginary parts of the refractive index for Fe2+. The shifted spectrum is an excellent match to the experimental spectrum (red). | ||
| Roughness/nm | τ 1/fs | τ 2/fs | |
|---|---|---|---|
| SC Fe2O3 | <0.2 | 680 ± 30 | ∞ |
| PC Fe2O3 | 10 | 640 ± 20 | ∞ |
We find that the lifetime of the first transient state is not statistically different between SC and PC Fe2O3, where each material exhibits an initial state lifetime on the order of ∼660 fs. It is important to note that both these measured time constants are unique to transient XUV RA spectroscopy and are 2–3 fold longer than what is observed in either XUV or optical transmission measurements.5–8 The significantly different kinetics observed for near-grazing-angle reflectivity measurements, having a probe depth of only several nm, indicate that the surface carrier dynamics in hematite differ substantially from the corresponding bulk carrier dynamics. As described below, these unique kinetics correspond to localization of photoexcited electrons to the hematite surface. We also show that the observed surface electron trapping is closely correlated with small polaron formation, suggesting that the lattice expansion associated with small polaron formation represents the driving force for carrier localization and trapping at the hematite surface.
Interpretation of the transient dynamics in XUV RA spectroscopy requires knowledge of n and k for both the ground and transient excited states involved in photoexcitation. We acknowledge that though it is possible to use standard mathematical transformations, such as the Fresnel coefficient and Kramers–Kronig relations, to convert the RA difference spectra to a purely transmission difference spectra (i.e., where the contribution of the real part of the refractive index has been suppressed), we find that to report on the surface-specific states it is necessary to retain the contribution of the real part of the refractive index. Multiple ultrafast experiments performed in transmission using both visible light6 and XUV5 probes have assigned the initial photoexcited state in 400 nm pumped hematite as an LMCT state, where an electron is transferred from an O2− 2p-band to the Fe3+ 3d-band. Taking this mechanism into account, we calculate both the real and imaginary components of the complex refractive index corresponding to this previously observed Fe2+ photoexcited LMCT state. Fig. 5 shows the results of these calculations as well as the effect that the real and imaginary refractive indices have on the time-dependent spectral evolution following photoexcitation. Part B of Fig. 5 shows the real and imaginary part of the refractive index corresponding to the Fe3+ ground state (gray and dark red lines, respectively), as well as the imaginary part for the Fe2+ LMCT excited state (black line). The imaginary parts are directly proportional to the transmission spectra, and the difference reflects the initial transient spectrum previously observed in an XUV transient absorption spectrum.5 In contrast, to make the same comparison in the present reflectivity measurement, it is necessary to compute the reflectance spectrum for each state and then take the RA difference spectrum before and after photoexcitation. This is easily accomplished using the complex Fresnel factor but requires input of the real part of the refractive index for both the ground and excited state. We find that the initial experimental transient spectrum shown in blue in Fig. 5A is accurately described by considering that the real part of the refractive index remains unchanged during the early time period following photoexcitation, while the imaginary part of the refractive index responds immediately (i.e. within the instrument response function) to the photoexcitation. The close correlation between this simulated LMCT state and the measured transient reflectivity spectrum is shown in Fig. 5D. This interpretation where n and k respond to photoexcitation on different time scales may initially seem to violate the hypotheses of the Kramers–Kronig relations, which define a strict mathematical relationship between the two parts of the complex refractive index. However, this seeming discrepancy can be understood by considering that the real and imaginary parts of the refractive index have separate probe depths as sampled in a near-grazing-angle reflection experiment (see ESI Section 4 and Fig. S9† for further details). Specifically, the induced polarization at a material surface leading to the measured specular reflection is subject to absorptive damping for the case of a resonant substrate. This absorptive damping occurs over the entire volume of the induced polarization and is reflected exclusively in the imaginary part of the refractive index, k. This indicates that while the combined modulus of n and k is specifically sensitive to a material interface, k alone will sample the sub-surface with a probe depth determined by the spatial distribution of the induced polarization. We have recently carefully characterized this probe depth and find that for these experiments it is on the order of 3 nm.22 Accordingly, we postulate that the transient signal corresponding to the initial state is composed of an n corresponding to an Fe3+ ground state and a k corresponding to an Fe2+ excited state. This assignment reflects the delocalized character of the initial excited state, where immediately following photoexcitation, the excited electrons are distributed evenly with respect to sample depth and have not yet localized to the hematite surface.
To understand the observed time evolution in the transient RA spectra, we now consider the spectral change that results when both real and imaginary components of the refractive index respond to the LMCT excitation. This subsequent change in n is shown in Fig. 5C and the corresponding difference between ground and excited state RA spectra is shown in Fig. 5E. As shown, this time dependent evolution of the real part of the refractive index accurately describes the ∼660 fs evolution between initial and final states in the measured spectra for both SC and PC hematite (see Fig. S7 in the ESI† for corresponding simulations for SC Fe2O3). Based on the complex Fresnel factor, reflectance is sensitive to the change in dispersion across an interface and our data suggests that this is extremely sensitive to the electronic response at a material surface. Accordingly, we assign the delayed response to photoexcitation observed in the real part of the refractive index to the time scale for electron trapping at the hematite surface. This process has not previously been observed in transient absorption experiments because the ability to simultaneously measure both parts of the complex refractive index is required to identify the signature of surface electron trapping, which is evident here via the time dependent evolution of n at the M2,3-edge resonance. Consequently, the observed evolution of n and k on separate time scales arises due to their independent probe depths, and the underlying process of bulk excitation followed by surface electron localization is depicted schematically in Fig. 6.
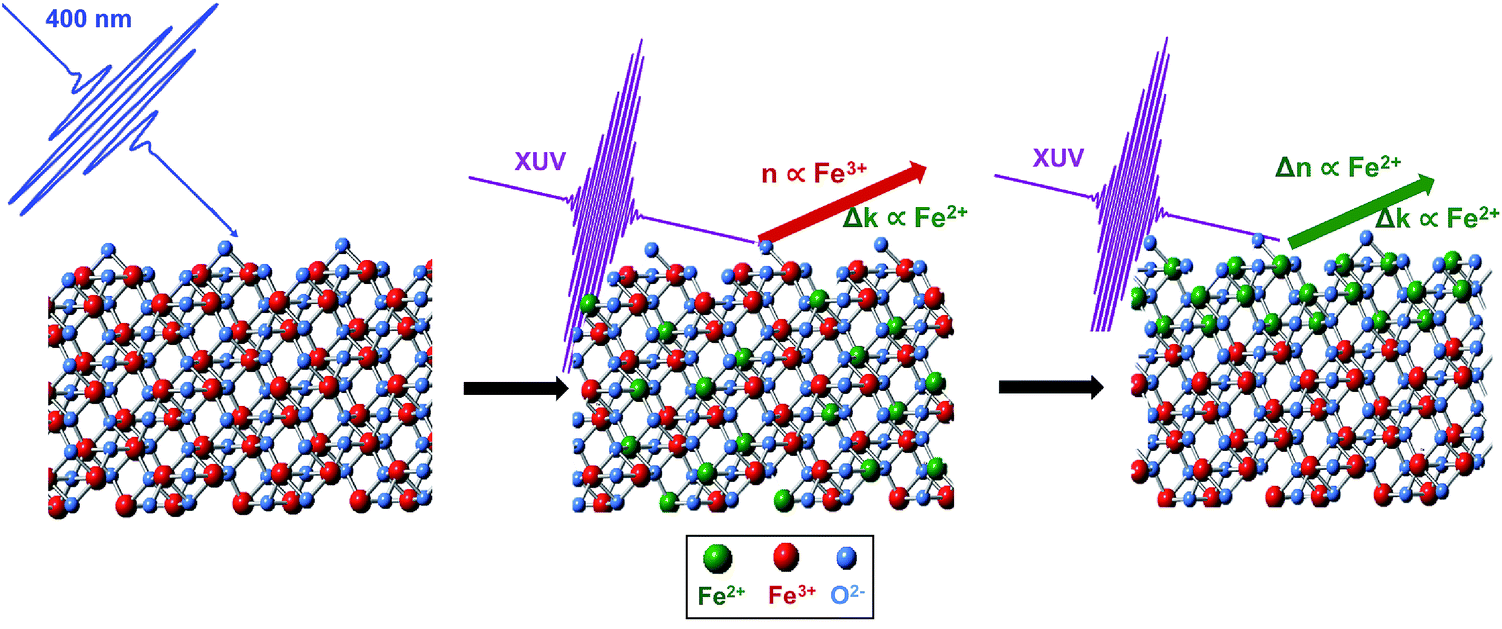 | ||
| Fig. 6 Fe2O3 is initially photoexcited by a 35 fs pulse of 400 nm light. The delocalized charge carriers give rise to an RA spectrum which is composed of both Fe2+k and Fe3+n character. Over the next ∼660 fs, the excited charge carriers migrate to the surface, and the resulting RA spectra have Fe2+n and k character. | ||
To better understand the driving force for surface electron trapping in both SC and PC Fe2O3, we last discuss the correlation between surface electron trapping and small polaron formation in hematite. The formation of a small polaron around a photoexcited Fe2+ metal center has been proposed both theoretically9 and experimentally10 to explain this fast trapping of charge carriers, however, its direct observation has remained a major challenge. Importantly, it has been suggested that the surface states of hematite are specifically involved in the self-trapping process under catalytic conditions.20 However, direct observation of surface versus bulk polaron formation is not possible from a transmission measurement alone. Below we show that XUV RA spectroscopy reveals that surface electron trapping and small polaron formation occur concomitantly, confirming predictions that increased structural degrees of freedom at the oxide surface favor the surface segregation of small polarons,31 and that this effect represents the likely driving force for the observed surface trapping of photoexcited electrons.
Fig. 5E shows the final measured transient spectrum (red line) compared to results from two different spectral simulations. The first simulation (gray dashed line) shows the predicted transient spectrum for an LMCT Fe2+ excited state assuming no shift relative to the initial excited state spectrum depicted in Fig. 5B. As seen, this simulation qualitatively matches the experimentally observed transient, but the experimental spectrum is significantly blue shifted relative to the simulation. To better reproduce the measured transient spectrum, it is necessary to shift the simulated Fe2+ RA spectrum hypsochromically by 1.5 eV. The black lines in Fig. 5C and E reflect the results of this 1.5 eV blue shift on the complex refractive index of the Fe2+ (Fig. 5C) and on the corresponding difference RA spectrum (Fig. 5E). As shown by the quantitative alignment of red and black curves in Fig. 5E, the 1.5 eV shift to higher energy is required to reproduce the experimentally observed transient state. These spectra represent results specifically for PC Fe2O3. However, analogous results are provided in the ESI (Fig. S7†), showing that SC Fe2O3 follows an identical trend. As detailed below, we assign this spectral blue shift as the signature of lattice expansion around a photoexcited Fe2+ metal center, which is, in essence, the structural definition of small polaron formation via lattice expansion.
However, the observed strong spectral blue shift is most easily understood by considering the final state effects that determine the transition energy of core-hole resonances via screening of electron/core-hole interactions. Referring back to Fig. 1, we note that the lattice expansion will reduce the contribution of the O2− 2p density of states to the local electronic structure of the metal center (i.e., decreased covalency). Given that these measurements probe a core-to-valence transition, the relative blue-shift is the result of a quantum mechanical final state effect, where the decrease in electron density from O2− 2p sub-bands reduces core-hole screening, thus increasing the energy of the final state and the measured M-edge transition.32 This explanation is consistent with previous X-ray absorption measurements, which investigated the effect of covalency over the Ni K-edge X-ray absorption spectrum in Fe3+-doped NiO. These studies showed that decreased covalency correlated with an increase in energy of the metal core-to-valence transition, resulting from an increase in Mott–Hubbard insulator character.33
We have considered several other possible explanations for the observed spectral blue shift. They include (1) excited state spin crossover during an Fe2+ high spin to low spin transition, (2) anisotropic lattice distortions around the excited Fe2+ metal center in the polaronic state, (3) energy shifts in Fe 3d orbitals based on reduction of the crystal field splitting, and (4) possible energy shifts of the 3p Fe core levels. We refer the reader to the ESI† for a detailed discussion of the spin crossover which cannot explain the spectral blue shift observed here. We have also simulated the excited state spectrum with a number of crystal field geometries (not shown) to observe how various possible polaronic lattice distortions would affect the measured spectral shape; however, the observed hypsochromic shift could not be reproduced in these calculations. To consider how a reduction in crystal field splitting would affect the energy of Fe 3d orbitals, we note that the measured M-edge spectrum represents a 3p to 3d transition, so an increase in the energy of the molecular orbitals with Fe 3d character would be required to rationalize the measured spectral blue shift. Two unoccupied Fe 3d orbitals exist in the valence band of Fe2O3: the T2g nonbonding states the Eg antibonding states. An LMCT transition will serve to decrease the bond order, leading to a reduction in crystal field splitting. This is expected to have a negligible effect on the T2g nonbonding orbitals, and to lower the energy of the Eg antibonding orbitals. Consequently, shifts in the Fe 3d energy levels are also unable to explain the present experimental observations. Lastly, an energy shift of the core levels has been postulated previously to explain shifts in the X-ray absorption energy.34 Such a shift in the energy of core orbitals would be difficult to differentiate from final state effects as described above, and we conclude that the observed 1.5 eV hypsochromic shift may be a combination of these two factors.
To further support the concept of lattice expansion, we also note that in order to obtain the simulations given in Fig. 5D and E, the Fe3+ metal center is modeled with a crystal field splitting (CFS) of 1.45 eV, while the Fe2+ metal center is calculated as having a CFS of 1.10 eV. Assuming no change in the CFS between ground and excited states fails to accurately reproduce the experimentally observed excited state because, at a constant CFS of 1.45 eV, the Fe2+ would reside in the low-spin state owing to the difference in spin pairing energies between the d5 Fe3+ and d6 Fe2+ metal centers.35,36 The timescale for spin transitions in iron complexes falls within the temporal resolution of our instrument, and thus, would readily be observed if they occurred;37–39 the reader is directed to the ESI (Fig. S6†) for simulations of the low-spin, or static lattice, state. This result suggests that the photoexcitation is accompanied by a reduction in the CFS around a photoexcited Fe2+ metal center. Physically, if we consider a purely σ-bonding, octahedrally-coordinated transition metal complex, then changes in CFS arise due to a change in local σ-bonding strength. An increase in metal–ligand σ-bonding leads to an increase in the CFS energy, while a weakening in the bonding leads to a decrease in CFS. In other words, a decrease in σ-bonding strength between the metal center and the ligands decreases the energy of the metal-centered anti-bonding eg orbitals and vice versa. This model, therefore, supports the conclusion that the local σ-bonding of the iron center is weakened by the LMCT transition, and thus expansion of the surrounding oxide lattice about the metal center occurs.
In summary, the spectral evolution between initial and final states observed in the experimental RA spectra reflect two processes occurring at identical time constants: first, the time-dependent evolution of the real part of the refractive index reflects the localization of photoexcited electrons to the hematite surface. Second, the 1.5 eV spectral blue shift in the Fe2+ LMCT excited state reflects the increased transition energy resulting from an expansion of the oxide lattice corresponding to carrier self-trapping via small polaron formation. Noting that both processes occur with a correlated time constant of 680 ± 30 fs for SC Fe2O3 and 640 ± 20 fs for PC Fe2O3, we hypothesize that surface segregation of small polarons in hematite represents the likely driving force for the observed surface electron trapping.
4 Conclusion
Ultrafast XUV RA spectroscopy was performed at the Fe M2,3-edge on SC and PC Fe2O3 following photoexcitation at 400 nm. Comparison of experimental data with spectral simulations reveals that the real (n) and imaginary (k) parts of the refractive index evolve on separate time scales. Specifically, we find that the real part of the refractive index remains unchanged during the early time period following photoexcitation, while the imaginary part of the refractive index responds to photoexcitation within the 90 fs instrument response. This time dependent evolution of the real part of the refractive index accurately describes the sub-ps time evolution between initial and final states in the measured spectra for both SC and PC hematite. We assign the delayed response in the real part of the refractive index to the time scale for electron trapping at the hematite surface. These results show that photoexcitation of hematite leads to an initially delocalized LMCT electronic state, where the electrons subsequently trap at the hematite surface. The measured kinetics for SC and PC Fe2O3 reveal that the rate of surface trapping is relatively insensitive to the crystallinity of the material, where a time constant of 680 ± 30 fs is observed for SC Fe2O3 and a time constant of 640 ± 20 fs is observed for PC Fe2O3. These results suggest that surface carrier dynamics in hematite are only mildly influenced by grain boundaries and surface defects. However, correlated time constants are observed for surface electron trapping and small polaron formation. This correlation suggests that lattice expansion at a hematite surface during small polaron formation is the likely trap state responsible for the observed sub-ps surface electron localization. These results provide an important understanding of the surface electron dynamics mediating energy conversion efficiency in this earth-abundant catalyst and highlight the ability of XUV RA spectroscopy to uniquely follow surface carrier dynamics in catalytically relevant materials.Conflicts of interest
There are no conflicts of interest to declare.Acknowledgements
Measurement of time-resolved XUV RA spectra was supported by the Air Force Office of Scientific Research under AFOSR award number FA9550-15-1-0204. Semi-empirical calculation of XUV RA spectra was supported by the Department of Energy under DOE award number DE-SC0014051. We also thank Quinn Baker as well as the OSU Chemistry and Biochemistry machine shop for work on the design and construction of the XUV spectrometer. Sample preparation and characterization was performed at the Nanosystems Laboratory and the Surface Analysis Laboratory at the Ohio State University.References
- J. Wang, B. Feng, J. Su and L. Guo, ACS Appl. Mater. Interfaces, 2016, 8, 23143–23150 CAS.
- Y. Zhang, H. Zhang, H. Ji, W. Ma, C. Chen and J. Zhao, J. Am. Chem. Soc., 2016, 138, 2705–2711 CrossRef CAS PubMed.
- K. Sivula, F. Le Formal and M. Grätzel, ChemSusChem, 2011, 4, 432–449 CrossRef CAS PubMed.
- F. J. Morin, Phys. Rev., 1954, 93, 1195–1199 CrossRef CAS.
- J. Vura-Weis, C.-M. Jiang, C. Liu, H. Gao, J. M. Lucas, F. M. F. de Groot, P. Yang, A. P. Alivisatos and S. R. Leone, J. Phys. Chem. Lett., 2013, 4, 3667–3671 CrossRef CAS.
- S. Sorenson, E. Driscoll, S. Haghighat and J. M. Dawlaty, J. Phys. Chem. C, 2014, 118, 23621–23626 CAS.
- S. R. Pendlebury, X. Wang, F. Le Formal, M. Cornuz, A. Kafizas, S. D. Tilley, M. Grätzel and J. R. Durrant, J. Am. Chem. Soc., 2014, 136, 9854–9857 CrossRef CAS PubMed.
- A. G. Joly, J. R. Williams, S. A. Chambers, G. Xiong, W. P. Hess and D. M. Laman, J. Appl. Phys., 2006, 99, 053521 CrossRef.
- K. M. Rosso, D. M. A. Smith and M. Dupuis, J. Chem. Phys., 2003, 118, 6455–6466 CrossRef CAS.
- J. E. Katz, X. Zhang, K. Attenkofer, K. W. Chapman, C. Frandsen, P. Zarzycki, K. M. Rosso, R. W. Falcone, G. A. Waychunas and B. Gilbert, Science, 2012, 337, 1200–1203 CrossRef CAS PubMed.
- L. R. Baker, G. Kennedy, M. Van Spronsen, A. Hervier, X. Cai, S. Chen, L.-W. Wang and G. A. Somorjai, J. Am. Chem. Soc., 2012, 134, 14208–14216 CrossRef CAS PubMed.
- F. Tao, S. Dag, L.-W. Wang, Z. Liu, D. R. Butcher, H. Bluhm, M. Salmeron and G. A. Somorjai, Science, 2010, 327, 850–853 CrossRef CAS PubMed.
- S. Cao, F. F. Tao, Y. Tang, Y. Li and J. Yu, Chem. Soc. Rev., 2016, 45, 4747–4765 RSC.
- M. F. Kuehnel, K. L. Orchard, K. E. Dalle and E. Reisner, J. Am. Chem. Soc., 2017, 139, 7217–7223 CrossRef CAS PubMed.
- C.-Y. Wu, W. J. Wolf, Y. Levartovsky, H. A. Bechtel, M. C. Martin, F. D. Toste and E. Gross, Nature, 2017, 541, 511–515 CrossRef CAS PubMed.
- D. M. Herlihy, M. M. Waegele, X. Chen, C. Pemmaraju, D. Prendergast and T. Cuk, Nat. Chem., 2016, 8, 549–555 CrossRef CAS PubMed.
- B. L. Hendriksen, M. D. Ackermann, R. Van Rijn, D. Stoltz, I. Popa, O. Balmes, A. Resta, D. Wermeille, R. Felici and S. Ferrer, et al. , Nat. Chem., 2010, 2, 730–734 CrossRef CAS PubMed.
- D. G. Nocera, Acc. Chem. Res., 2012, 45, 767–776 CrossRef CAS PubMed.
- F. F. Tao, Angew. Chem., Int. Ed., 2016, 55, 15212–15214 CrossRef CAS PubMed.
- O. Zandi and T. W. Hamann, Nat. Chem., 2016, 8, 778–783 CrossRef CAS PubMed.
- P. Liao and E. A. Carter, Phys. Chem. Chem. Phys., 2011, 13, 15189–15199 RSC.
- A. Cirri, J. Husek, S. Biswas and L. R. Baker, J. Phys. Chem. C, 2017, 121, 15861–15869 CAS.
- C. Bohren and D. Huffman, Absorption and Scattering of Light by Small Particles, John Wiley and Sons, Inc., New York, 1983 Search PubMed.
- J. B. Goodenough, Chem. Mater., 2013, 26, 820–829 CrossRef.
- M.-F. Lin, M. A. Verkamp, E. S. Ryland, K. Zhang and J. Vura-Weis, J. Opt. Soc. Am. B, 2016, 33, 1986–1992 CrossRef CAS.
- F. M. F. de Groot, Coord. Chem. Rev., 2005, 249, 31–63 CrossRef CAS.
- E. Stavitski and F. M. F. de Groot, Micron, 2010, 41, 687–694 CrossRef CAS PubMed.
- J. Snellenburg, S. Laptenok, R. Seger, K. Mullen and I. van Stokkum, Journal of Statistical Software, 2012, 49, 1–22 CrossRef.
- L. A. Marusak, R. Messier and W. B. White, J. Phys. Chem. Solids, 1980, 41, 981–984 CrossRef CAS.
- C.-M. Jiang, L. R. Baker, J. M. Lucas, J. Vura-Weis, A. P. Alivisatos and S. R. Leone, J. Phys. Chem. C, 2014, 118, 22774–22784 CAS.
- C. Di Valentin and A. Selloni, J. Phys. Chem. Lett., 2011, 2, 2223–2228 CrossRef CAS.
- W. Egelhoff, Surf. Sci. Rep., 1987, 6, 253–415 CrossRef.
- N. Li, D. K. Bediako, R. G. Hadt, D. Hayes, T. J. Kempa, F. von Cube, D. C. Bell, L. X. Chen and D. G. Nocera, Proc. Natl. Acad. Sci. U. S. A., 2017, 114, 1486–1491 CrossRef CAS PubMed.
- M. L. Shelby, P. J. Lestrange, N. E. Jackson, K. Haldrup, M. W. Mara, A. B. Stickrath, D. Zhu, H. T. Lemke, M. Chollet, B. M. Hoffman, X. Li and L. X. Chen, J. Am. Chem. Soc., 2016, 138, 8752–8764 CrossRef CAS PubMed.
- J. S. Griffith, J. Inorg. Nucl. Chem., 1956, 2, 1–10 CrossRef CAS.
- J. S. Griffith and L. E. Orgel, Q. Rev., Chem. Soc., 1957, 11, 381–393 RSC.
- N. Huse, T. K. Kim, L. Jamula, J. K. McCusker, F. M. de Groot and R. W. Schoenlein, J. Am. Chem. Soc., 2010, 132, 6809–6816 CrossRef CAS PubMed.
- S. Zerdane, L. Wilbraham, M. Cammarata, O. Iasco, E. Rivière, M.-L. Boillot, I. Ciofini and E. Collet, Chem. Sci., 2017, 8, 4978–4986 RSC.
- G. Auböck and M. Chergui, Nat. Chem., 2015, 7, 629–633 CrossRef PubMed.
Footnote |
| † Electronic supplementary information (ESI) available. See DOI: 10.1039/c7sc02826a |
| This journal is © The Royal Society of Chemistry 2017 |