
 Open Access Article
 This Open Access Article is licensed under a
 Creative Commons Attribution 3.0 Unported Licence
Mechanism and performance of lithium–oxygen batteries – a perspective
Nika
Mahne
a,
Olivier
Fontaine
bc,
Musthafa Ottakam
Thotiyl
d,
Martin
Wilkening
 a and
Stefan A.
Freunberger
*a
a and
Stefan A.
Freunberger
*a
aInstitute for Chemistry and Technology of Materials, Graz University of Technology, Stremayrgasse 9, 8010 Graz, Austria. E-mail: freunberger@tugraz.at
bInstitut Charles Gerhardt Montpellier, UMR 5253, CC 1701, Université Montpellier, Place Eugène Bataillon, 34095 Montpellier Cedex 5, France
cRéseau sur le Stockage Electrochimique de l'énergie (RS2E), FR CNRS, France
dDepartment of Chemistry, Indian Institute of Science Education and Research (IISER), Dr Homi Bhabha Road, Pashan, Pune, 411008, India
First published on 31st July 2017
Abstract
Rechargeable Li–O2 batteries have amongst the highest formal energy and could store significantly more energy than other rechargeable batteries in practice if at least a large part of their promise could be realized. Realization, however, still faces many challenges than can only be overcome by fundamental understanding of the processes taking place. Here, we review recent advances in understanding the chemistry of the Li–O2 cathode and provide a perspective on dominant research needs. We put particular emphasis on issues that are often grossly misunderstood: realistic performance metrics and their reporting as well as identifying reversibility and quantitative measures to do so. Parasitic reactions are the prime obstacle for reversible cell operation and have recently been identified to be predominantly caused by singlet oxygen and not by reduced oxygen species as thought before. We discuss the far reaching implications of this finding on electrolyte and cathode stability, electrocatalysis, and future research needs.
 Nika Mahne | Nika Mahne obtained her M.Sc. in Chemistry from Graz University of Technology, Austria, and is now Ph.D. student with Stefan Freunberger. Her research is focused on new materials for metal–O2 batteries and in situ and ex situ spectroscopic and analytical methods to elucidate reaction mechanisms, particularly also parasitic chemistry with singlet oxygen. |
 Olivier Fontaine | Olivier Fontaine obtained M.Sc. and Ph.D. in Electrochemistry of ionic liquids from the University Diderot, Paris. After post docs at the Collége de France, Paris and the University of St. Andrews, UK, on Li–O2 reaction mechanism he took up his current position as a lecturer at the Institut Charles Gerhardt, University of Montpellier. He specializes at the interface of analytical electro-chemistry, the chemistry of nanomaterials and functional ionic liquids with both fundamental aspects and applications to energy storage. |
 Musthafa Ottakam Thotiyl | Muhammed Musthafa obtained his PhD in fuel cells from the Indian Institute of Science, Bangalore in collaboration with the Université Joseph Fourier, Grenoble, France. As a research associate at the University of St Andrews he investigated the fundamental (electro)chemistry of the aprotic Li–O2 battery. Since 2014 he is assistant professor at the Indian Institute of Science Education and Research, Pune, India. His research interests include energy storage and conversion and semiconductor electrochemistry with special emphasis on solar fuel production. |
 Martin Wilkening | Martin Wilkening studied Chemistry at the Leibniz University Hannover and obtained his Ph.D. in 2005 with a dissertation on ‘Ultraslow Li Motions in Solids’, which was awarded the Starck-Promotionspreis of the German Chemical Society (GDCh) and the Wissenschaftspreis Hannover. In 2009 he received the ADUC annual award of the GDCh for his contributions to spin-alignment echo NMR. Since 2011 he has been a Full Professor at the Graz University of Technology. In his workgroup, ion dynamics in solids are studied by NMR and impedance spectroscopy with a focus on nanostructured and amorphous energy materials. |
 Stefan A. Freunberger | Stefan Freunberger obtained his PhD in Chemistry from ETH Zürich and was post doc at the University of St Andrews, working on many aspects of Li–O2 chemistry. He is now PI at Graz University of Technology, Austria, with research interests embracing energy-storage materials, including alkaline-ion and metal–O2 batteries, electrolytes, and in situ techniques. His research has been recognized by the Srinivasan Young Investigator Award of The Electrochemical Society, the invited visiting professorship la Chaire Total de la Fondation Balard, elected membership of the Austrian Academy of Sciences, and an ERC Starting Grant. |
1. Introduction
Raising energy storage beyond the limits of current battery technology has become a societal demand and focus of much Frontier research. The achievable limits of Li-ion batteries with respect to energy, material sustainability and cost will likely not satisfy the needs. This motivates ambitious approaches with ‘beyond-intercalation chemistries’.1–3 They store charge instead of intercalation by fundamentally different reactions. These include replacing the graphite anode by Li metal and intercalation cathodes by the O2 cathode to form the Li–O2 (air) battery, which is considered the battery with the highest specific energy. The O2 cathode comprises a porous, electrolyte filled electron conducting matrix, wherein O2 from the ambiance is reduced on discharge to form Li2O2 and the reverse process on charge.There is lots of ambiguity of what energy a Li–O2 cell could store, despite it being the motivation for the research. The problem arises from confusing formal capacity (1168 mA h g−1, 2500 mA h cm−3 Li2O2) with theoretical capacity (Li2O2 including the minimum electron and ion conductor to allow the storage process O2 + 2e− + 2Li+ ↔ Li2O2 to take place) and achieved true capacity (Li2O2 including the used electron and ion conductor).4 We thus shall first discuss realistic performance metrics.
The Li–O2 battery combines two challenging electrodes. In most cases a Li metal anode is used, which is, despite decades of research, still associated with poor coulombic efficiencies.3 Other high capacity anodes such as Si may also be considered but likely require in either case protection against O2 ingress from the cathode. Until a couple of years ago there was hardly any knowledge on the O2/Li2O2 redox couple in aprotic media. Reactive species involved in the cycling mechanism, which challenge the stability of electrolyte and electrode material, turned out to be another critical research direction. Next to these scientific and materials challenges practical realization further faces engineering challenges with cell construction and air handling. Only understanding the science may thus form the foundation for tackling the engineering.
In this perspective we focus on the science underpinning the O2 cathode. After dealing with performance we discuss the current understanding of Li2O2 formation and decomposition on cycling, followed by measures of reversibility, mechanisms that degrade electrolyte and electrode components and porous cathode design. Potentially transformative ideas start with much enthusiasm and hyped expectations. Thereafter, illusions of low hanging fruit fall and only going the extra mile for true understanding can allow progress to continue. The field of Li–O2 batteries is now in the latter stage. Real progress has been achieved with mechanistic understanding in the last years, which now puts us in a better position than ever to state that the disillusioned view of Li–O2 never leaving the state of a cell with low capacity, rate, energy efficiency and cycle life is too pessimistic. Yet it is unclear whether it can eventually lead to a technology.
2. True performance metrics – myths, reality, and reporting standards
When performance is the argument for research work then data need to stand up to it. An alleged 5 to 10 fold theoretical higher specific energy in comparison to current LIBs is often found as justification when papers on the topic are introduced. However, these numbers stem from very simplistic views and are not realistic even in theory.4,5Departing from the intercalation concept of LIBs does generally not allow for a stable framework in the active material. In the Li–O2 cathode this means that the full volume of Li2O2 forms/disappears during discharge/charge. The basic charge storage process at the cathode is linking the redox moiety O2 to electron and ion transport according to O2 + 2e− + 2Li+ ↔ Li2O2. However, Li2O2 can, akin to most storage materials, not be cycled anywhere near to the bulk substance. Ion and electron transport are too poor to allow for practical bulk material electrodes. To provide simultaneous contact with ionic pathways to the electrolyte and electronic pathways to the current collector an electrolyte filled porous cathode is used. The capacity at a given initial porosity is determined by the degree of pore filling. Thus, beyond the scale of the single Li2O2 particle, the electrode including electrolyte becomes the actual Li+ host structure, which is required to fulfil the charge storage processes of linking formal ion host particles (Li2O2) to electron and ion transport. This introduces a ‘super-host structure’ that becomes an indispensable and integral part of the cell chemistry in a given electrode architecture and needs to be accounted for when reporting performance.
What capacity could the Li–O2 cathode with a reasonable super-host structure at best achieve and how does it compare to intercalation chemistries? One can assume that the Li2O2 particles could at best be packed with 74% volume occupation into a face centred cubic (fcc) structure, the theoretically limiting case. When charged the porous electrode is filled by electrolyte, which is displaced upon Li2O2 growth. Fig. 1 illustrates the relationship between formal host material and the super-host structure, and the maximum true specific capacity, which reaches ∼700 mA h gtotal−1, which is higher than intercalation electrodes.
 | ||
Fig. 1 True electrode capacity with limited capacity cycling. (a) True capacity of a Li–O2 cathode as a function cycling capacity per mass of carbon substrate for three cases of initial porosity (percentages above the curves). 4% volume are accounted for the binder, and the carbon volume fraction is adapted to yield the initial porosity. At an initial porosity of 92% a Li2O2 volume occupation of 74% (fcc packing) corresponds to 80% filling of the available pore space. The same 80% filling of the available pore space is assumed for the other initial porosities. The analogous value for the intercalation material LiFePO4 is shown for comparison. (b) Space filling of spherical Li2O2 inside the porous electrode volume with fixed sphere centres and the displaced electrolyte volume (together the super-host structure) at 0, 1000, and 25![[thin space (1/6-em)]](https://www.rsc.org/images/entities/char_2009.gif) 000 mA h gcarbon−1, respectively (indicated by the circles in a). Sphere sizes are to scale and the numbers indicate their volume occupation in the porous electrode volume. (c) Volumes of the electrode components at these capacities normalized to the full electrode volume in the delithiated state. Values for a LiFePO4 cathode are shown for comparison and demonstrate a very different electrolyte/active material ratio. The figure is adapted from ref. 4 with permission of NPG. 000 mA h gcarbon−1, respectively (indicated by the circles in a). Sphere sizes are to scale and the numbers indicate their volume occupation in the porous electrode volume. (c) Volumes of the electrode components at these capacities normalized to the full electrode volume in the delithiated state. Values for a LiFePO4 cathode are shown for comparison and demonstrate a very different electrolyte/active material ratio. The figure is adapted from ref. 4 with permission of NPG. | ||
Metal–O2 batteries are special in that the positive electrode does not contain the redox material in the charged state that could be taken as a reference for capacity. Thus, it is convenient to report capacities per weight of porous electron conductor. Often, up to several 10000 mA h gcarbon−1 are reached as first discharge capacities, which compare superficially favourably with some 100 mA h g−1 for intercalation materials.3,6,7 As a result of difficulties to cycle at full capacity it has become a habit to report cycling at, e.g., 1000 mA h gcarbon−1, which may still seem a lot in comparison to LIBs. Formal capacities are, however, easily misjudged since true capacities strongly depend on initial porosity and thus the substrate/electrolyte ratio as indicated by the vertical dotted line in Fig. 1a; true capacity at 1000 mA h gcarbon−1 grows with decreasing initial porosity due to the growing electrolyte/Li2O2 ratio at shallow discharge, Fig. 1b and c.
Limited-capacity cycling often allows simulating a large possible cycle number even if the same cell at full discharge would not reach more than a few cycles and cumulative capacity equating to only a few full cycles. Clearly, overly capacity-limited cycling is not suitable to demonstrate large reversible capacities for many cycles. Yet, it is a common feature of beyond-intercalation chemistries that reasonably capacity-limited cycling can be enabling for cyclability and at the same time yield significant improvement over intercalation if the capacity on a total weight basis is kept in mind as shown in Fig. 1a.4
For higher true capacities than intercalation electrodes it is crucial to achieve an as high as possible packing density of Li2O2 and to minimize inactive mass and volume. Low packing density and overly restricted depth-of-cycling likely result in no advantage over intercalation electrodes as demonstrated in Fig. 1. Reporting capacity with respect to the porous substrate mass does not reveal whether the electrode performs better than an intercalation electrode. A fair assessment requires therefore giving capacity per total electrode mass and volume. Unfortunately, many studies do not report the required measures to work out full electrode performance metrics. The following parameters are required to do so with electrode thickness and electrolyte loading being the only parameters beyond typically reported ones.
(1) The thickness of the porous electrode.
(2) The mass fractions of all components (carbon, binder, and electrolyte) as obtained from the mass fractions of all solids, their loading and the loading of electrolyte per unit electrode area.
(3) The volume fractions of all electrode components are then obtained from the mass fractions and the densities.
(4) With these measures it is straightforward to convert the capacity with respect to substrate into true capacity per mass and volume of total electrode including electrolyte.
These parameters are easily obtained and journal editors and referees are urged to insist on them being provided for papers. There is no theoretical barrier for the Li–O2 cathode to achieve higher true capacity than intercalation cathodes also in practice; key is high active material packing density and a small inactive/active material ratio.
3. Reaction mechanism at the Li–O2 cathode
With true energy depending crucially on filling of the available pore space, the mechanism by which Li2O2 is forming/decomposing attains paramount importance. It further directly impacts the stability of the cell components and rechargeability via the reactivity of the intermediates.3.1. Li2O2 formation on discharge
The first step of O2 reduction in aprotic Li+-electrolytes results in superoxide (O2−), which associates with Li+ and in the second step either undergoes a second 1e− reduction or disproportionates to form Li2O2. Two mechanisms have been proposed for how these steps proceed. The first involves a solution process, where O2− is solubilized to precipitate Li2O2 from the electrolyte solution,8 and the second considers the intermediate as surface bound throughout the process.9,10 Recently, a unified mechanism was described, where the solution and surface mechanism, respectively, are limiting cases.11 It describes the partition between these cases by the solubilisation of LiO2 in the equilibrium | (1) |
 | ||
Fig. 2 (a) Parameters determining surface and solution growth. These lead to Li2O2 as either conformal coating of the porous electrode or large particles in the pores. Effective Lewis basicity and acidity of the electrolyte as determined by solvent, salt anion, and additives governs the position of the equilibrium 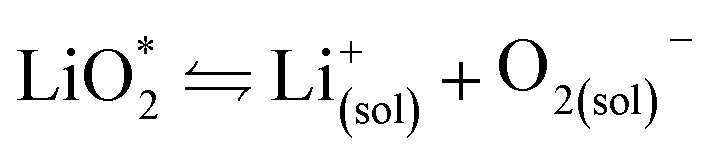 . Solvent and anion donor numbers follow the trend, e.g., nitriles < glymes < amides < sulfoxide and TFSI− < FSI− < Tf− < NO3−. High AN additives are, for example, H2O and alcohols. Increasing current shifts from solution to surface growth. (b) Reactions involved in the reduction mechanism and effect on charge. (c) Potential versus capacity for galvanostatic discharge in various electrolytes containing 0.1 M LiClO4. Me–Im is 1-methylimidazole (DN = 47). The dashed line indicates 7 nm solid layer thickness, which is seen as the limit for e− tunneling. The insert shows an electron micrograph of toroidal deposits composed of lamellae as obtained from solution growth. (c) is adapted from ref. 11, the insert in (c) is reproduced from ref. 12 with permission from NPG. . Solvent and anion donor numbers follow the trend, e.g., nitriles < glymes < amides < sulfoxide and TFSI− < FSI− < Tf− < NO3−. High AN additives are, for example, H2O and alcohols. Increasing current shifts from solution to surface growth. (b) Reactions involved in the reduction mechanism and effect on charge. (c) Potential versus capacity for galvanostatic discharge in various electrolytes containing 0.1 M LiClO4. Me–Im is 1-methylimidazole (DN = 47). The dashed line indicates 7 nm solid layer thickness, which is seen as the limit for e− tunneling. The insert shows an electron micrograph of toroidal deposits composed of lamellae as obtained from solution growth. (c) is adapted from ref. 11, the insert in (c) is reproduced from ref. 12 with permission from NPG. | ||
Lewis basicity (DN) or acidity (AN) of the electrolyte solution can be influenced by additives. Strongly Li+-coordinating salt anions can shift above equilibrium to the right to a similar extent as the solvent DN by competing association with the Li+ ion between salt anion and O2−.15–18 Similarly, Lewis acidic additives enhance O2− solvation as shown with water, alcohols, and onium cations.12,19–22 Unfortunately, both high DN solvents and protic additives that favour the solution mechanism can enhance parasitic reactions.12,20,23,24
Irrespective of whether the surface or solution pathway prevails, the second electron transfer may either proceed via a second 1e− reduction or disproportionation (Fig. 2b). With a standard potential of 2.96 V for O2/Li2O2 and ∼2.65 V for O2/O2−, the standard potential for O2−/Li2O2 is at ∼3.3 V.11 The second reduction has therefore at all discharge potentials a strong driving force. However, electrochemical measurements combined with in situ Raman have shown that disproportionation dominates at low overpotentials in electrolytes with sufficient solvation strength to support solution growth.11,25,26 Higher overpotential (higher current) accelerate in the same electrolytes the second reduction at the expense of disproportionation and change the mechanism to surface growth. Recently, it was suggested that not only effective solvation strength controls surface/solution growth based on a correlation between effective solvent polarity (ENτ), tuned by additives, and the onset of the second reduction in DMSO.27 This was explained by an increasing solvent rearrangement energy with polarity and thus, according to Marcus–Hush theory, an increasing activation barrier for the second reduction.
Which mechanism prevails has important consequences for attainable capacity as exemplified in Fig. 2b for variation of solvent DN. The surface mechanism provides little mobility for reduced O2 species and leads to a conformal coating of the electrode with discharge ceasing after only ∼5 to 10 nm, corresponding to low capacity.10,25 Beyond this thickness the charge transport resistance increases greatly as determined by impedance spectroscopy and does not permit sustaining the current any longer.10,28 The solution mechanism, in contrast, keeps electrode area open for longer and allows for larger capacity by the growth of large (micrometer sized), toroidal particles composed of lamellae, which can fill larger pores to a bigger extent (insert in Fig. 2c).25 The electrochemically active surface area does initially not change, followed by gradual surface blocking. The capacity is equally limited by greatly increasing charge transfer resistance RCT.28 Concurrently, the aspect ratio and average particle size of newly formed Li2O2 decreases with progressive discharge.29 Together, evolution of RCT and particle shape suggest that with shrinking active surface, growing overpotential and local current, the mechanism gradually shifts towards the surface mechanism, which finally causes full passivation.
3.2. Oxidizing Li2O2 on charge
Galvanostatic charging of Li–O2 cathodes is typically characterized by an onset of charging (O2 evolution) slightly above the OCV at ∼3 V and ever increasing voltage as charging progresses. Three underlying phenomena appear to be consolidated although details are still under debate: (1) electrochemical oxidation of Li2O2 is possible with low kinetic barriers at high rates; (2) increasingly difficult electron transfer along recharge contributes a minor fraction of the voltage rise; (3) rising voltage is mostly caused by accumulating parasitic products, which cause a mixed potential.Theoretical studies determined the overpotential at which Li+, e−, and O2 can be removed from Li2O2.30–33 They suggested that Li+ and e− can be removed starting below 0.2 V overpotential, leading to either surface  or bulk Li2−xO2via topotactic delithiation.30–32 Bulk Li2−xO2 appears to comprise Li2O2 and LiO2 domains.32 O2 evolution was initially suggested to have the highest barrier along the whole path.30,31 Later, a pathway was shown where O2 evolves facile after progressive delithiation at ∼0.3 V overpotential via Li2−xO2 to LiO2, which then decomposes rapidly at ∼2.6 V vs. Li/Li+ (Fig. 3a).32 Low theoretical charge overpotential is in agreement with experiments, albeit experimental overpotential even approaches zero since observed O2 evolution starts from ∼3 V.9,33,34 Li-deficient Li2−xO2 phases were confirmed by operando X-ray diffraction (Fig. 3b).35 An open question is whether O2 release after the initial delithiation proceeds by disproportionation of LiO2 domains in Li2−xO2via 2LiO2 → Li2O2 + Li+ + O2 or via further e− extraction. This is significant as the first pathway would imply that charge could be influenced in much the same way as discharge by the discussed factors governing surface or solution routes, and it could be a key for singlet oxygen formation and thus the major source a parasitic chemistry on charge as discussed in Section 4.3.
 | ||
| Fig. 3 (a) Calculated oxidation potentials for topotactic delithiation of Li2O2 to Li2−xO2. The dashed line denotes the O2/Li2O2 standard potential. The inserts show the structures of Li2O2 and Li1.75O2.32 (b) Average Li occupancy during charging of electrochemically formed Li2O2 and the associated voltage.35 (a) and (b) are adapted from ref. 32 and 35, respectively, with permission from the American Chemical Society. | ||
An intriguing feature of Li2O2 is that the electronic conductivity depends strongly on applied voltage, crystallinity and defects. Increasing potential was postulated to significantly increase conductivity by either reducing the tunnelling barrier or through the formed Li-deficient phases.36,37 This is consistent with impedance measurements that reveal much higher, capacity limiting, polarization resistance at the end of discharge than after switching to charging.28 Theoretical and experimental work on pure Li2O2 have highlighted the importance of defects and grain boundaries on charge transport.38–40 Orders of magnitude higher conductivity of amorphous vs. crystalline Li2O2 is consistent with the observed oxidation of amorphous and poorly crystalline Li2O2 at lower voltage followed by the crystalline Li2O2.35,38,41
Important for understanding polarization and limitations of recharge is whether oxidation occurs at the cathode/Li2O2 or the Li2O2/electrolyte interface. While charge transport through Li2O2 will be limiting in the latter case, in the former case the question arises whether Li2O2 particles would lose contact, which would impede full recharge. Recent work including with isotope labelled O2 suggested that e− transport is limiting during discharge and charge.9,42 Thus, Li2O2 can deposit at the cathode/Li2O2 interface beneath previously formed product if Li+ and O2 can reach the surface via cracks in the Li2O2 and this later deposit is oxidized first, eventually leading to a gap between cathode and Li2O2 and contributing to increasingly difficult oxidation.42 Note that the associated rise in impedance accounts only partly for the observed rise in charge potential. The majority of the rise is associated with concomitant parasitic chemistry from the start of charge, which is accelerated with growing potential and predominantly caused by singlet oxygen as discussed in Section 4.3.24,43–45 Current understanding of solid catalysts for the OER will be discussed in Section 5.2 and redox mediators as charge transfer agents for O2 reduction and evolution in Section 6.
4. Parasitic chemistry
Typically close to two electrons per one O2 are consumed on discharge despite significant amounts of a typical pattern of side products being formed including Li2CO3, Li formate and Li acetate.46–49 On charge, the e−/O2 ratio typically deviates significantly from two and more of the side products form. Parasitic chemistry is the prime obstacle for reversible Li–O2 cell cycling and understanding the mechanisms to counteract them is thus the most pressing research need in the field.4.1. Characteristics of reversible cell reactions
True reversibility of the cathode reaction, 2Li+ + O2 + 2e− ↔ Li2O2, requires a set of quantities to obey the stoichiometry and to match each other during discharge and subsequent charge. These are:(A) One mole of O2 is consumed/released per two moles of electrons flowing on discharge/charge. Thus e−/O2 = 2.
(B) One mole of O2 and two moles e− produce exactly one mole of Li2O2 on discharge. On charge two moles e− consume one mole of Li2O2 and release one mole of O2. Thus:
| e−/O2 = e−/Li2O2 = 2 and O2/Li2O2 = 1 | (2) |
The ratio e−/O2 = 2 is not a strict requirement for a rechargeable Li–O2 battery if Li2O2 is not the discharge product as occasionally claimed.6,7,50 For example, if Li2O2 with a certain fraction of ‘LiO2-like’ species or even pure LiO2 is the product e−/O2 may be lower than 2. However, in any case e−/O2 = e−/LixO2 must be identical on discharge and charge. These conditions further imply:
(C) All electrons involved contribute to the oxygen reduction reaction (ORR) or oxygen evolution reaction (OER). Thus, no other gas than O2 evolves during discharge and charge and no soluble or solid product other than Li2O2 (or H2O2) is produced.
(D) For cycling with equal capacity on discharge and charge (QORR = QOER) the O2 released on charge matches the amount consumed, thus nO2,ORR = nO2,OER.
Importantly, none of these measures can be taken for granted to be mutually met even if, for example, e−/O2 ≈ 2 on discharge is fulfilled. Before discussing the current understanding of reactions leading to deviating measures in the next two subsections, we first consider the basic interpretation of the load curves and quantitative analyses to determine the measures (A) to (D).
As discussed in Section 2 on performance metrics, it has become a habit to cycle cells at fixed discharge/charge capacities of, e.g., 1000 mA h gsubstrate−1, thus forcing Qcharge = Qdischarge. Truncating discharge reasonably to avoid full electrode blockage may enable cyclability and appears justified as long as the true capacity based on the total weight is obeyed (see Fig. 1a). Capacity controlled recharge with Qcharge = Qdischarge is, however, prone to mask parasitic chemistry as illustrated in Fig. 4. The full and dashed blue curves at the bottom show discharge with voltage or capacity limitation, respectively. Basic thermodynamics requires for the charge reaction to be the reverse of the preceding discharge that (a) the voltage remains within the stability of electrolyte and electrode without Li2O2 (black dashed line); and (b) that as the capacity approaches full recharge the depletion of the Li2O2 must cause the voltage to rise ever steeper before it transits into a plateau at the electrolyte oxidation potential, blue curve in Fig. 4a. Concurrently, differential capacity d![[Q with combining circumflex]](https://www.rsc.org/images/entities/i_char_0051_0302.gif) /dU must approach zero at full recharge irrespective of whether the preceding discharge was limited by voltage or capacity, Fig. 4b (blue curve).
/dU must approach zero at full recharge irrespective of whether the preceding discharge was limited by voltage or capacity, Fig. 4b (blue curve).
 | ||
| Fig. 4 (a) Schematic of load curves that are either possibly commensurate with cycling according to Li2O2 → O2 + 2Li+ + 2e− (blue) or with certainty indicating a major fraction of parasitic chemistry (red). The left graph shows the voltage versus normalized capacity (capacity divided by final discharge capacity). Full and dashed curves correspond to voltage or capacity controlled discharge, respectively. Dotted curves on charge extrapolate to overcharge. (b) The corresponding differential capacity curves |d/dU|. | ||
Frequently observed load curves of the type as shown in the red curve in Fig. 4 are, in contrast, with certainty indicating major parasitic chemistry. They are characterized of approaching full recharge flat with d/dU remaining high, Fig. 4a and b. Flat and high relate here to the rest of the charge curve. Whatever reaction takes place can thus not have finished, can thus not be predominantly Li2O2 oxidation, and would continue with a continuing flat plateau if such a cell were over charged (extrapolation by the red dotted curve). An exception is cells with oxidation mediators with large electrolyte-to-Li2O2 ratio. Notably, remaining within the oxidative stability window (without Li2O2) does not ensure absence of oxidative electrolyte decomposition nor does a lower recharge plateau per se (e.g., as a result of electrocatalysts) indicate less parasitic chemistry.47,51
Concluding about reversibility by the measures (A) to (D) requires multiple quantitative analyses. Measuring O2 consumption/evolution has been described by two methods: (A) quantitative operando online mass spectrometry (MS), where the cell head space is continuously or intermittently purged to a MS.34,48,52 Using an O2/Ar mix allows also quantification of O2 consumption and of any other gases evolved on discharge.19,24,34,53 (B) Measuring the pressure in a closed cell head space.54 Peroxide or superoxide content of electrodes has been measured ex situ using either iodometric titration49 or spectrophotometry using the coloured [Ti(O22−)]2+ complex.55 This method was combined with equally MS based quantification of Li2CO3 and organic products by treatment with acid and Fenton's reagent to separately evolve CO2 from inorganic and organic compounds.44 The latter may also be quantified by 1H-NMR after immersing the electrode in D2O which further allows for speciation of the compounds.47,49 Importantly, all these methods capture the integral electrode. Qualitative spectroscopic or microscopic methods such as Raman, FTIR, XRD, XPS, or SEM cannot replace the mentioned or similar quantitative integral methods and cannot support claims of reversibility.
4.2. Reactions with reduced oxygen species and molecular oxygen
Reduced reactive oxygen species (RROS) are well known for their reactivity with a wide range of organic substrates, which has both been used as a reactant and recognized as a source of unwanted reactions.56,57 Primary species are O2− and O22−, which in protic environments form species including HOO˙, HOO−, and HO˙. Their nucleophilicity, basicity, and/or radical nature cause reactivity via three major routes: nucleophilic substitutions, H+ and H-atom abstraction. The latter may also proceed with dioxygen in auto-oxidation reactions. Additionally, O2− can transfer electrons.Polarity is introduced to aprotic electrolyte solvents via heteroatoms to dissolve a Li-salt. The polarity in turn makes adjacent C and H atoms reactive. After the complete failure of carbonate electrolytes for Li–O2 chemistry was rightly associated with the nucleophilicity of O2−, this and the other reactivities of RROS and O2 were taken to explain lesser but significant parasitic chemistry of all so far investigated alternative solvents and cell components.1,47,58 In the era of computational chemistry the likelihood for this assignment can be judged based on activation and reaction free energies. Bryantsev et al. have pioneered this field for O2− and O2 reacting with organic electrolytes via nucleophilic substitution, H-atom, and H+ abstraction.58–61 Their data for activation energies together with those of other researchers are summarized in Table 1.
| Reactant | Type of reaction | Reaction | E act (kJ mol−1) | References |
|---|---|---|---|---|
| a Dimethoxyethane (DME). b Acetonitrile. c Carbonate and lactones. d Free DME. e The DME2–Li+ complex. f Examples for pKa < 30: –CH2–CF2–, polyvinylidene difluoride (PVDF), aliphatic dinitriles, alkyl imides. pKa > 30: acetonitrile, DMSO, N-alkyl amides and lactams, aliphatic ethers. g The lower value for free DME, the higher one for the DME2–Li+ complex. h Lactams and amides. | ||||
| O2− | Nucleophilic substitution | ROR′ + O2− → RO− + ROO˙ (3) | 121–144a, 105b, 65–95c | 58, 61, 65 and 66 |
| H-atom abstraction | RH + O2− → R˙ + HOO− (4) | 129–180d, 191e | 61, 63, 65 and 67 | |
| H+ abstraction | RH + O2− → R− + HOO˙ (5) | pKa > 30 stablef | 59 and 68 | |
| Li2O2 | Nucleophilic substitution | ROR′ + Li2O2 → RO−Li+ + R′OO−Li+ (6) | 134–192a | 62 |
| H-atom abstraction | RH + Li2O2 → R˙ + [Li2O2-H˙] (7) | 96–112a | 62 | |
| H+ abstraction | RH + Li2O2 → R−Li+ + HOO−Li+ (8) | 116–311a | 62 and 66 | |
| O2 | H-atom abstraction | RH + O2 → R˙ + HOO˙ (9) | 163–183g, 138–161h | 61 |
Strikingly, activation energies for all considered reactions involving the major classes of solvents – except for the very unstable solvents like carbonates – are too high to expect these reactions to strongly contribute to decomposition. Based on solvent stability screening experiments with KO2 exposure or the reversibility of the O2/O2− couple, reactions with activation energies beyond 100 kJ mol−1 can be considered not to contribute noticeably.58 Hence, only esters and lactones are expected to react via nucleophilic substitution with O2− and possibly ethers via H-abstraction with Li2O2.62 With ethers, for example, all pathways with O2−, Li2O2 and O2 require high activation energy and are strongly endothermic. The only exception is one study that found H-abstraction by Li2O2 clusters slightly exothermic with Eact < 100 kJ mol−1.62 Solvent coordination with Li+ was reported to further stabilize against H-abstraction by O2− and O2.61,63
In presence of proton sources such as water or weak acids O2− forms viaeqn (10)–(13) HOO˙, HOO−, and HO˙, which are more reactive than the primary RROS.59,64
| O2− + H+ → HOO˙ | (10) |
| HOO˙ + O2− → HOO− + O2 | (11) |
| 2HOO˙ → H2O2 + O2 | (12) |
| HOO− + H2O2 → O2− + HO˙ + H2O | (13) |
HOO− is a stronger base than O2− and more readily abstracts protons to form R−. HO˙ could serve as the initiator to form R˙, which undergoes fast and thermodynamically favourable onwards chain reactions in the presence of O2.47,61 Overall, direct reactivity of O2−, Li2O2 and O2 with the most important classes of non-aqueous solvents for the Li–O2 cathode is unfavourable. Increasing parasitic chemistry with increasing water content is consistent with the protonated species being more reactive.12 Yet, much higher side reactions on charge than on discharge, which opposes superoxide occurrence, points at RROS not to be the prime cause for parasitic chemistry.
4.3. Singlet oxygen formation and suppression during discharge and charge
Electrochemically oxidizing Li2O2 was hypothesised by Hassoun et al. to be able to generate singlet oxygen (1Δg or 1O2), the highly reactive first excited state of triplet ground state dioxygen (3Σg− or 3O2).69 This view was motivated by the known formation of 1O2 by chemical oxidation of H2O2 or alkaline peroxides.70 Based on the reversible potential of Li2O2 formation and the energy difference between triplet and singlet oxygen of ∼1 eV, 1O2 formation in the Li–O2 cell has been considered possible at charging potentials exceeding 3.5 to 3.9 V vs. Li/Li+.54,69,71 The idea was picked up by several reports but could not be verified due to the difficulties with detecting 1O2 except for one work, which identified small quantities of 1O2 between 3.55 and 3.75 V and explained it on thermodynamic grounds for the process Li2O2 → O2 + 2Li+ + 2e−.18,45,71 It could thus contribute to explaining parasitic chemistry above 3.55 V. Yet it has been found that from the start of charging below 3.5 V both a substantial amount of parasitic products is generated43,44,49 and that less than 1 mol O2 evolves per 1 mol Li2O2 consumed.49 Both could not be explained by reactivity of reduced O2 species and formation of 1O2 above 3.55 V.Recently, Mahne et al. have shown that 1O2 forms also during discharge and from the onset of charge and that it accounts for the majority of parasitic reaction products.24 The amount of 1O2 increases during discharge, early stages of charge, and charging at higher voltages, and is enhanced by the presence of trace water. They used the 1O2 specific conversion of 9,10-dimethylanthracene (DMA) into its endoperoxide (DMA–O2) to probe 1O2 in the cell. Operando fluorescence detection on discharge and charge has shown rather small 1O2 abundance on discharge and significant 1O2 formation immediately after switching to charging, starting from ∼3 V (Fig. 5a). 1O2 on discharge is significant as shown by detecting the degree of DMA to DMA–O2 conversion (Fig. 5c) and the substantially reduced amount of side products with DMA (Fig. 5b). Hence, a suitable 1O2 trap such as DMA can divert 1O2 from reacting with cell components, is, however, quickly consumed at the level of 1O2 abundance. In contrast, a 1O2 quencher physically deactivates singlet into triplet oxygen and is itself not consumed. Using 1,4-diazabicyclo[2.2.2]octane (DABCO) as quencher they have shown even more substantial reduction of side products (Fig. 5b). DABCO has, however, limited electrochemical stability between ∼2.0 and 3.6 V, which allows for only partial recharge. Future work should therefore focus on finding quenchers that meet all requirements including electrochemical potential window, stability with the reduced oxygen species, and high quenching rate.
 | ||
| Fig. 5 Singlet oxygen formation and suppression during cycling of the Li–O2 cathode.24 (a) Operando fluorescence spectroscopy during galvanostatic discharge and charge of a carbon black electrode in O2 saturated 0.1 M LiClO4 in tetraglyme containing 1.6 × 10⁻⁵ M 9,10-dimethylanthracene (DMA) as singlet oxygen trap. (b) Amount of carbonaceous side reaction products at various sample points during discharge and charge of cells containing no additive, 30 mM trap DMA, or 10 mM quencher DABCO. (c) Fraction of the initial DMA that has reacted to DMA–O2 in the cells that contained DMA as additive. | ||
On discharge one possible source of 1O2 is the disproportionation of LiO2 according to
| 2LiO2 → (LiO2)2 → Li2O2 + 1O2 | (14) |
This pathway appears plausible when the structures and energies of dimers as calculated by Bryantsev et al. are considered.60 When H2O or other proton sources are available the superoxide will be protonated to form HOO˙ that has been reported to be able to release 1O2 in the overall reaction.72,73
| 2O2− + 2H+ → H2O2 + 1O2 | (15) |
Overall, the disproportionation of superoxide in the presence of either Li+ or H+ appears to be the 1O2 source on discharge. On charge three possible pathways were suggested. First, an analogous path to the one on discharge involving disproportionation of superoxide in the presence of either Li+ or H+. The LiO2-like surface species could form during the initial charging steps as discussed above30–32 and 1O2 may form analogously to eqn (14) or (15). This pathway for 1O2 formation can be active from the first onset of charge as soon as Li+ and e− are extracted. Second, a further 1e− oxidation of the surface LiO2 species could give 1O2 above  + E(1Δg ← 3Σg−). With the thermodynamic equilibrium potential
  estimated to be between 2.29 and 2.46 V (ref. 32, 74 and 75) and E(1Δg ← 3Σg−) ∼ 1 eV, a thermodynamic voltage for 1O2 evolution of 3.26 to 3.43 V can be estimated. Finally, above ∼3.55 V the pathway can sets in as suggested by Hassoun et al. and shown by Wandt et al. with 1O2 evolving by 2e−–oxidation of Li2O2 (Li2O2 → O2 + 2Li+ + 2e−).69,71
Superoxide is both a proficient source and efficient quencher of 1O2viaeqn (5).76
| O2− + 1O2 → 3O2 + O2− | (16) |
Net formation of 1O2 may depend on the relative kinetics of all superoxide sources and sinks (with 1O2 being involved in both) and not solely on the superoxide concentration. These sources and sinks are both electrochemical and chemical and change with discharge/charge, electrolyte, current, and potential. Current density and electrolyte properties will influence the 1O2 formation in much the same way as they govern the occurrence of superoxide on discharge and charge below 3.5 V.77 Charge current will drive 1O2 production if it causes charging voltages above ∼3.5 V.
4.4. Alternative storage media to Li2O2
In occasional reports the discharge product was reported to be Li2O2 with remaining stable LiO2 species, resembling the Li2−xO2 intermediate on charge.50 Based on these findings an Ir–graphene based cathode was reported to cycle in ether electrolyte via crystalline LiO2.7 These assignments were mostly based on Raman spectra that can distinguish O–O stretch vibrations in Li2O2 and LiO2. However, it was recently shown that PVDF binder decomposition can lead to vibrations mimicking those of LiO2, thus concluding that cycling was not based on LiO2.78Surprisingly large water contamination up to 1000s of ppm in ether electrolyte has been shown to still lead to Li2O2 as the main discharge product rather than LiOH as one could intuitively assume.12,19 Instead, water promotes discharge via the solution mechanism. Whether Li2O2 or LiOH forms was suggested to be governed by the effective pKa value of water in the electrolyte.20 A value of 35 in MeCN compared to 47 in DME was used to explain LiOH to form in the former and Li2O2 in latter. At water concentrations beyond 1% LiOOH was shown to form together with LiOH.79 LiOH was also found to form in a 4e−/O2 reduction in presence of LiI.6,80 Unfortunately, O2 evolution from LiOH could so far not be shown and apparent cyclability must be accounted for I− electrochemistry and parasitic chemistry.80
Li2CO3 not only forms as a result of parasitic reactions, but also when the O2 supply is CO2 contaminated.47,81,82 CO2 has a high barrier for direct reduction but reacts readily with O2− along with the formation of Li2O2. If Li2CO3 could be decomposed on charge to the educts it would make the cell insensitive to CO2 in the O2 supply. While Li2CO3 can be decomposed from ∼3.8 V, it does not evolve O2 together with the CO2, which suggests that reactive intermediate form that decompose the electrolyte.47,48,82 Apparent cyclability of O2/CO2 cells that was shown in some cases was so far not compellingly associated with reversible chemistry. Making Li–O2 chemistry insensitive to H2O and CO2 contamination should thus remain a high priority, which foremost calls for rigorously investigating the associated parasitic chemistry.
5. Porous cathode design
5.1. Cathode support
Carbon is the most common porous electron conducting matrix for the O2–cathode due to low cost, high conductivity, and easily tuneable surface area and pore sizes. Carbon was, however, found to decompose itself on cycling and to promote electrolyte decomposition.43,44,49,83 Using 13C carbon black and MS analysis of the gaseous and solid products at various stages of cycling, carbon was observed to be relatively stable on discharge despite thermodynamic instability in contact with Li2O2; the majority of side products stems from the electrolyte. From the onset of charge, however, carbon decomposes to form Li2CO3 with increasing rate as the potential grows.44,49 Defect rich hydrophilic carbon is both much more vulnerable itself and promotes more strongly electrolyte decomposition during discharge and charge than hydrophobic carbon.44,83As with electrolyte decomposition, the carbon instability was related to O2− attack. The perfectly opposing trend of O2− abundance – highest on discharge and ever decreasing as charge voltage grows – to decomposition rates makes this interpretation unsatisfactory. Therefore, reactive intermediates on oxidizing Li2O2 have been suggested.44,45 Carbon and electrolyte decomposition rates both follow the trend of 1O2 abundance as shown in Fig. 5a. This is consistent with 1O2 being the dominant driver of parasitic chemistry; possibly the nearly exclusive one on charge.
Given the instability of carbon, alternative corrosion resistant materials have been sought that at the same time do not promote electrolyte decomposition. They include Ti ceramics and nanoporous Au that allow for more stable cycling.52,53 For TiC a thin passivating layer of TiO2−x and TiOC has been identified to be critical for stability and conductivity.53,84 The metallic Magnéli phase Ti4O7 was equally shown to form surface TiO2−x and to allow for cyclability similar to Au and TiC.85 Limited binder stability adds another dimension to cathode design. Standard PVDF binder as used in LIB was found to react with Li2O2 and KO2,59,78,86,87 but equally 1O2 can be expected to contribute. More stable alternatives include PTFE and Nafion.86,87
So far the surface chemistry and electrochemistry of these alternative materials have been investigated with bound nanoparticles forming low porosity electrodes. Achieving high capacity based on the total electrode weight requires, however, filling highly porous electrodes to a large extent with Li2O2. High porosity becomes even more important when going from C to much denser metals or ceramics. Fig. 6 shows the relation between initial electrode porosity and maximum achievable true capacity for the examples of C, TiC, and Au. Shaping chemically stable materials into highly porous electrodes, ideally with well beyond 80% porosity, favourable surface area and pore size distribution arises therefore as a major need in the field.
 | ||
| Fig. 6 Specific capacity of a Li–O2 cathode with respect to total electrode weight including electrolyte as a function initial porosity. The initial porosity is in the fully charged state filled with electrolyte and at full discharge filled to 80% with Li2O2; the dotted lines show values for 100% pore filling for comparison. Values are given for cathodes made from C, TiC, or Au respectively. The calculation is analogous to Fig. 1. | ||
5.2. Heterogeneous electrocatalysis
Typical overpotentials relative to = 2.96 V are ∼0.3 V on discharge and ever rising values on charge from nearly zero to, in some cases, up to 2 V. Inspired by aqueous O2 electrochemistry, these overpotentials were accounted to sluggish kinetics and evoked substantial efforts in finding efficient electrocatalysts including noble metals, transition metal oxides, and doped carbons.51 Considering the mechanism for Li2O2 formation/decomposition, there are, however, three major barriers questioning true effectiveness of solid electrocatalysts. First, ideal Li–O2 chemistry does not involve O–O bond breaking, the step necessitating catalysts in aqueous media. O2 reduction to superoxide and peroxide, in contrast, has been shown to be facile even on bare glassy carbon.33 Hence, perceived overpotentials are not due to ORR or OER kinetics. The discharge potential of ∼2.7 V is not due to overpotential of the O2/Li2O2 couple but is pinned there by the reversible potential of the O2/O2− couple, the first step on O2 reduction to Li2O2 and can thus not be raised by electrocatalysts.9,11,88 Li2O2 oxidation starts with nearly zero overpotential at ∼3 V. Rising charge potentials are, as discussed in Section 3.2, caused partly by increasingly difficult electron transfer in the receding Li2O2 and mostly by parasitic chemistry. Second, conventional electrocatalysis would only act on dissolved redox species. On discharge there would thus be no effect beyond monolayers of Li2O2 forming with the surface mechanism. Deep discharge with both surface and solution mechanism blocks eventually all electrochemically active surface. Third, charge transport limitations through forming Li2O2 (ref. 10 and 36) and mass transport of O2 through the porous electrode89 are not addressed by solid catalysts.
Whether solid electrocatalysts can have any effect on charge depends on the processes at the buried cathode/Li2O2 interface and how they proceed as charge progresses. Given the insolubility of Li2O2, solution transport to open sites can be largely neglected. Proposed pathways for how the substrate could modulate oxidation of adhering Li2O2 include in situ doping of the deposited Li2O2 with slightly soluble transition metal catalysts during discharge, helping charging through enhanced polaron transport or vacancy transport with O2 evolution at the Li2O2/electrolyte interface.90 Further, supporting metal(oxides) may alter the delithiation kinetics of Li2O2 by forming Li-transition metal-oxides.77 Acting beyond the initial stages of charge requires maintaining the electrode/Li2O2 contact, for which the driving force is not clear as the Li2O2 closest to the electrode will necessarily be oxidized first. In the case of large Li2O2 deposits forming by the solution mechanism, this contact may never be fulfilled for a large fraction of the Li2O2. Not least did the habit of extended cycling at a small fraction of a possible single discharge capacity (see Section 2) arise from catalyst studies; with deep discharge the same cells fail typically very quickly, which hints at very limited effectiveness of the catalysts to oxidize large amounts of detached Li2O2.
Given the paramount importance of parasitic chemistry, electrocatalysts must not catalyse parasitic reactions with the electrolyte or electrode. Unfortunately, materials identified as electrocatalysts do enhance parasitic reactions.46,51,91 The exact pathways are not fully clarified but are at least in part associated with the catalyst's ability to dissociate the O–O bond. Concluding about a catalyst's ability to enhance efficiency and cyclability requires quantitative measures of reactant turnover and parasitic products without which any claim is inadequate (see Section 4.1).
6. Solution based Li–O2 cell chemistry
Lithium peroxide is a good charge storage medium with respect to formal capacity per mass and volume. It is, however, a poor medium with respect to the basic charge storage process of linking the redox moiety O2 to electron and ion transport according to O2 + 2e− + 2Li+ ↔ Li2O2. However, different to other Li+ storage materials, Li+ and e− transport into/out of the bulk Li2O2 particle is not even required since growth/dissolution occurs in any case at its surface. This unique feature of Li2O2 can be turned into a major advantage in terms of rate capability. It is the several orders of magnitude slower ion diffusivity compared to liquids that makes batteries slow and the very fast charge transport in liquids that makes supercapacitors high-power devices.92 Bypassing Li2O2 for ion and electron transport through a phase, where both are facile may thus enable high-power Li–O2 cells. Li2O2 would then only serve as the charge storage medium. While the liquid electrolyte (where the reaction takes place) provides facile ions transport, moving electrons through the liquid is more difficult. Possibilities involve: (a) giving solubility to LiO2 for it to act as an electron mediator during discharge (Fig. 7a, discussed in Section 3); (b) redox mediators that are reduced/oxidized at the e− conductor, then move through the electrolyte and act in a distant position to reduce O2 or oxidize Li2O2, thereby being regenerated themselves (Fig. 7b). | ||
| Fig. 7 (a) Schematic of the reactions taking place in a Li–O2 cathode (O2 + 2Li+ + 2e− ↔ Li2O2) during discharge and charge in conventional electrolyte. The insoluble and insulating discharge product Li2O2 forms on the surface of the conducting porous substrate and passivates it. Charging is hampered by poor electron transport. (b) Mediated electron/hole transport by mediators M and M′. The reduction mediator M may transfer electrons to O2 either in an outer sphere process or via an O2-binding transition state in an inner sphere process. | ||
Two classes of reduction mediators have been put forward. With the first, the reduced mediator M− reduces O2 in an outer sphere reaction to superoxide, which then can undergo disproportionation or is further reduced by another M− (Fig. 7b top), with investigated compounds including viologens and N-heterocyclic complexes.93–95 However, improvement of discharge capacity has not clearly been shown. Recently, particular quinones (e.g., 2,5-di-tert-butyl-1,4-benzoquinone (DBBQ)) were shown to form Li2O2 in an inner sphere process without the involvement of free superoxide (Fig. 7b centre).96 Reduction of the quinone in presence of Li+ and O2 leads to a LiM and then LiMO2 complex. The latter is more stable than [Li+O2−] as seen by the higher discharge potential, and disproportionates to form Li2O2 and to reform M. LiMO2 dissolves even in poorly solvating glyme electrolytes, thus mitigating the trade-off between solubilisation and stability and allowing for substantially increased discharge capacity.23,96 Higher Li2O2 yield with DBBQ than without it was attributed to the absence of free superoxide, albeit it is still unclear whether the quinone suppresses the direct reactivity of the superoxide or 1O2 formation.24
Oxidation mediators allow, in principle, charging at nearly zero overpotential and numerous oxidation mediators have been explored for redox potential and O2 evolution efficiency (e−/O2).18,97–101 Early work has found that some oxidation mediators with suitable redox potentials oxidize Li2O2 with the expected amount of O2 evolution whereas others with similar potential evolve considerably less O2.98 As mechanistic descriptor for this behaviour, the position of the HOMO level of M+ was put forward, which, when close to the HOMO of the electrolyte, is prone to oxidize the electrolyte.99
Two pitfalls have to be considered with mediators: first, oxidation mediators M+ may, instead of oxidizing Li2O2, diffuse out of the cathode to the counter electrode to cause leak-current by shuttling. This may be avoided by using Li+ conducting diffusion barriers such as ceramics or polymers as the separator.101 Second, mediators, which are mostly organic molecules, are themselves susceptible to decomposition. Both issues make it imperative to quantitatively measure O2 consumption/evolution, Li2O2 formation/oxidation, and parasitic products as discussed in Section 4.1. Any claim about performance improvements is inadequate without these measures.
7. Outlook
The past few years have brought substantial progress with the mechanisms underpinning the operation of the Li–O2 cathode. The two central issues are: (A) discharge/charge mechanisms of Li2O2, and (B) mechanisms of parasitic chemistry.A central issue was to identify conditions leading to discharge via a surface passivating mechanism (giving low capacities) or a solution based process to form large Li2O2 particles (required for high capacities). The deciding factor is the solvation of the superoxide intermediate by tuning the electrolyte interaction with Li+ or O2−via solvent, salt, and additive Lewis basicity/acidity. Oxidation of Li2O2 proceeds at low kinetic overpotentials and can thus, in principle, take place at high rates close to the thermodynamic potential. Rising voltage is predominantly associated with parasitic chemistry. Nevertheless, when discharge proceeds via the solution mechanism charge transport from large Li2O2 particles will contribute to overpotentials.
Solution based Li–O2 chemistry appears to be the way forward for high capacity and rate capability and low overpotentials, here, Li2O2 only serves as the storage medium and is bypassed for charge transport through the electrolyte by means of redox mediators. With reduction mediators the pathway to form Li2O2 may be altered such that there is not free superoxide, which is a source of singlet oxygen and thus parasitic chemistry on discharge. Oxidation mediators allow, in principle, for charging at nearly zero overpotential. The biggest open question with mediators is their own susceptibility to decomposition and their impact on singlet oxygen formation.
The major barrier for reversible cell operation is parasitic chemistry with electrolyte and cell components. The previous view of superoxide and Li2O2 being the major cause was only recently overturned by finding that singlet oxygen (1O2) is formed on discharge and charge; the extent matches the pattern of parasitic reactions with relatively little on discharge and much more on charge. Practical realization of Li–O2 batteries will, in our opinion, stand or fall with mastering 1O2 formation. Open questions centre around: (1) factors influencing 1O2 formation including catalysts, electrolytes, mediators, and protic additives; (2) more detailed insight into formation mechanisms; (3) finding efficient quenchers; (4) finding mechanism to prevent 1O2 formation. Given that so far significant parasitic chemistry is to be expected during both discharge and charge, concluding about the efficacy of any measure to improve capacity, efficiency and cyclability requires quantitative analysis of reactant turnover and parasitic products without which any claim of improvement is inadequate.
There is no theoretical barrier for the Li–O2 cathode to achieve much higher capacity than intercalation cathodes. However, to do so it is crucial to achieve an as high as possible packing density of Li2O2 in the cathode and to minimize the inactive mass and volume including the electrolyte. Two habits make tracing progress in the field difficult: first, reporting capacity with respect to porous substrate mass, which represents a minor and widely varying fraction of the total electrode mass; second, reporting cycling at, e.g., 1000 mA h gcarbon−1, which may still seem a lot in comparison to intercalation electrodes. The problem is that in most cases true performance is below intercalation electrodes and that it masks irreversible reactions. Therefore, it is important to report performance with respect to the full electrode to allow for a fair assessment of energy, power, and cycle life.
Acknowledgements
S. A. F. is indebted to the European Research Council (ERC) under the European Union's Horizon 2020 research and innovation programme (grant agreement No. 636069). We further gratefully acknowledge funding from the Austrian Federal Ministry of Economy, Family and Youth and the Austrian National Foundation for Research, Technology and Development.Notes and references
- A. C. Luntz and B. D. McCloskey, Chem. Rev., 2014, 114, 11721–11750 CrossRef CAS PubMed.
- D. Larcher and J. M. Tarascon, Nat. Chem., 2014, 7, 19–29 CrossRef PubMed.
- J. W. Choi and D. Aurbach, Nat. Rev. Mater., 2016, 1, 16013 CrossRef CAS.
- S. A. Freunberger, Nat. Energy, 2017, 2, 17091 CrossRef (in press).
- K. G. Gallagher, S. Goebel, T. Greszler, M. Mathias, W. Oelerich, D. Eroglu and V. Srinivasan, Energy Environ. Sci., 2014, 7, 1555–1563 CAS.
- T. Liu, M. Leskes, W. Yu, A. J. Moore, L. Zhou, P. M. Bayley, G. Kim and C. P. Grey, Science, 2015, 350, 530–533 CrossRef CAS PubMed.
- J. Lu, Y. Jung Lee, X. Luo, K. Chun Lau, M. Asadi, H.-H. Wang, S. Brombosz, J. Wen, D. Zhai, Z. Chen, D. J. Miller, Y. Sub Jeong, J.-B. Park, Z. Zak Fang, B. Kumar, A. Salehi-Khojin, Y.-K. Sun, L. A. Curtiss and K. Amine, Nature, 2016, 529, 377–382 CrossRef CAS PubMed.
- C. O. Laoire, S. Mukerjee, K. M. Abraham, E. J. Plichta and M. A. Hendrickson, J. Phys. Chem. C, 2010, 114, 9178–9186 CAS.
- B. D. McCloskey, R. Scheffler, A. Speidel, G. Girishkumar and A. C. Luntz, J. Phys. Chem. C, 2012, 116, 23897–23905 CAS.
- V. Viswanathan, K. S. Thygesen, J. S. Hummelshoj, J. K. Norskov, G. Girishkumar, B. D. McCloskey and A. C. Luntz, J. Chem. Phys., 2011, 135, 214704 CrossRef CAS PubMed.
- L. Johnson, C. Li, Z. Liu, Y. Chen, S. A. Freunberger, J.-M. Tarascon, P. C. Ashok, B. B. Praveen, K. Dholakia and P. G. Bruce, Nat. Chem., 2014, 6, 1091–1099 CrossRef CAS PubMed.
- N. B. Aetukuri, B. D. McCloskey, J. M. García, L. E. Krupp, V. Viswanathan and A. C. Luntz, Nat. Chem., 2015, 7, 50–56 CrossRef CAS PubMed.
- D. G. Kwabi, V. S. Bryantsev, T. P. Batcho, D. M. Itkis, C. V. Thompson and Y. Shao-Horn, Angew. Chem., Int. Ed., 2016, 55, 3129–3134 CrossRef CAS PubMed.
- V. Gutmann, Coord. Chem. Rev., 1976, 18, 225–255 CrossRef CAS.
- C. M. Burke, V. Pande, A. Khetan, V. Viswanathan and B. D. McCloskey, Proc. Natl. Acad. Sci. U. S. A., 2015, 112, 9293–9298 CrossRef CAS PubMed.
- D. Sharon, D. Hirsberg, M. Salama, M. Afri, A. A. Frimer, M. Noked, W. Kwak, Y.-K. Sun and D. Aurbach, ACS Appl. Mater. Interfaces, 2016, 8(8), 5300–5307 CAS.
- I. Gunasekara, S. Mukerjee, E. J. Plichta, M. A. Hendrickson and K. M. Abraham, J. Electrochem. Soc., 2015, 162, A1055–A1066 CrossRef CAS.
- D. Sharon, D. Hirsberg, M. Afri, F. Chesneau, R. Lavi, A. A. Frimer, Y.-K. Sun and D. Aurbach, ACS Appl. Mater. Interfaces, 2015, 7, 16590–16600 CAS.
- K. U. Schwenke, M. Metzger, T. Restle, M. Piana and H. A. Gasteiger, J. Electrochem. Soc., 2015, 162, A573–A584 CrossRef CAS.
- D. G. Kwabi, T. P. Batcho, S. Feng, L. Giordano, C. V. Thompson and Y. Shao-Horn, Phys. Chem. Chem. Phys., 2016, 18, 24944–24953 RSC.
- C. Li, O. Fontaine, S. A. Freunberger, L. Johnson, S. Grugeon, S. Laruelle, P. G. Bruce and M. Armand, J. Phys. Chem. C, 2014, 118, 3393–3401 CAS.
- X. Gao, Z. P. Jovanov, Y. Chen, L. R. Johnson and P. G. Bruce, Angew. Chem., Int. Ed., 2017, 56(23), 6539–6543 CrossRef CAS PubMed.
- A. Khetan, A. Luntz and V. Viswanathan, J. Phys. Chem. Lett., 2015, 6, 1254–1259 CrossRef CAS PubMed.
- N. Mahne, B. Schafzahl, C. Leypold, M. Leypold, S. Grumm, A. Leitgeb, G. A. Strohmeier, M. Wilkening, O. Fontaine, D. Kramer, C. Slugovc, S. M. Borisov and S. A. Freunberger, Nat. Energy, 2017, 2, 17036 CrossRef CAS.
- B. D. Adams, C. Radtke, R. Black, M. L. Trudeau, K. Zaghib and L. F. Nazar, Energy Environ. Sci., 2013, 6, 1772–1778 CAS.
- Y. Zhang, X. Zhang, J. Wang, W. C. McKee, Y. Xu and Z. Peng, J. Phys. Chem. C, 2016, 120, 3690–3698 CAS.
- C. J. Bondue, P. P. Bawol, A. A. Abd-El-Latif, P. Reinsberg and H. Baltruschat, J. Phys. Chem. C, 2017, 121, 8864–8872 CAS.
- K. B. Knudsen, T. Vegge, B. D. McCloskey and J. Hjelm, J. Electrochem. Soc., 2016, 163, A2065–A2071 CrossRef CAS.
- Z. Li, S. Ganapathy, Y. Xu, J. R. Heringa, Q. Zhu, W. Chen and M. Wagemaker, Chem. Mater., 2017, 29, 1577–1586 CrossRef CAS PubMed.
- Y. Mo, S. P. Ong and G. Ceder, Phys. Rev. B: Condens. Matter Mater. Phys., 2011, 84, 205446 CrossRef.
- J. S. Hummelshoj, A. C. Luntz and J. K. Norskov, J. Chem. Phys., 2013, 138, 034703 CrossRef CAS PubMed.
- S. Kang, Y. Mo, S. P. Ong and G. Ceder, Chem. Mater., 2013, 25, 3328–3336 CrossRef CAS.
- V. Viswanathan, J. K. Nørskov, A. Speidel, R. Scheffler, S. Gowda and A. C. Luntz, J. Phys. Chem. Lett., 2013, 556–560, DOI:10.1021/jz400019y.
- Y. Chen, S. A. Freunberger, Z. Peng, F. Bardé and P. G. Bruce, J. Am. Chem. Soc., 2012, 134, 7952–7957 CrossRef CAS PubMed.
- S. Ganapathy, B. D. Adams, G. Stenou, M. S. Anastasaki, K. Goubitz, X.-F. Miao, L. F. Nazar and M. Wagemaker, J. Am. Chem. Soc., 2014, 136, 16335–16344 CrossRef CAS PubMed.
- A. C. Luntz, V. Viswanathan, J. Voss, J. B. Varley, J. K. Norskov, R. Scheffler and A. Speidel, J. Phys. Chem. Lett., 2013, 4(20), 3494–3499 CrossRef CAS.
- M. D. Radin and D. J. Siegel, Energy Environ. Sci., 2013, 6, 2370–2379 CAS.
- Y. Zhang, Q. Cui, X. Zhang, W. C. McKee, Y. Xu, S. Ling, H. Li, G. Zhong, Y. Yang and Z. Peng, Angew. Chem., Int. Ed., 2016, 55, 10717–10721 CrossRef CAS PubMed.
- A. Dunst, V. Epp, I. Hanzu, S. A. Freunberger and M. Wilkening, Energy Environ. Sci., 2014, 7, 2739–2752 CAS.
- O. Gerbig, R. Merkle and J. Maier, Adv. Mater., 2013, 25, 3129–3133 CrossRef CAS PubMed.
- F. Tian, M. D. Radin and D. J. Siegel, Chem. Mater., 2014, 26, 2952–2959 CrossRef CAS.
- J. Wang, Y. Zhang, L. Guo, E. Wang and Z. Peng, Angew. Chem., Int. Ed., 2016, 55(17), 5201–5205 CrossRef CAS PubMed.
- B. D. McCloskey, A. Speidel, R. Scheffler, D. C. Miller, V. Viswanathan, J. S. Hummelshøj, J. K. Nørskov and A. C. Luntz, J. Phys. Chem. Lett., 2012, 3, 997–1001 CrossRef CAS PubMed.
- M. M. Ottakam Thotiyl, S. A. Freunberger, Z. Peng and P. G. Bruce, J. Am. Chem. Soc., 2013, 135, 494–500 CrossRef CAS PubMed.
- R. Black, J.-H. Lee, B. Adams, C. A. Mims and L. F. Nazar, Angew. Chem., Int. Ed., 2013, 52, 392–396 CrossRef CAS PubMed.
- S. A. Freunberger, Y. Chen, N. E. Drewett, L. J. Hardwick, F. Bardé and P. G. Bruce, Angew. Chem., Int. Ed., 2011, 50, 8609–8613 CrossRef CAS PubMed.
- S. A. Freunberger, Y. Chen, Z. Peng, J. M. Griffin, L. J. Hardwick, F. Bardé, P. Novák and P. G. Bruce, J. Am. Chem. Soc., 2011, 133, 8040–8047 CrossRef CAS PubMed.
- B. D. McCloskey, D. S. Bethune, R. M. Shelby, G. Girishkumar and A. C. Luntz, J. Phys. Chem. Lett., 2011, 2, 1161–1166 CrossRef CAS PubMed.
- B. D. McCloskey, A. Valery, A. C. Luntz, S. R. Gowda, G. M. Wallraff, J. M. Garcia, T. Mori and L. E. Krupp, J. Phys. Chem. Lett., 2013, 2989–2993, DOI:10.1021/jz401659f.
- J. Yang, D. Zhai, H.-H. Wang, K. C. Lau, J. A. Schlueter, P. Du, D. J. Myers, Y.-K. Sun, L. A. Curtiss and K. Amine, Phys. Chem. Chem. Phys., 2013, 15, 3764–3771 RSC.
- B. D. McCloskey, R. Scheffler, A. Speidel, D. S. Bethune, R. M. Shelby and A. C. Luntz, J. Am. Chem. Soc., 2011, 133, 18038–18041 CrossRef CAS PubMed.
- Z. Peng, S. A. Freunberger, Y. Chen and P. G. Bruce, Science, 2012, 337, 563–566 CrossRef CAS PubMed.
- M. M. Ottakam Thotiyl, S. A. Freunberger, Z. Peng, Y. Chen, Z. Liu and P. G. Bruce, Nat. Mater., 2013, 12, 1050–1056 CrossRef CAS PubMed.
- B. D. McCloskey, D. S. Bethune, R. M. Shelby, T. Mori, R. Scheffler, A. Speidel, M. Sherwood and A. C. Luntz, J. Phys. Chem. Lett., 2012, 3, 3043–3047 CrossRef CAS PubMed.
- P. Hartmann, C. L. Bender, J. Sann, A. K. Durr, M. Jansen, J. Janek and P. Adelhelm, Phys. Chem. Chem. Phys., 2013, 15, 11661–11672 RSC.
- D. T. Sawyer and J. S. Valentine, Acc. Chem. Res., 1981, 14, 393–400 CrossRef CAS.
- D. Aurbach, M. Daroux, P. Faguy and E. Yeager, J. Electroanal. Chem., 1991, 297, 225–244 CrossRef CAS.
- V. S. Bryantsev, V. Giordani, W. Walker, M. Blanco, S. Zecevic, K. Sasaki, J. Uddin, D. Addison and G. V. Chase, J. Phys. Chem. A, 2011, 115, 12399–12409 CrossRef CAS PubMed.
- V. S. Bryantsev, Chem. Phys. Lett., 2013, 558, 42–47 CrossRef CAS.
- V. S. Bryantsev, M. Blanco and F. Faglioni, J. Phys. Chem. A, 2010, 114, 8165–8169 CrossRef CAS PubMed.
- V. S. Bryantsev and F. Faglioni, J. Phys. Chem. A, 2012, 116, 7128–7138 CrossRef CAS PubMed.
- R. S. Assary, K. C. Lau, K. Amine, Y.-K. Sun and L. A. Curtiss, J. Phys. Chem. C, 2013, 117, 8041–8049 CAS.
- B. Liu, W. Xu, P. Yan, X. Sun, M. E. Bowden, J. Read, J. Qian, D. Mei, C.-M. Wang and J.-G. Zhang, Adv. Funct. Mater., 2016, 26, 605–613 CrossRef CAS.
- C. P. Andrieux, P. Hapiot and J. M. Saveant, J. Am. Chem. Soc., 1987, 109, 3768–3775 CrossRef CAS.
- B. Genorio, J. Staszak-Jirkovský, R. S. Assary, J. G. Connell, D. Strmcnik, C. E. Diesendruck, P. P. Lopes, V. R. Stamenkovic, J. S. Moore, L. A. Curtiss and N. M. Markovic, J. Phys. Chem. C, 2016, 120, 15909–15914 CAS.
- Z. Zhang, J. Lu, R. S. Assary, P. Du, H.-H. Wang, Y.-K. Sun, Y. Qin, K. C. Lau, J. Greeley, P. C. Redfern, H. Iddir, L. A. Curtiss and K. Amine, J. Phys. Chem. C, 2011, 115, 25535–25542 CAS.
- M. Carboni, A. G. Marrani, R. Spezia and S. Brutti, Chem.–Eur. J., 2016, 22, 17188–17203 CrossRef CAS PubMed.
- A. Khetan, H. Pitsch and V. Viswanathan, J. Phys. Chem. Lett., 2014, 5, 2419–2424 CrossRef CAS PubMed.
- J. Hassoun, F. Croce, M. Armand and B. Scrosati, Angew. Chem., Int. Ed., 2011, 50, 2999–3002 CrossRef CAS PubMed.
- Q. Li, F. Chen, W. Zhao, M. Xu, B. Fang, Y. Zhang, L. Duo, Y. Jin and F. Sang, Bull. Korean Chem. Soc., 2007, 28, 1656–1660 CrossRef CAS.
- J. Wandt, P. Jakes, J. Granwehr, H. A. Gasteiger and R.-A. Eichel, Angew. Chem., Int. Ed., 2016, 55, 6892–6895 CrossRef CAS PubMed.
- A. U. Khan, J. Am. Chem. Soc., 1981, 103, 6516–6517 CrossRef CAS.
- W. H. Koppenol, Nature, 1976, 262, 420–421 CrossRef CAS PubMed.
- C. L. Bender, P. Hartmann, M. Vračar, P. Adelhelm and J. Janek, Adv. Energy Mater., 2014, 4, 1–10 Search PubMed.
- R. H. Snow, U. S. Govt. Res. Dev. Rept., 1965, 41, pp. 1–34 Search PubMed.
- A. U. Khan, Photochem. Photobiol., 1978, 28, 615–626 CrossRef CAS.
- Y.-C. Lu, B. M. Gallant, D. G. Kwabi, J. R. Harding, R. R. Mitchell, M. S. Whittingham and Y. Shao-Horn, Energy Environ. Sci., 2013, 6, 750–768 CAS.
- J. K. Papp, J. D. Forster, C. M. Burke, H. W. Kim, A. C. Luntz, R. M. Shelby, J. J. Urban and B. D. McCloskey, J. Phys. Chem. Lett., 2017, 1169–1174, DOI:10.1021/acs.jpclett.7b00040.
- Y. G. Zhu, Q. Liu, Y. Rong, H. Chen, J. Yang, C. Jia, L.-J. Yu, A. Karton, Y. Ren, X. Xu, S. Adams and Q. Wang, Nat. Commun., 2017, 8, 14308 CrossRef CAS PubMed.
- C. M. Burke, R. Black, I. R. Kochetkov, V. Giordani, D. Addison, L. F. Nazar and B. D. McCloskey, ACS Energy Lett., 2016, 1(4), 747–756 CrossRef CAS.
- W. Yin, A. Grimaud, F. Lepoivre, C. Yang and J.-M. Tarascon, J. Phys. Chem. Lett., 2017, 8(1), 214–222 CrossRef CAS PubMed.
- S. R. Gowda, A. Brunet, G. M. Wallraff and B. D. McCloskey, J. Phys. Chem. Lett., 2012, 4, 276–279 CrossRef PubMed.
- D. M. Itkis, D. A. Semenenko, E. Y. Kataev, A. I. Belova, V. S. Neudachina, A. P. Sirotina, M. Hävecker, D. Teschner, A. Knop-Gericke, P. Dudin, A. Barinov, E. A. Goodilin, Y. Shao-Horn and L. V. Yashina, Nano Lett., 2013, 13, 4697–4701 CrossRef CAS PubMed.
- B. D. Adams, R. Black, C. Radtke, Z. Williams, B. L. Mehdi, N. D. Browning and L. F. Nazar, ACS Nano, 2014, 8, 12483–12493 CrossRef CAS PubMed.
- L. Nazar, D. Kundu, R. Black and E. Jamstorp, Energy Environ. Sci., 2015, 8, 1292–1298 Search PubMed.
- C. V. Amanchukwu, J. R. Harding, Y. Shao-Horn and P. T. Hammond, Chem. Mater., 2015, 27(2), 550–561 CrossRef CAS.
- E. Nasybulin, W. Xu, M. H. Engelhard, Z. Nie, X. S. Li and J.-G. Zhang, J. Power Sources, 2013, 243, 899–907 CrossRef CAS.
- Z. Peng, S. A. Freunberger, L. J. Hardwick, Y. Chen, V. Giordani, F. Bardé, P. Novák, D. Graham, J.-M. Tarascon and P. G. Bruce, Angew. Chem., Int. Ed., 2011, 50, 6351–6355 CrossRef CAS PubMed.
- G. Blanquer, Y. Yin, M. A. Quiroga and A. A. Franco, J. Electrochem. Soc., 2016, 163, A329–A337 CrossRef CAS.
- M. D. Radin, C. W. Monroe and D. J. Siegel, Chem. Mater., 2015, 27, 839–847 CrossRef CAS.
- V. Giordani, S. A. Freunberger, P. G. Bruce, J.-M. Tarascon and D. Larcher, Electrochem. Solid-State Lett., 2010, 13, A180–A183 CrossRef CAS.
- E. Mourad, L. Coustan, P. Lannelongue, D. Zigah, A. Mehdi, A. Vioux, S. A. Freunberger, F. Favier and O. Fontaine, Nat. Mater., 2016, 16, 446–453 CrossRef PubMed.
- M. J. Lacey, J. T. Frith and J. R. Owen, Electrochem. Commun., 2013, 26, 74–76 CrossRef CAS.
- L. Yang, J. T. Frith, N. Garcia-Araez and J. R. Owen, Chem. Commun., 2015, 51, 1705–1708 RSC.
- D. Sun, Y. Shen, W. Zhang, L. Yu, Z. Yi, W. Yin, D. Wang, Y. Huang, J. Wang, D. Wang and J. B. Goodenough, J. Am. Chem. Soc., 2014, 136, 8941–8946 CrossRef CAS PubMed.
- X. Gao, Y. Chen, L. Johnson and P. G. Bruce, Nat. Mater., 2016, 15, 882–888 CrossRef CAS PubMed.
- V. Giordani, presented in part at the Abstract for 16th IMLB, Jeju, Korea, 2012, pp. S6–S3 Search PubMed.
- Y. Chen, S. A. Freunberger, Z. Peng, O. Fontaine and P. G. Bruce, Nat. Chem., 2013, 5, 489–494 CrossRef CAS PubMed.
- H.-D. Lim, B. Lee, Y. Zheng, J. Hong, J. Kim, H. Gwon, Y. Ko, M. Lee, K. Cho and K. Kang, Nat. Energy, 2016, 1, 16066 CrossRef CAS.
- D. Kundu, R. Black, B. Adams and L. F. Nazar, ACS Cent. Sci., 2015, 1, 510–515 CrossRef CAS PubMed.
- B. G. Kim, J.-S. Kim, J. Min, Y.-H. Lee, J. H. Choi, M. C. Jang, S. A. Freunberger and J. W. Choi, Adv. Funct. Mater., 2016, 26(11), 1747–1756 CrossRef CAS.
| This journal is © The Royal Society of Chemistry 2017 |