 Open Access Article
A flow cytometry assay to quantify intercellular exchange of membrane components†
Dimitrios
Poulcharidis
 ab,
Kimberley
Belfor
a,
Alexander
Kros
 *b and
Sander I.
van Kasteren
 *a
*a
aDivision of Bio-organic Synthesis, Leiden Institute of Chemistry, Gorlaeus Laboratories, Leiden University, Leiden, The Netherlands. E-mail: s.i.van.kasteren@chem.leidenuniv.nl
bDivision of Supramolecular and Biomaterials Chemistry, Leiden Institute of Chemistry, Leiden University, Einsteinweg 55, 2333 CC Leiden, The Netherlands. E-mail: a.kros@chem.leidenuniv.nl
First published on 24th May 2017
Abstract
Membrane-compound exchange is vital for cell-to-cell communication, yet quantification of this process is difficult. Here we present a method using flow cytometry in combination with bioorthogonal and fluorescent labelling techniques to quantify the amount of exchange of cholesterol and sialylated compounds between cells. We demonstrate that direct cell–cell contact is the likely mechanism of sterol-exchange and show that by manipulating the contact time between cells using complementary coiled-coil peptides results in an enhanced exchange rate of membrane components between cells.
Introduction
The ability of cells to communicate with one another is one of the most important characteristics of eukaryotic and prokaryotic cells.1,2 Some of this communication occurs by exchange of soluble cellular components between cells, such as peptides, larger proteins, individual amino acids and nucleotides;2 by exosome secretion3 or through direct exchange of membrane components.4 This direct exchange of cellular components between neighbouring eukaryotic cells remains poorly characterized and its involvement in cell–cell communication between neighbouring cells requires further study.5Many cell wall components are not under direct genetic control. For example, in model systems, radiolabelled or fluorescently-labelled cholesterol has been shown to exchange intracellularly between organelles,6 liposomes7 as well as between serum and erythrocytes.8 The rate of lipid exchange in liposomes varies depending on the solubility, the acyl-chain, the length of the fatty acid and the hydrophobicity.7,9,10 For example most phosphatidylcholines (PtdCho) in cells with 16 or more carbons acyl chains, have a transfer half-time of 83 h.9–11 On the other hand, 25-hydroxycholesterols (25OH) is more hydrophilic than cholesterol and therefore exchanges more rapidly,9,12,13 whereas cholesteryl oleate is more hydrophobic than cholesterol and exchanges more slowly.9
Exchange of cholesterol was also recently reported between host cells and bacteria i.e. Borrelia burgdorferi to be a very important process in the pathogenesis or infectivity of pathogens.14
Aside from these examples of cholesterol exchange, the study of membrane component exchange is relatively underexplored,15,16 especially in mammalian cell systems. The dynamics and kinetics of membrane compound exchange-critically impacts several important biological functions in cells including signal transduction, cell–cell recognition, energy production and conversion, cell adhesion and foreign molecule identification.17,18
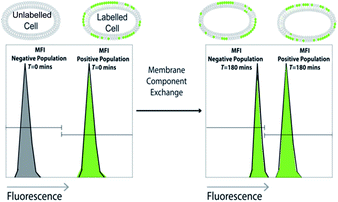
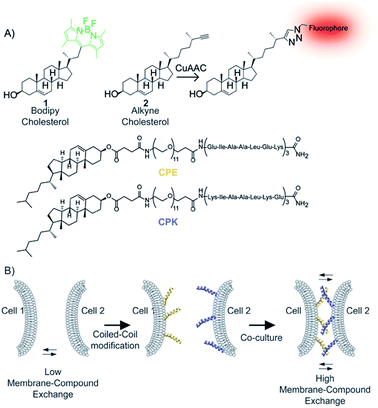
Here we present an adaptable strategy utilising flow cytometry in which we use labelled membrane components to quantify their exchange rates (Scheme 1) between mammalian cells in co-culture, quantify the interactions between glycans and membrane lipids and understand the exchange mechanism. We use this approach to study the exchange of fluorescently labelled cholesterol,19 alkyne-modified cholesterol,20 and azide-modified sialic acids.21 The latter two are visualised in a 2-step bioorthogonal method.22,23 Using our approach we show that the rate of sterol exchange is cell-line dependent and that the rate of sialic acid-containing component exchange is significantly slower than that of the sterolic lipids. Finally, we show that a non-exchanging cell line can be forced to exchange both sterols when forced into prolonged close proximity using complementary coiled-coils,24,25 suggesting that lipid exchange mediated by direct contact is the dominant mechanism of sterol-exchange in these cells.
Results and discussion
Cell-type dependent lipid exchange
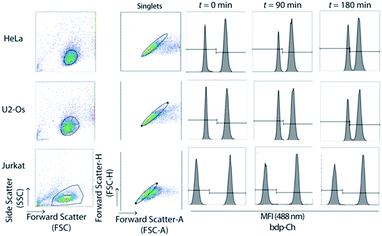
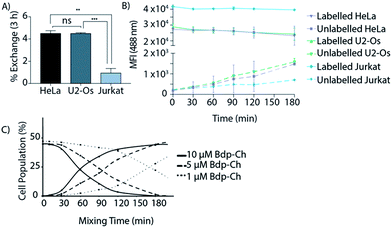
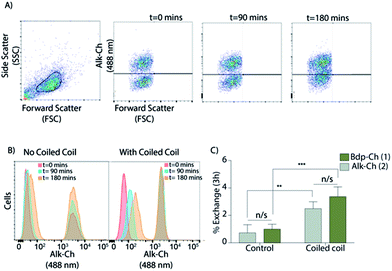
Our initial aim was to develop a broadly deployable assay that would allow the facile quantification and mechanistic characterisation of the exchange of membrane components between cells by flow cytometry (Scheme 1). We first used the recently reported bodipy-modified cholesterol (1, Avanti Scheme 2), which readily inserts into eukaryotic cell membranes.19To study whether exchange of this lipid could be observed we incubated HeLa,26 U2-Os,27 Jurkat,28 AMO29 and B3Z-T-cells30 with 1 as described (see ESI†).19 Unlabelled cells were then mixed with labelled cells and co-cultured at 37 °C for different times. The amount of exchange of the fluorescently-labelled cholesterol over time between these two populations was then determined using flow cytometry (Fig. 1 and S1A†). In this assay, the rate of exchange of 1 was shown to vary significantly between the different cell lines: after 3 h HeLa and U2-Os had exchanged 4.5 ± 0.17% and 4.4 ± 0.05% of 1 respectively. Jurkat, AMO and B3Z cells on the other hand had exchanged <1% (0.9 ± 0.23%, 0.4 ± 0.03% and 0.6 ± 0.12% respectively) (Fig. 2A and B). No exchange between suspension cell lines (which have limited cell–cell contact) was observed, which led us to hypothesize that cell–cell contact might be the driver for membrane lipid exchange. The rate of exchange (% exchange, ΔMFI, eqn (1)) was normalised to live cells based on scatter plots and cellular fluorescence. The ΔMFI was calculated as the amount of fluorescent intensity the unlabelled (negative) cells gained at time t = 180 min of co-culture with labelled (positive) cells in correlation with the total fluorescent intensity (the initial fluorescently labelled cell population) (see eqn (1)).
 | (1) |
Upon flow cytometry analysis, the cell populations were gated based on forward scatter-Area (FSA-A) and side scatter-Area (SSC-A) characteristics (cell doublets were gated out using FSC-A vs. FSC-H). An increase in the percentage of a new-labelled cell population and a decrease in the number of unlabelled cells was observed, indicating that rate of exchange of cholesterol 1 is concentration dependent (Fig. 2C).
In order to study that the observed exchange rates were not due to the fluorescent label, unmodified bodipy-488 was used as a control and as expected did not exchange (Fig. S2†), showing that the sterol moiety is essential for the exchange reaction.
Altering the ratio of labelled vs. unlabelled cells (1![[thin space (1/6-em)]](https://www.rsc.org/images/entities/char_2009.gif) :
:![[thin space (1/6-em)]](https://www.rsc.org/images/entities/char_2009.gif) 1, 1
1, 1![[thin space (1/6-em)]](https://www.rsc.org/images/entities/char_2009.gif) :
:![[thin space (1/6-em)]](https://www.rsc.org/images/entities/char_2009.gif) 5, 1
5, 1![[thin space (1/6-em)]](https://www.rsc.org/images/entities/char_2009.gif) :
:![[thin space (1/6-em)]](https://www.rsc.org/images/entities/char_2009.gif) 10) and vice versa, or increasing the culture volume, also affected the rate of exchange (Fig. S3†) showing that close contact is necessary for the membrane-compound exchange. It was found that the higher the fraction of labelled cells, the faster the exchange: 1
10) and vice versa, or increasing the culture volume, also affected the rate of exchange (Fig. S3†) showing that close contact is necessary for the membrane-compound exchange. It was found that the higher the fraction of labelled cells, the faster the exchange: 1![[thin space (1/6-em)]](https://www.rsc.org/images/entities/char_2009.gif) :
:![[thin space (1/6-em)]](https://www.rsc.org/images/entities/char_2009.gif) 1 ratios exchanged 19 times faster than a 1
1 ratios exchanged 19 times faster than a 1![[thin space (1/6-em)]](https://www.rsc.org/images/entities/char_2009.gif) :
:![[thin space (1/6-em)]](https://www.rsc.org/images/entities/char_2009.gif) 10 ratio of labelled vs. unlabelled cells (3.9 ± 0.5% vs. 0.2 ± 0.05%; Fig. S3†). In order to exclude the fact that the observed cholesterol exchange was due to endocytosis of cell debris, passively uptake from dead cells or exosomes, but due to a live-cell dependent process, we performed a series of different control experiments. Cell viability in the co-culture experiments was assessed prior to flow cytometry using the (live-cell impermeable) dye propidium iodide (PI). Cell death in all co-culture experiments was equal to controls and was always <2% (Fig. S4B and C†).
10 ratio of labelled vs. unlabelled cells (3.9 ± 0.5% vs. 0.2 ± 0.05%; Fig. S3†). In order to exclude the fact that the observed cholesterol exchange was due to endocytosis of cell debris, passively uptake from dead cells or exosomes, but due to a live-cell dependent process, we performed a series of different control experiments. Cell viability in the co-culture experiments was assessed prior to flow cytometry using the (live-cell impermeable) dye propidium iodide (PI). Cell death in all co-culture experiments was equal to controls and was always <2% (Fig. S4B and C†).
In order to exclude the fact that the observed cholesterol exchange was due to endocytosis of cell debris from this 2% of dead cells, unlabelled cells were co-cultured with the lysate of cells labelled with 1. In this system, there was not any lipid uptake or fluorescent labelling after 3 h (Fig. S4A†) at a lysate concentration representing of 5% dead cells.
In order to determine whether exchange of lipids was energy-dependent, we used sodium azide, or low temperature as well-established metabolic inhibitors of ATP-production.31–33 Upon ATP depletion with sodium azide or low-temperature, membrane lipid exchange was minimised or abolished respectively indicating that the cholesterol exchange is energy dependent (Fig. S5†).
Chemical fixation (to inactivate all biochemistry in the cell34,35) prior to mixing abolished all exchange (Fig. S1B†) indicating that the lipid exchange is a live-cell dependent process.
To study whether the mechanism of exchange was based on the exchange of exosomes, the exchange of free 1 or cell–cell contact, we spatially separated the unlabelled and labelled populations in a trans-well assay (Fig. S6†).36 All sterol exchange was abolished, even when large-pore (0.4 μm) membranes were used (through which exosomes can pass, but cells cannot37), indicating that cell–cell contact is most likely responsible for the exchange of 1. The absence of any incorporation of 1 in unlabelled cells after a supernatant transfer from a labelled population (Fig. S7†) strongly supports the hypothesis that cell–cell contact is the main method of exchange of cholesterol in this system.
Coiled-coil complementation enhanced lipid exchange
To further investigate that close contact between cells is important for lipid transfer, we tested whether forcing the cells into prolonged close proximity would enhance the exchange rate. For this a supramolecular approach was chosen, in which a pair of complementary lipidated coiled-coil (CC) peptide was introduced24,25 to force cells in close proximity in a non-covalent manner (Scheme 2). Coiled-coil-forming peptides E [(EIAALEK)3] and K [(KIAALKE)3] conjugated via a poly(ethylene glycol)12 spacer with a cholesterol moiety (denoted CPE or CPK respectively) have been reported to insert spontaneously into cell membranes,38–43 and were used here lipid exchange study.To study the effect of forced proximity on cholesterol exchange we used lymphocytic Jurkat cells as it showed the lowest exchange rate (Fig. 2A). The cells were labelled overnight with 1 and after washing were incubated with 5 μM cholesterol-CPE. In parallel, unlabelled cells were treated with 5 μM CPK. Next, the CPE- and CPK-modified Jurkat cells were mixed and the rate of exchange of 1 was determined. Flow cytometry results indicate that upon coiled-coil formation between CPE- and CPK-modified cells, membrane-cholesterol exchange was enhanced 3-fold (from 1.0 ± 0.18% to 3.3 ± 0.35%) compared to CC peptide untreated cells. The results are suggestive of the exchange rate of 1 being enhanced by forced membrane contact (Fig. 3C and S8B†). Confocal microscopy after 3 h confirmed that upon coiled-coil formation cells were coming in close proximity (Fig. S8A†).
Glycan exchange between live mammalian cells
Many membrane components are not amenable to selective fluorophore labelling and the bulky nature of such groups can affect the biological properties of the parent molecule. After establishing the exchange rate of fluorophore modified cholesterol 1 between different cell types and manipulating these rates of exchange through forcing cell–cell contacts, we wanted to combine the cytometry analysis with the detection of bioorthogonal groups in a 2-step approach44 to monitor the exchange of other membrane components.Bioorthogonal chemistry can be used to visualise non-genetically templated biomolecules in cells by means of incorporating a small biologically inert chemical group into a biomolecule-class of choice and visualising these at the end of an experiment using tag-selective ligation chemistry.22,23 The main advantage of this approach is that the small and stable bioorthogonal groups can be incorporated into non-templated molecules and then can hijack the biosynthetic pathways of these molecules. This approach has been used extensively to label many different cell biomolecules, such as glycans, lipids and nucleotides.45,46 To determine whether a 2-step bioorthogonal approach could be used to measure exchange kinetics, we first validated the approach using the recently reported alkyne-modified cholesterol (2, Avanti).20 In a coiled-coil-enhanced exchange experiment in non-adherent Jurkat cells, a comparable 2.5-fold increase in the exchange rate with and without coiled-coil treatment was observed (from 0.7 ± 0.30% without CC to 2.5 ± 0.25% with CC after 3 h; Fig. 3 and S9†). For this experiment, live-cell compatible variants of the copper-catalyzed azide–alkyne cycloaddition (CuAAC) were initially used.47
We initially optimised ccHc conditions using a population-based viability assays (WST-1 and 7-AAD assays). Based on previously reported protocols48–50 using lower copper concentrations in combination with chelating ligands (TTMA, THPTA, BTTAA etc.) toxicity was minimized (Fig. S11†). However, under the CuAAC-conditions used, the cells displayed aberrant morphology indicating stress or early cell death52 (Fig. S10†), leading us to abandon the live cell CuAAC-attempts in favour of protocol consisting of a fixation step prior to performing the CuAAC reaction.35,51
Having established the suitability (and limitations) of a bioorthogonal approach to detect cholesterol exchange, we used a similar approach to determine whether we could also monitor the exchange of another integral membrane component: sialoglycoproteins and sialoglycolipids.
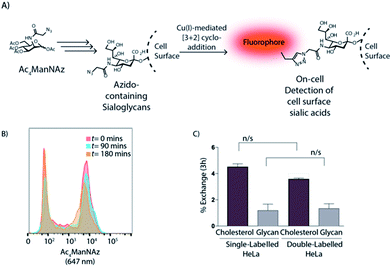
These vital membrane components have been associated with cell–cell communication, metastatic behaviour, human disease and cell recognition.53 We first labelled HeLa-cells using a bioorthogonal analogue of the metabolic precursor of sialic acid, per-O-acetylated N-2-azidoacetylmannosamine (Ac4ManNAz),21 which is converted to sialic acid in cellulo and transferred to nascent galactose-terminated glycans in the trans-Golgi network (Fig. 4A). Here, HeLa cells were treated as described49,54–56 with 50 μM Ac4ManNAz for 72 h prior to mixing and co-culturing with untreated HeLa cells. Flow cytometry after paraformaldehyde fixation (2%) showed that the rate of exchange of the sialoglycome was significantly slower (0.98 ± 0.40% after 3 h) compared to cholesterol exchange (Fig. 4B and C and S12†).
This lack of exchange was not due to the Ac4ManNAz-labelling, as the exchange of 1 in cells labelled with both Ac4ManNAz and 1 was unaffected (Fig. 4C). We can only speculate about the biological significance of the absence of exchange: the observed slower exchange of glycans between cells may reflect reduced freedom of movement of these larger sialoglycolipids in the cell membrane; or their specific function in cell adhesion.57–59
Conclusions
In conclusion, this study demonstrates that different mammalian cells exchange membrane components in a time- and cell-type dependent manner. This exchange appears to be due to cell–cell contacts and can be enhanced when cells are forced in close proximity. The exchange of sialylated membrane components appears to be significantly slower compared to sterols, indicating the presence of differential control mechanisms of exchange for these components. Isotope-labelled cholesterol in combination with mass spectroscopy and targeted metabolomics could be used in later stage for validation of the aforementioned technique. These experiments could be used to study the exchange of other lipids as well, such as inflammatory mediators60,61 and mediators of neuronal signaling62,63 as these have been shown to be amenable to bioorthogonal or fluorescent modification.64 This will likely help to improve understanding of the role of these compounds in cell-to-cell communication, cell interactions and disease development.Acknowledgements
SIvK was funded by an ERC Starting Grant (Number 639005). SIvK, and AK were also funded by the Netherlands Scientific Council (NWO) via a VICI grant (724.014.001).References
- C. M. Waters and B. L. Bassler, Annu. Rev. Cell Dev. Biol., 2005, 21, 319–346 CrossRef CAS PubMed.
- P. H. Raven, G. B. Johnson, J. B. Losos and S. R. Singer, in Biology, 2004 Search PubMed.
- R. C. Lai, F. Arslan, M. M. Lee, N. S. K. Sze, A. Choo, T. S. Chen, M. Salto-Tellez, L. Timmers, C. N. Lee, R. M. El Oakley, G. Pasterkamp, D. P. V de Kleijn and S. K. Lim, Stem Cell Res., 2010, 4, 214–222 CrossRef CAS PubMed.
- G. Turturici, R. Tinnirello, G. Sconzo and F. Geraci, Am. J. Physiol.: Cell Physiol., 2014, 306, C621–C633 CrossRef CAS PubMed.
- X. Niu, K. Gupta, J. T. Yang, M. J. Shamblott and A. Levchenko, J. Cell Sci., 2009, 122, 600–610 CrossRef CAS PubMed.
- E. Ikonen, Nat. Rev. Mol. Cell Biol., 2008, 9, 125–138 CrossRef CAS PubMed.
- K. A. Solanko, M. Modzel, L. M. Solanko and D. Wüstner, Lipid Insights, 2015, 8, 95–114 Search PubMed.
- Y. Lange, C. M. Cohen and M. J. Poznansky, Proc. Natl. Acad. Sci. U. S. A., 1977, 74, 1538–1542 CrossRef CAS.
- S. Lev, Nat. Rev. Mol. Cell Biol., 2010, 11, 739–750 CrossRef CAS PubMed.
- J. E. Ferrell Jr, K. J. Lee and W. H. Huestis, Biochemistry, 1985, 24, 2857–2864 CrossRef CAS.
- L. R. McLean and M. C. Phillips, Biochemistry, 1984, 23, 4624–4630 CrossRef CAS PubMed.
- M. C. Phillips, W. J. Johnson and G. H. Rothblat, Biochemistry, 1987, 906, 223–276 CAS.
- W. A. Prinz, Prog. Lipid Res., 2007, 46, 297–314 CrossRef CAS PubMed.
- J. T. Crowley, A. M. Toledo, T. J. LaRocca, J. L. Coleman, E. London and J. L. Benach, PLoS Pathog., 2013, 9, e1003109 CAS.
- M. Mittelbrunn and F. Sánchez-Madrid, Nat. Rev. Mol. Cell Biol., 2012, 13, 328–335 CAS.
- A. M. Skinner, S. L. O'Neil and P. Kurre, PLoS One, 2009, 4, e6219 Search PubMed.
- M. A. Deverall, E. Gindl, E.-K. Sinner, H. Besir, J. Ruehe, M. J. Saxton and C. A. Naumann, Biophys. J., 2005, 88, 1875–1886 CrossRef CAS.
- S. Ly, F. Bourguet, N. O. Fischer, E. Y. Lau, M. A. Coleman and T. A. Laurence, Biophys. J., 2014, 106, L05–L08 CrossRef CAS PubMed.
- M. Hölttä-Vuori, R. L. Uronen, J. Repakova, E. Salonen, I. Vattulainen, P. Panula, Z. Li, R. Bittman and E. Ikonen, Traffic, 2008, 9, 1839–1849 CrossRef PubMed.
- K. Hofmann, C. Thiele, H.-F. Schött, A. Gaebler, M. Schoene, Y. Kiver, S. Friedrichs, D. Lütjohann and L. Kuerschner, J. Lipid Res., 2014, 55, 583–591 CrossRef CAS PubMed.
- E. Saxon and C. R. Bertozzi, Science, 2000, 287, 2007–2010 CrossRef CAS PubMed.
- E. M. Sletten and C. R. Bertozzi, Angew. Chem., Int. Ed., 2009, 48, 6974–6998 CrossRef CAS PubMed.
- C. Besanceney-Webler, H. Jiang, T. Zheng, L. Feng, D. Soriano del Amo, W. Wang, L. M. Klivansky, F. L. Marlow, Y. Liu and P. Wu, Angew. Chem., Int. Ed. Engl., 2011, 50, 8051–8056 CrossRef CAS PubMed.
- H. Robson Marsden and A. Kros, Angew. Chem., Int. Ed. Engl., 2010, 49, 2988–3005 CrossRef CAS PubMed.
- B. D. N. Woolfson, Adv. Protein Chem., 2005, 70, 79–112 CrossRef PubMed.
- G. O. Gey, W. D. Coffman and M. T. Kubicek, Cancer Res., 1952, 12, 264–265 Search PubMed.
- J. Ponten and E. Saksela, Int. J. Cancer, 1967, 2, 434–447 CrossRef CAS PubMed.
- U. Schneider, H. U. Schwenk and G. Bornkamm, Int. J. Cancer, 1977, 19, 621–626 CrossRef CAS PubMed.
- S. Shimizu, T. Takiguchi, M. Fukutoku, R. Yoshioka, Y. Hirose, S. Fukuhara, H. Ohno, Y. Isobe and S. Konda, Leukemia, 1993, 7, 274–280 CAS.
- J. Karttunen and N. Shastri, Proc. Natl. Acad. Sci. U. S. A., 1991, 88, 3972–3976 CrossRef CAS.
- V. P. Torchilin, R. Rammohan, V. Weissig and T. S. Levchenko, Proc. Natl. Acad. Sci. U. S. A., 2001, 98, 8786–8791 CrossRef CAS PubMed.
- M. Tsubaki, Biochemistry, 1993, 32, 174–182 CrossRef CAS PubMed.
- J. Harvey, S. C. Hardy and M. L. Ashford, Br. J. Pharmacol., 1999, 126, 51–60 CrossRef CAS PubMed.
- E. C. T. Yeung, C. Stasolla, M. J. Sumner and B. Q. Huang, in Plant Microtechniques and Protocols, Springer International Publishing, 2015, pp. 22–43 Search PubMed.
- H. M. Shapiro, Practical Flow Cytometry, John Wiley & Sons, New Jersey, 4th edn, 2003 Search PubMed.
- J. Iqbal, K. Anwar and M. M. Hussain, J. Biol. Chem., 2003, 278, 31610–31620 CrossRef CAS PubMed.
- M. K. Herroon, E. Rajagurubandara, D. L. Rudy, A. Chalasani, A. L. Hardaway and I. Podgorski, Oncogene, 2013, 32, 1580–1593 CrossRef CAS PubMed.
- H. R. Zope, F. Versluis, A. Ordas, J. Voskuhl, H. P. Spaink and A. Kros, Angew. Chem., Int. Ed. Engl., 2013, 52, 14247–14251 CrossRef CAS PubMed.
- F. Versluis, J. Voskuhl, B. Van Kolck, H. Zope, M. Bremmer, T. Albregtse and A. Kros, J. Am. Chem. Soc., 2013, 135, 8057–8062 CrossRef CAS PubMed.
- L. Kong, S. H. C. Askes, S. Bonnet, A. Kros and F. Campbell, Angew. Chem., Int. Ed., 2015, 1396–1400 Search PubMed.
- N. Lopez Mora, A. Bahreman, H. Valkenier, H. Li, T. Sharp, D. N. Sheppard, A. kros and A. Davis, Chem. Sci., 2016, 7, 1768–1772 RSC.
- J. Yang, A. Bahreman, G. Daudey, J. Bussmann, R. C. L. Olsthoorn and A. Kros, ACS Cent. Sci., 2016, 2, 621–630 CrossRef CAS PubMed.
- J. Yang, Y. Shimada, R. C. L. Olsthoorn, B. E. Snaar-Jagalska, H. P. Spaink and A. Kros, ACS Nano, 2016, 10, 7428–7435 CrossRef CAS PubMed.
- G. Charron, Acc. Chem. Res., 2011, 44, 699–708 CrossRef PubMed.
- X. Zhang and Y. Zhang, Molecules, 2013, 18, 7145–7159 CrossRef CAS PubMed.
- D. M. Patterson, L. A. Nazarova and J. A. Prescher, ACS Chem. Biol., 2014, 9, 592–605 CrossRef CAS PubMed.
- V. Hong, N. F. Steinmetz, M. Manchester and M. G. Finn, Bioconjugate Chem., 2010, 21, 1912–1916 CrossRef CAS PubMed.
- C. Uttamapinant, A. Tangpeerachaikul, S. Grecian, S. Clarke, U. Singh, P. Slade, K. R. Gee and A. Y. Ting, Angew. Chem., Int. Ed., 2012, 51, 5852–5856 CrossRef CAS PubMed.
- D. Soriano Del Amo, W. Wang, H. Jiang, C. Besanceney, A. C. Yan, M. Levy, Y. Liu, F. L. Marlow and P. Wu, J. Am. Chem. Soc., 2010, 132, 16893–16899 CrossRef CAS PubMed.
- C. Uttamapinant, M. I. Sanchez, D. S. Liu, J. Z. Yao and A. Y. Ting, Nat. Protoc., 2013, 8, 1620–1634 CrossRef PubMed.
- L. A. Herzenberg, Nat. Immunol., 2006, 7, 681–685 CrossRef CAS PubMed.
- G. C. Salzman, S. B. Singham, R. G. Johnston and C. F. Bohren, in Flow Cytometry and Sorting, ed. M. R. Melamed, T. Lindmo and M. L. Mendelsohn, Wiley-Liss, New York, 1990, pp. 81–107 Search PubMed.
- N. M. Varki and A. Varki, Lab. Invest., 2007, 87, 851–857 CrossRef CAS PubMed.
- S. T. Laughlin and C. R. Bertozzi, Nat. Protoc., 2007, 2, 2930–2944 CrossRef CAS PubMed.
- F. R. Maxfield and D. Wüstner, Methods Cell Biol., 2012, 108, 367–393 CAS.
- L. Yang, J. O. Nyalwidhe, S. Guo, R. R. Drake and O. J. Semmes, Mol. Cell. Proteomics, 2011, 10, M110.007294 Search PubMed.
- D. H. Dube and C. R. Bertozzi, Nat. Rev. Drug Discovery, 2005, 4, 477–488 CrossRef CAS PubMed.
- S. Iyer, R. M. Gaikwad, V. Subba-Rao, C. D. Woodworth and I. Sokolov, Nat. Nanotechnol., 2009, 4, 389–393 CrossRef CAS PubMed.
- H. Jiang, B. P. English, R. B. Hazan, P. Wu and B. Ovryn, Angew. Chem., Int. Ed., 2015, 54, 1765–1769 CrossRef CAS PubMed.
- B. D. Levy, C. B. Clish, B. Schmidt, K. Gronert and C. N. Serhan, Nat. Immunol., 2001, 2, 612–619 CrossRef CAS PubMed.
- M. Winkler, BJOG, 2003, 110, 118–123 CrossRef CAS PubMed.
- M. van der Stelt and V. Di Marzo, NeuroMol. Med., 2005, 7, 37–50 CrossRef CAS.
- F. A. Iannotti, V. Di Marzo and S. Petrosino, Prog. Lipid Res., 2016, 62, 107–128 CrossRef CAS PubMed.
- M. P. Baggelaar, F. J. Janssen, A. C. M. Vanesbroeck, H. Dendulk, M. Allara, S. Hoogendoorn, R. McGuire, B. I. Florea, N. Meeuwenoord, H. Vandenelst, G. A. Vandermarel, J. Brouwer, V. Dimarzo, H. S. Overkleeft and M. Vanderstelt, Angew. Chem., Int. Ed., 2013, 52, 12081–12085 CrossRef CAS PubMed.
Footnote |
| † Electronic supplementary information (ESI) available. See DOI: 10.1039/c7sc00260b |
| This journal is © The Royal Society of Chemistry 2017 |

