 Open Access Article
An efficient on-board metal-free nanocatalyst for controlled room temperature hydrogen production†
Saswati
Santra
*a,
Debanjan
Das
 a,
Nirmalya Sankar
Das
b and
Karuna Kar
Nanda
 *a
*a
aMaterials Research Centre, Indian Institute of Science, Bangalore-560012, India. E-mail: santra.saswati@gmail.com; nanda@mrc.iisc.ernet.in
bDepartment of Basic Science and Humanities, Techno India – Batanagar, Kolkata 700141, India
First published on 30th January 2017
Abstract
Positively charged functionalized carbon nanodots (CNDs) with a variety of different effective surface areas (ESAs) are synthesized via a cheap and time effective microwave method and applied for the generation of hydrogen via hydrolysis of sodium borohydride. To the best of our knowledge, this is the first report of metal-free controlled hydrogen generation. Our observation is that a positively charged functional group is essential for the hydrolysis for hydrogen production, but the overall activity is found to be enhanced with the ESA. A maximum value of 1066 ml g−1 min−1 as the turnover frequency is obtained which is moderate in comparison to other catalysts. However, the optimum activation energy is found to be 22.01 kJ mol−1 which is comparable to well-known high cost materials like Pt and Ru. All of the samples showed good reusability and 100% conversion even after the 10th cycle. The effect of H+ and OH− is also studied to control the on-board and on-demand hydrogen production (“on–off switching”). It is observed that H2 production decreases inversely with NaOH concentration and ceases completely when 10−1 M NaOH is added. With the addition of HCl, H2 production can be initiated again, which confirms the on/off control over production.
Introduction
Finding efficient and clean alternative energy sources is one of the prime concerns for modern research due to the depletion of fossil-fuel reserves and increase in environmental pollution. In this regard, hydrogen is a potential alternative to traditional fuels like, coal, oil, natural gas, etc.1–3 It can perform more efficiently than gasoline in inner combustion systems and its better compression ratio is an advantage.4,5 Moreover, no pollutants like carbon monoxide, odor, or soot are produced during the combustion process. Hydrogen is also used as fuel in proton exchange membrane (PEM) fuel cells, and this kind of fuel cell offers zero/low emissions.6,7 Due to their high performance, these cells are proven to be substitutes for the internal-combustion engine in transport systems and residential power production.8–11 However, the prime source of hydrogen production is hydrocarbons and as a result carbon monoxide is also produced simultaneously as a by-product that affects the purity of the produced hydrogen, and hence, the performance of PEM fuel cells. Moreover, due to a very low volumetric energy density, storage of hydrogen requires highly pressurized cylinders resulting in disadvantages like heavy weight, space occupancy, safety concerns, etc. In order to use PEM fuel cells in transport systems, ‘on-board’ hydrogen production or light weight hydrogen storage methods are required and are of paramount importance. Some metal hydrides like LaNi5H6 have been studied as hydrogen storage materials. Nevertheless, they have lots of drawbacks such as having too low a gravimetric storage capacity (1–2 wt%), high cost, high temperature requirements for generating hydrogen, etc.12 Above all, the major concerns are easy control, safety, high production rate and storage capability of hydrogen. In this regard, sodium borohydride (NaBH4) has attracted much attention for its high hydrogen content of 10.8 wt%, environment-friendly nature and easy availability.13–15 Schlesinger et al. reported that one molecule of NaBH4 releases four hydrogen atoms and water soluble sodium metaborate (NaBO2).16 The chemical reaction follows the below chemical equation.| NaBH4 + 2H2O = 4H2 + NaBO2 + heat (300 kJ) |
In this hydrolysis reaction, a catalyst plays an important role in controlling the hydrogen evolution at a practical rate. Precious metals and their composites like, Pt, Ru,3,17,18 Pt–Ru,19 graphene–Pt–Ni20,21etc. as well as some low cost metals and compounds i.e. nickel boride,22,23 carbon supported Co,24,25 cobalt boride26,27etc. have been exploited as catalyst in the hydrolysis of NaBH4. A lot of studies have been carried out using different dimensional carbon materials.28–30 To the best of our knowledge, metal-free carbon nanostructures have not been exploited so far, though they are very stable, environment-friendly and cost-effective materials. In this paper, we have reported for the first time a metal-free catalyst for H2 evolution using quasi zero-dimensional (0D) carbon nanodots (CNDs) and have studied in detail the catalytic activities by varying the surface area and the surface functionalities. We synthesize CNDs with varieties of different effective surface areas (ESAs) and positively charged functional groups at the surface via microwave treatment of citric acid (CA) monohydrate and urea. Negatively charged functional groups due to the presence of carboxyl groups on the surface are present when CA is treated with microwaves. The negatively charged functional group is futile for H2 generation. However, the positively charged functional groups on CND surfaces, which are favorable for the hydrolysis, are realized when urea was added to CA. The CNDs are then applied for the generation of hydrogen via hydrolysis of sodium borohydride and our results indicate that positively charged functional groups are essential for the hydrolysis for hydrogen production, but the overall activity is found to be enhanced with the ESA. True activity, reusability and conversion of the as-synthesized CNDs have also been studied up to the 10th cycle. For “on–off” switching of the H2 production, pH dependent activity has also been examined and it was found that the activity has inverse relation with pH.
Experimental section
Synthesis
A simple, cheap, and time effective one-step, one-pot synthesis procedure was used to prepare the CNDs.31 1.4 × 10⁻² M CA monohydrate and 5 × 10⁻² M urea were mixed well via stirring for 10 min in 10 ml of deionized water to prepare a transparent solution at room temperature. This solution was kept in a domestic microwave oven and the reaction time varied from 2.5 to 4.5 min. As soon as the reaction was initiated, the solution started bubbling and the color changed from transparent to light orange to dark orange gradually. Finally a deep brown gel was obtained after natural cooling (Fig. S1†). Thereafter the samples were made soluble in deionized water and were purified in a centrifuge at 3200 rpm for 30 min to remove large or agglomerated particles. The final brown colored solutions were then collected for further analysis. Samples synthesized with a reaction time of 2.5, 3.5 and 4.5 min are labeled as sample A, B and C, respectively. The synthesis mechanism is discussed below (Scheme 1).Characterizations
The as-synthesized samples were characterized using an X-ray diffractometer (XRD) using Bruker D8 Advance and WITec Raman system for phase confirmation. Fourier transform infrared spectroscopy (FTIR, Bruker 600) and X-ray photoelectron spectroscopy (XPS, AXIS ULTRA DLD) were used to study the bonding information and elemental analysis. The morphology was characterized using a JEOL transmission electron microscope (TEM) at 200 keV. For microscopic investigation, the samples with very low concentrations were first ultrasonicated in pure ethanol for 3 min and then dropped on Cu grids covered with a continuous carbon film. Zeta potential was studied using zeta potential analyzer (Brookhaven). A typical three-electrode cell attached to a CHI750E workstation was used for the electrochemical measurements. A saturated calomel electrode (SCE) and Pt wire were used as the reference and counter electrode, respectively. A commercially available glassy carbon electrode (GCE, 3 mm diameter, 0.07 cm2) was used as the working electrode. In order to prepare the electrode, 2 mg of catalyst and 500 μl of ethanol were used to prepare the primary solution. Then 20 μl of 5 wt% Nafion© 117 solution was added to this as binder and the solution was sonicated for 30 min to obtain the final catalyst ink. 15 μl of ink was drop-casted onto the GCE followed by air-drying to obtain the catalyst loading of ∼0.75 mg cm−2. 1 M KOH solution (pH = 14, purged with N2 gas for 30 min at room temperature) was used as electrochemical solvent.Hydrogen generation via hydrolysis of NaBH4
The water displacement method was used to determine the catalytic activities of the as-synthesized CNDs for the hydrolysis of NaBH4. A thermostatic bath was used to maintain the temperature of the reaction flask. Another flask filled up with water was connected to the reaction flask to measure the volume of H2 gas produced by the hydrolysis. The reaction flask was also equipped with a burette to control the water flow and volume used for hydrolysis. Before the reaction started a certain amount of NaBH4 (2 g) and catalyst (0.05 g) was measured precisely and added together into the reaction flask which was air tight. Then 50 ml of water was added from the burette while the stirring was on. After all of the water was added (30 s), the measurement of H2 evolution with respect to time was started via water displacement.Results and discussion
CNDs can be obtained from CA via H-bonding assisted self-assembly followed by pyrolysis during microwave treatment (Scheme 1). CNDs with negatively charged carboxyl (![[double bond splayed left]](https://www.rsc.org/images/entities/char_e009.gif) COO−,
COO−, ![[double bond splayed left]](https://www.rsc.org/images/entities/char_e009.gif) C
C![[double bond, length as m-dash]](https://www.rsc.org/images/entities/char_e001.gif) O) functional groups are obtained when only CA is microwave-treated. However, CNDs with positively charged (NH4+) functional groups are obtained when urea was added along with CA and treated with microwaves.32 Grafting the CNDs with positive functional groups is crucial since it facilitates the borohydride ion (BH4−) onto the surface of the CNDs for hydrogen generation, which is futile in the presence of negatively charged CNDs. Urea undergoes hydrolysis with the release of CO2 as follows:
O) functional groups are obtained when only CA is microwave-treated. However, CNDs with positively charged (NH4+) functional groups are obtained when urea was added along with CA and treated with microwaves.32 Grafting the CNDs with positive functional groups is crucial since it facilitates the borohydride ion (BH4−) onto the surface of the CNDs for hydrogen generation, which is futile in the presence of negatively charged CNDs. Urea undergoes hydrolysis with the release of CO2 as follows:| NH2–CO–NH2 + 2H+ + H2O → 2NH4+ + CO2 |
The NH4+ ion so formed is then drawn to the surface of the CNDs due to electrostatic attraction from the –COO− groups already present on the CNDs’ surface.
Fig. 1a shows the XRD patterns of the as-synthesized CNDs. As shown in the figure, a broad peak near 26.3° was found for all of the CNDs which corresponds the (002) plane of graphitic carbon.33 Raman spectra of the as-prepared CNDs are shown in Fig. 1b. The peak around 1360 cm−1 (D band) corresponds to the vibrations of carbon atoms with dangling bonds at the edge of the plane of disordered graphite or glassy carbon. The G band at 1576 cm−1 is associated with the E2g mode of the graphite which is related to the vibration of sp2-bonded carbon atoms in a hexagonal lattice.34
FTIR was used to detect the surface functional groups of the CNDs (Fig. 1c). Broad absorption bands at 3100–3500 cm−1 are assigned to ν(O–H) and N–H, 2800–3100 cm−1 is for the stretching mode of C–H, 2350 cm−1 is labeled as O–C–O and 1600–1770 cm−1, 1350–1460 cm−1 and 1190 cm−1 are for ν(C![[double bond, length as m-dash]](https://www.rsc.org/images/entities/char_e001.gif) O), δ(CH2) and the stretching mode of C–O respectively.31,35–37
O), δ(CH2) and the stretching mode of C–O respectively.31,35–37
The composition and elemental analysis of the as-synthesized CNDs were characterized using XPS. The XPS spectrum of sample B (Fig. 2a) depicts three peaks at 284.6, 400.0, and 530.5 eV, which confirms the presence of C, N, and O, respectively. In the high resolution spectrum of C1s (Fig. 2b), the peaks at 284.6, 285.8, 287.7 and 288.4 eV are assigned to be C–C/C![[double bond, length as m-dash]](https://www.rsc.org/images/entities/char_e001.gif) C/C–H, C–O, C
C/C–H, C–O, C![[double bond, length as m-dash]](https://www.rsc.org/images/entities/char_e001.gif) O and O–C
O and O–C![[double bond, length as m-dash]](https://www.rsc.org/images/entities/char_e001.gif) O, respectively.38–41 The O1s spectrum (Fig. 2c) shows peaks at 531.0 and 532.1 eV which are associated with C
O, respectively.38–41 The O1s spectrum (Fig. 2c) shows peaks at 531.0 and 532.1 eV which are associated with C![[double bond, length as m-dash]](https://www.rsc.org/images/entities/char_e001.gif) O and C–OH/C–O–C, respectively.39,40 A broad peak from 403 to 409 eV related to N1s are shown in Fig. 2d. The de-convoluted peaks at 399.4 and 400.9 eV are assigned to –NH– and N–Ox respectively.41–45 No C–N peak was found in the XPS data which confirms that nitrogen is only attached to the surface of the CNDs. The percentage amount of nitrogen was found to be 9.89, 15.19 and 12.61 for A, B and C, respectively.
O and C–OH/C–O–C, respectively.39,40 A broad peak from 403 to 409 eV related to N1s are shown in Fig. 2d. The de-convoluted peaks at 399.4 and 400.9 eV are assigned to –NH– and N–Ox respectively.41–45 No C–N peak was found in the XPS data which confirms that nitrogen is only attached to the surface of the CNDs. The percentage amount of nitrogen was found to be 9.89, 15.19 and 12.61 for A, B and C, respectively.
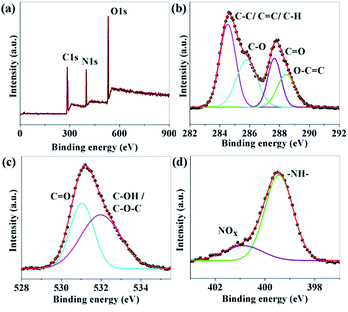 | ||
| Fig. 2 (a) XPS survey scan; and (b–d) XPS high resolution survey scan of the C1s, O1s and N1s regions of sample B respectively. | ||
Fig. 3a–c show the TEM images of the CNDs which reveal the average diameters as ∼2.5, ∼3.5 and ∼15.6 nm for samples A, B and C, respectively. The high resolution TEM (HRTEM) images (Fig. 3d–f) reveal the crystalline nature with in-plane lattice spacing of 0.24 and 0.33 nm, corresponding to the (1120) and (002) planes, respectively, which also confirms the proper phase formation of graphitic carbon.46 The insets show selected area electron diffraction (SAED) patterns that also endorse the nanocrystalline nature of the same. The cumulative volumes of hydrogen generation at room temperature over time for the hydrolysis reaction of NaBH4 using various catalysts and without catalysts are presented in Fig. 4a. For all of the cases, H2 generation started as soon as water was added with NaBH4 and all of the CNDs showed higher H2 evolution rates as compared to the non-catalytic reaction. To quantify the catalytic activity, the turnover frequency (TOF) was estimated using the following equation for all of the CNDs.
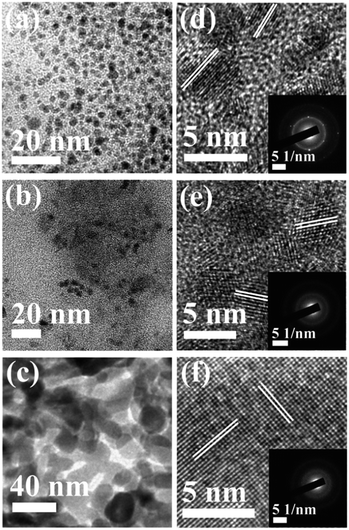 | ||
| Fig. 3 (a–c) TEM images; and (d–f) lattice images of samples A, B and C, respectively. Insets show the corresponding SAED patterns. | ||
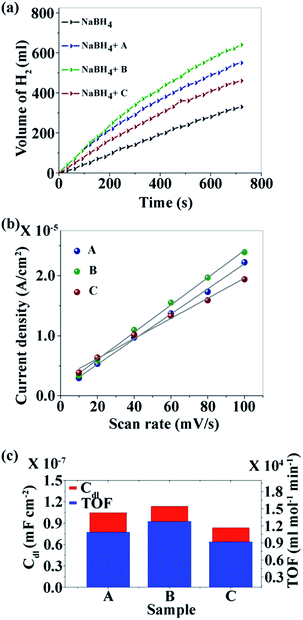 | ||
| Fig. 4 (a) Kinetics study; (b) linear fit of the differences in current density variation at a potential of 0.16 V vs. scan rate for the estimation of Cdl; and (c) relationship between Cdl and TOF. | ||
It was found that sample B showed the highest hydrolysis activity with respect to all of the other samples. The TOFs of different metal catalysts are compared with sample B (the best sample in our case) in Table 1. It can be noted that metal-free CNDs can compete with other metallic catalysts.
XPS analysis reveals the presence of electron withdrawing –NH– species on the surface of CNDs in the order of B > C > A and the zeta potential was recorded for each sample in operando, and was found to be 12.92, 23.10 and 15.15 mV respectively for sample A, B and C. Thus it is expected that the rate of hydrolysis of BH4− would follow the same order by virtue of the electrostatic interactions.
However, the observed hydrolysis trend follows the order of B > A > C. To explain this apparent anomaly the effective surface area (ESA) of the catalysts, a crucial factor that can influence the catalytic activity, was taken into account. The double-layer capacitance (Cdl) which is linearly proportional to ESA, is determined from the cyclic voltammogram (CV).51 CV studies were carried out at various scan rates (10, 20, 40, 60, 80 and 100 mV s−1) in the voltage range of −0.25 to 0.05 V (Fig. S5a–c†). The differences in current density (ΔJ = Ja − Jc) at a potential of 0.16 V with respect to the scan rate are plotted and fitted with linear relation (Fig. 4b). The value of Cdl is half of the slope and it is found that CdlB > CdlA > CdlC which is directly related to the ESA of the samples. The TOF and ESA are compared in Fig. 4c. It can be noted that the catalytic activity of the CNDs follows the same trend as the ESA.
To investigate the reusability of the as-synthesized CNDs as catalyst, hydrolysis experiments were consecutively carried out for 10 times in the same reaction media by just adding the same amount of NaBH4 for each cycle. The conversion was 100% but the catalytic activity degraded for each cycle. The drop in the catalytic activity of the CNDs may be due to by-product formation during hydrolysis. However the CNDs showed good reusability and after the 10th cycle the activities of samples A, B and C are found to be ∼57%, ∼60% and ∼52% respectively. The recorded data are depicted in Fig. 5a–c.
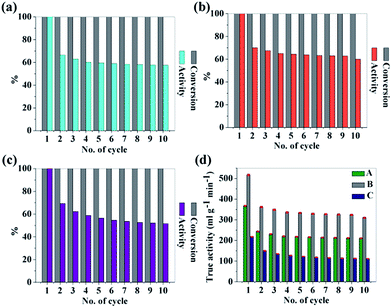 | ||
| Fig. 5 (a–c) Reuse of sample A, B and C to study the conversion and activity as catalyst in H2 production via the hydrolysis of NaBH4; (d) true activity values for each sample up to 10 cycles. | ||
Self-hydrolysis occurs when water is added to NaBH4. So to figure out the actual effectiveness of the CNDs as efficient catalysts, true activity values are significant to figure out. For this, self-hydrolysis of NaBH4 was studied for 10 cycles and it remained almost the same for all of the cycles (550 ml g−1 min−1). With this data, true activities for all of the samples are also calculated using the following equation52 and are depicted in Fig. 5d.
| True activity = activity over catalyst − activity without catalyst |
Self-hydrolysis of NaBH4 follows the mechanism stated below:53
Step 1:
| NaBH4(s) ↔ Na(aq)+ + BH4(aq)− |
Step 2:
| BH4(aq)− + H(aq)+ ↔ BH3(aq) + H2(g) |
Step 3:
| BH3(aq) + 3H2O(l) → B(OH)3(aq) + 3H2(g) |
Step 4:
| B(OH)3(aq) + H2O(l) ↔ B(OH)4(aq)− + H(aq)+ |
Step 5:
| 4B(OH)4(aq)− + 2H(aq)+ ↔ B4O7(aq)2− + 9H2O(l) |
Control of the “on–off” conditions for H2 production is crucial for portable applications. It can be noted from step 2 that the production of protons controls the total process. If the proton production can be controlled, the H2 production rate can easily be controlled. Basic media is a very well-known source OH− which can control H+ production. To study the effect of basic solution on the hydrolysis of NaBH4, NaOH solutions of different concentrations (10−1 M, 10−3 M, 10−5 M and 10−7 M) were used and the catalytic activity was examined. As expected, H2 production decreased gradually with the increase of NaOH concentration (Fig. 6a). The TOFs for different concentrations of NaOH are compared in Fig. 6b. The volume of H2 production in 720 s is 640 ml with only water while H2 production ceased completely for a 10−1 M NaOH concentration (no associated figure). Additionally, herein for the first time, we demonstrated that the H2 production via NaBH4 hydrolysis can be reversibly turned “off” and “on”, which can be of great practical importance for on-site and on-demand hydrogen usage. The “on–off” control of hydrogen production (Fig. 6c) is achieved via addition of an equimolar amount of HCl and NaOH. Here HCl is used as a source of H+ which plays a positive role in the hydrolysis of NaBH4. It is observed that in the presence of 10−1 M NaOH, H2 generation ceases completely and can be initiated by adding the same molarity of HCl. However, it is observed that with each “on–off” cycle there is a gradual decrease in the hydrogen production. This can be explained by the “common ion effect” of NaCl produced during the neutralization reaction of NaOH with the externally added HCl. The following process happens in aqueous medium.
| NaCl ↔ Na+ + Cl− | (i) |
| NaBH4 ↔ Na+ + BH4− | (ii) |
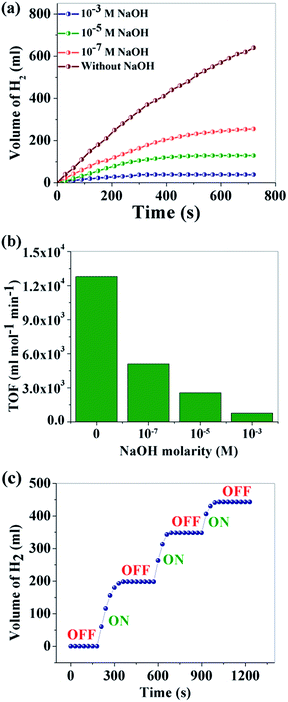 | ||
| Fig. 6 (a) Effect of NaOH concentration on H2 generation; (b) TOF at different concentrations of NaOH; (c) “on–off” control of H2 production. | ||
With the successive addition of HCl, the concentration of NaCl increases in the reaction system which prevents further NaBH4 hydrolysis, according to Le Chatelier's principle.
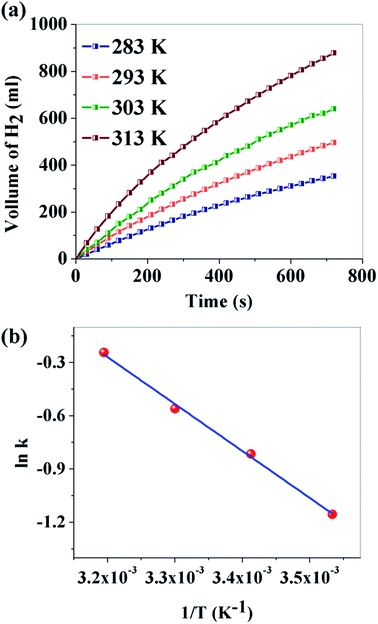
The effect of temperature on the hydrogen generation rate was further explored for sample B through the variation of temperature in the range of 283–313 K. Fig. 7a depicts the volume of H2 production versus time. It is observed that the reaction temperature had a remarkable effect on the volume of H2 generated. For a reaction temperature of 283 K, 353 ml of H2 is produced, while 878 ml is produced at 313 K. Activation energy is an important parameter to study the kinetics of H2 production. It can be calculated from the following Arrhenius equation:54
ln![[thin space (1/6-em)]](https://www.rsc.org/images/entities/char_2009.gif) k = ln k = ln![[thin space (1/6-em)]](https://www.rsc.org/images/entities/char_2009.gif) A − (Ea/RT) A − (Ea/RT) |
![[thin space (1/6-em)]](https://www.rsc.org/images/entities/char_2009.gif) k versus 1/T is plotted and Ea is found to be 22.01 kJ mol−1 for sample B. It may be noted here that Ea for our metal free CNDs is much lower than the popular costly metals during hydrolysis and even significantly comparable with some metal free catalysts, used in methanolysis of NaBH4 (Table 2).
k versus 1/T is plotted and Ea is found to be 22.01 kJ mol−1 for sample B. It may be noted here that Ea for our metal free CNDs is much lower than the popular costly metals during hydrolysis and even significantly comparable with some metal free catalysts, used in methanolysis of NaBH4 (Table 2).
| Material | Type of reaction | Activation energy (kJ mol−1) | Reference |
|---|---|---|---|
| Pt/CNT | Hydrolysis | 38 | 18 |
| Ru | Hydrolysis | 47 | 55 |
| Nickel boride | Hydrolysis | 38 | 56 |
| Ru nanocluster | Hydrolysis | 28.51 | 57 |
| Ni-nanogel | Hydrolysis | 50.96 | 58 |
| CuFe2O4/RGO | Hydrolysis | 33.95 | 59 |
| p(TAEA-co-GDE) microgels | Methanolysis | 30.37 | 60 |
| p(2-VP)2+C6 particles | Methanolysis | 20.84 | 61 |
| Phosphorus modified boehmite | Methanolysis | 21.6 | 62 |
| p(4-VP)2+C6 | Methanolysis | 13.78 | 63 |
| Poly(ethylene imine) microgel | Methanolysis | 23.7 | 64 |
| CND | Hydrolysis | 22.01 | This work |
Conclusion
We report for the first time, an efficient metal-free and cheap CND catalyst for controlled hydrolysis of NaBH4, that paves a way for on-board and on-demand H2 production. CNDs were synthesized with negatively and positively charged functional groups by treating CA and CA with urea, respectively, using a domestic microwave oven. Negatively charged functional groups are futile, while positively charged functional groups felicitate the hydrolysis reaction, and the activity is highly dependent on the surface area. Reusability, conversion and true activity studies confirm the as-synthesized CNDs as a potential candidate in the practical field of H2 production. The effect of temperature as well as the pH of the reaction medium were investigated. The activity was found to increase with temperature, and decrease with pH. Attractive and effective “on–off” control was observed just by varying the pH of the reaction medium. Interestingly, an activation energy of 22.01 kJ mol−1 is extracted from the temperature-dependent activity and the activation energy is much lower than that reported for other systems.Acknowledgements
The author (SS) wishes to thank Ms. Shubhanwita Saha (Jadavpur University, Kolkata) and Dr. Sayantani Chall (Indian Institute of Chemical Biology, Kolkata) for many insightful discussions and acknowledges the financial support from University Grants Commission (UGC), the Government of India, through Dr. D. S. Kothari Postdoctoral Fellowship.References
- Z. Pu, I. S. Amiinu, X. Liu, M. Wang and S. Mu, Nanoscale, 2016, 8, 17256 RSC.
- S. R. Soltau, P. D. Dahlberg, J. Niklas, O. G. Poluektov, K. L. Mulfort and L. M. Utschig, Chem. Sci., 2016, 7, 7068 RSC.
- D. Basu, S. Mazumder, J. Niklas, H. Baydoun, D. Wanniarachchi, X. Shi, R. J. Staples, O. Poluektov, H. B. Schlegel and C. N. Verani, Chem. Sci., 2016, 7, 3264 RSC.
- S. C. Amendola, S. L. Sharp-Goldman, M. S. Janjua, N. C. Spencer, M. T. Kelly, P. J. Petillo and M. Binder, Int. J. Hydrogen Energy, 2000, 25, 969 CrossRef CAS.
- M. Granovskii, I. Dincer and M. A. Rosen, Int. J. Hydrogen Energy, 2006, 31, 337 CrossRef CAS.
- Z. Liu, B. Guoa, S. H. Chan, E. H. Tang and L. Hong, J. Power Sources, 2008, 176, 306 CrossRef CAS.
- N. Jia, M. C. Lefebvre, J. Halfyard, Z. Qi and P. G. Pickup, Electrochem. Solid-State Lett., 2000, 3, 529 CrossRef CAS.
- P. Krishnan, T. H. Yang, W. Y. Lee and C. S. Kim, J. Power Sources, 2005, 143, 17 CrossRef CAS.
- P. Costamagna and S. Srinivasan, J. Power Sources, 2001, 102, 253 CrossRef CAS.
- M. T. Gencoglu and Z. Ural, Int. J. Hydrogen Energy, 2009, 34, 5242 CrossRef CAS.
- B. Najafi, A. H. Mamaghani, A. Baricci, F. Rinaldi and A. Casalegno, Int. J. Hydrogen Energy, 2015, 40, 1569 CrossRef CAS.
- P. Krishnan, K. L. Hsueh and S. D. Yim, Appl. Catal., B, 2007, 77, 206 CrossRef CAS.
- Ö. Metin and S. Özkar, Energy Fuels, 2009, 23, 3517 CrossRef.
- R. Retnamma, A. Q. Novais and C. M. Rangel, Int. J. Hydrogen Energy, 2011, 36, 9772 CrossRef CAS.
- S. Saha, V. Basak, A. Dasgupta, S. Ganguly, D. Banerjee and K. Kargupta, Int. J. Hydrogen Energy, 2014, 39, 1156 CrossRef.
- H. I. Schlesinger, H. C. Brown, A. E. Finholt, J. R. Gilbreath, H. R. Hoekstra and E. K. Hyde, J. Am. Chem. Soc., 1953, 75, 215 CrossRef CAS.
- P. Y. Olu, C. R. Barros, N. Job and M. Chatenet, Electrocatalysis, 2014, 5, 288 CrossRef CAS.
- W. Chen, J. Ji, X. Feng, X. Duan, G. Qian, P. Li, X. Zhou, D. Chen and W. Yuan, J. Am. Chem. Soc., 2014, 136, 16736 CrossRef CAS PubMed.
- U. B. Demirci and F. Garin, J. Alloys Compd., 2008, 463, 107 CrossRef CAS.
- Y. Du, J. Su, W. Luo and G. Cheng, ACS Appl. Mater. Interfaces, 2015, 7, 1031 CAS.
- Z. Zhang, Z. H. Lu and X. Chen, ACS Sustainable Chem. Eng., 2015, 3, 1255 CrossRef CAS.
- J. C. Ingersoll, N. Mania, J. C. Thenmozhiyal and A. Muthaiah, J. Power Sources, 2007, 173, 450 CrossRef CAS.
- Z. Wu, X. Mao, Q. Zi, R. Zhang, T. Dou and A. C. K. Yip, J. Power Sources, 2014, 268, 596 CrossRef CAS.
- L. Yang, K. Wang, G. Du, W. Zhu, L. Cui, C. Zhang, X. Sun and A. M. Asiri, Nanotechnology, 2016, 27, 475702 CrossRef PubMed.
- J. Zhu, R. Li, W. Niu, Y. Wu and X. Gou, Int. J. Hydrogen Energy, 2013, 38, 10864 CrossRef CAS.
- M. Paladini, V. Godinho, G. M. Arzac, M. C. J. Haro, A. M. Beltŕan and A. Ferńandez, RSC Adv., 2016, 6, 108611 RSC.
- O. V. Netskina, A. M. Ozerova, O. V. Komova, D. I. Kochubey, V. V. Kanazhevskiy, A. V. Ishchenko and V. I. Simagina, Top. Catal., 2016, 59, 1431 CrossRef CAS.
- M. Zahmakıran and S. Özkar, Nanoscale, 2011, 3, 3462 RSC.
- Y. Li, X. Zhang, Q. Zhang, J. B. Zheng, N. Zhang, B. H. Chena and K. J. Smith, RSC Adv., 2016, 6, 29371 RSC.
- A. Chinnappan, R. Appiah-Ntiamoah, W. J. Chung and H. Kim, Int. J. Hydrogen Energy, 2016, 41, 14491 CrossRef CAS.
- S. Qu, X. Wang, Q. Lu, X. Liu and L. Wang, Angew. Chem., Int. Ed., 2012, 51, 12215 CrossRef CAS PubMed.
- P. M. Schaber, J. Colson, S. Higgins, D. Thielen, B. Anspach and J. Brauer, Thermochim. Acta, 2014, 424, 131 CrossRef.
- H. K. Sadhanala, J. Khatei and K. K. Nanda, RSC Adv., 2014, 4, 11481 RSC.
- R. Purbia and S. Paria, Biosens. Bioelectron., 2016, 79, 467 CrossRef CAS PubMed.
- D. B. Mawhinney and J. T. Yates Jr, Carbon, 2001, 39, 1167 CrossRef CAS.
- D. B. Clarke, D. K. Lee, M. J. Sandoval and A. T. Bell, J. Catal., 1994, 150, 81 CrossRef CAS.
- J. Bak and S. Clausen, Meas. Sci. Technol., 2002, 13, 150 CrossRef CAS.
- Y. Li, Y. Zhao, H. Cheng, Y. Hu, G. Shi, L. Dai and L. Qu, J. Am. Chem. Soc., 2012, 134, 15 CrossRef CAS PubMed.
- R. Zhang and W. Chen, Biosens. Bioelectron., 2014, 55, 83 CrossRef CAS PubMed.
- Z. Yang, M. Xu, Y. Liu, F. He, F. Gao, Y. Su, H. Wei and Y. Zhang, Nanoscale, 2014, 6, 1890 RSC.
- S. Liu, J. Tian, L. Wang, Y. Zhang, X. Qin, Y. Luo, A. M. Asiri, A. O. Al-Youbi and X. Sun, Adv. Mater., 2012, 24, 2037 CrossRef CAS PubMed.
- X. Xiang, E. Liu, Z. Huang, H. Shen, Y. Tian, C. Xiao, J. Yang and Z. Mao, J. Solid State Electrochem., 2011, 15, 2667 CrossRef CAS.
- S. J. Kang, T. Mori, S. Narizuka, W. Wilcke and H. C. Kim, Nat. Commun., 2014, 5, 3937 CAS.
- F. Lux, E. J. Samuelsen and E. T. Kang, Synth. Met., 1995, 69, 167 CrossRef CAS.
- L. Shi, Y. Wang, Z. Chu, Y. Yin, D. Jiang, J. Luo, S. Ding and W. Jin, J. Mater. Chem. B, 2017, 5, 1073 RSC.
- D. B. Shinde and V. K. Pillai, Chem.–Eur. J., 2012, 18, 12522 CrossRef CAS PubMed.
- N. Sahiner and F. Seven, Fuel Process. Technol., 2015, 132, 1 CrossRef CAS.
- N. Sahiner, T. Turhan and L. A. Lyon, Energy, 2014, 66, 256 CrossRef CAS.
- J. Zhao, H. Ma and J. Chen, Int. J. Hydrogen Energy, 2007, 32, 4711 CrossRef CAS.
- Y. Chen, Y. Shi and Y. Wang, Int. J. Energy Res., 2015, 39, 634 CrossRef CAS.
- H. Jin, J. Wang, D. Su, Z. Wei, Z. Pang and Y. Wang, J. Am. Chem. Soc., 2015, 137, 2688 CrossRef CAS PubMed.
- N. Sahiner and A. O. Yasar, Ind. Eng. Chem. Res., 2016, 55, 11245 CrossRef CAS.
- P. Barack, S. E. Dann and K. G. U. Wijayantha, Energy Sci. Eng., 2015, 3, 174 CrossRef.
- A. Chinnappan, W. J. Chung and H. Kim, J. Mater. Chem. A, 2015, 3, 22960 CAS.
- S. C. Amendola, S. L. Sharp-Goldman, M. S. Janjua, M. T. Kelly, P. J. Petillo and M. Binder, J. Power Sources, 2000, 85, 186 CrossRef CAS.
- D. Hua, Y. Hanxi, A. Xinping and C. Chuansin, Int. J. Hydrogen Energy, 2003, 28, 1095 CrossRef.
- S. Özkar and M. Zahmakıran, J. Alloys Compd., 2005, 404–406, 728 CrossRef.
- H. Cai, L. Liu, Q. Chen, P. Lu and J. Dong, Energy, 2016, 99, 129 CrossRef CAS.
- M. Tang, F. Xia, C. Gao and H. Qiu, Int. J. Hydrogen Energy, 2016, 41, 13058 CrossRef CAS.
- N. Sahiner and S. B. Sengel, J. Power Sources, 2016, 336, 27 CrossRef CAS.
- N. Sahiner, A. O. Yasar and N. Aktas, Renewable Energy, 2017, 101, 1005 CrossRef CAS.
- D. Xu, Y. Zhang, F. Cheng and L. Zhao, Fuel, 2014, 134, 257 CrossRef CAS.
- N. Sahiner, A. O. Yasar and N. Aktas, Int. J. Hydrogen Energy, 2016, 41, 20562 CrossRef CAS.
- N. Sahiner and S. Demirci, Int. J. Energy Res., 2016 DOI:10.1002/er.3679.
Footnote |
| † Electronic supplementary information (ESI) available. See DOI: 10.1039/c7sc00162b |
| This journal is © The Royal Society of Chemistry 2017 |


