 Open Access Article
Creative Commons Attribution 3.0 Unported Licence
Mo6+ activated multimetal oxygen-evolving catalysts†
Peng Fei
Liu
a,
Shuang
Yang
a,
Li Rong
Zheng
d,
Bo
Zhang
bc and
Hua Gui
Yang
 *a
*a
aKey Laboratory for Ultrafine Materials of Ministry of Education, School of Materials Science and Engineering, East China University of Science and Technology, Shanghai, 200237, China. E-mail: hgyang@ecust.edu.cn
bDepartment of Physics, East China University of Science and Technology, Shanghai, 200237, China
cDepartment of Electrical and Computer Engineering, University of Toronto, 35 St George Street, Toronto, Ontario M5S 1A4, Canada
dBeijing Synchrotron Radiation Facility, Institute of High Energy Physics, Chinese Academy of Sciences, Beijing, 100049, China
First published on 17th February 2017
Abstract
Water splitting is key to electrically-powered chemical fuel synthesis, but the slow kinetics of the oxygen evolution reaction (OER) hinder the wider promotion of such technology. Several first-row (3d) transition metal-based catalysts have been developed for the OER; however, these catalysts still require operating voltages that lie well above the fundamental thermodynamic potential. Here, we report high-valence metal molybdenum (Mo6+) modulated 3d metal (oxy)hydroxides. The obtained multimetal FeCoMo based OER catalysts require an overpotential of 277 mV to reach the current density of 10 mA cm−2 on the glassy carbon electrode, and there was no evidence of degradation for about 40 hours of stability testing. The catalysts stay in their amorphous phases, potentially with atomically homogenous metal distribution. The in situ X-ray adsorption analysis unambiguously reveals the tuned electronic structures of the 3d metals owing to Mo6+, further demonstrating the modification effect of a high-valence metal for designing highly-efficient OER catalysts.
Introduction
Oxygen electrochemistry plays a vital role in energy-related technologies, such as fuel cells, and water splitting and CO2 reduction electrolyzers.1–5 Unfortunately, the commercialization of these devices is strongly hampered by challenges in developing efficient and durable catalysts to motivate the sluggish oxygen evolution reaction (OER).3,6 Recently, 3d transition metal based oxides, including (oxy)hydroxides,7–10 perovskite oxides,11,12 cobalt phosphates3,13,14 and nickel borates,15 have been identified as high-activity OER catalysts. Known approaches like nanostructuring and alloying have been widely used to increase the surface area or improve the intrinsic activity of such materials, with nanostructured NiFe based oxides being the most explored and active catalysts.16–19 Nevertheless, new design strategies are still urgently needed to explore high-performance and cost-effective OER catalysts.Alloyed amorphous oxides have been suggested as active catalysts for the OER, owing to their unique structures with abundant defect active sites.20–22 Furthermore, the high-valence metal tungsten (W) has been subtly incorporated into alloyed oxides to form homogeneously dispersed multimetal catalysts.23 The electronic structures of 3d metals were systematically modulated by W6+ to reach an optimized adsorption energy for the OER intermediates. Following this design strategy, we anticipate other high-valence elements would also activate classical 3d metal alloyed oxide OER catalysts. Thus, we examined molybdenum (Mo) tuned multimetal OER catalysts, in which Mo is a versatile coordination host in its highest valence state.
Herein, we have synthesized amorphous Mo6+ hosted FeCo (oxy)hydroxides (FeCoMo), exhibiting extraordinary OER performance compared to those of binary FeCo (oxy)hydroxides (FeCo) and unary Co (oxy)hydroxides (CoCo). The FeCoMo catalyst produces a current density (j) of 10 mA cm−2 at an overpotential (η) of 277 mV, with a large bulk mass activity of 177.35 A g−1 at an η value of 300 mV, which is nearly 7 times higher than that of the benchmarking IrO2 electrocatalyst. At the same time, the ternary OER catalyst could maintain a current density of 10 mA cm−2 for about 40 hours (h) with no obvious degradation. In general, the high-valence Mo6+ activates the classical (oxy)hydroxide OER catalysts, with rich active sites for a successful OER process. We believe that high-valence element induced amorphous alloyed OER catalysts would provide prospective insights into designing highly effective water oxidation electrocatalysts.
Results and discussion
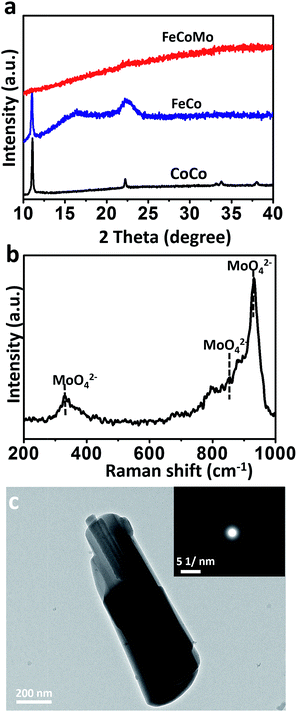
To synthesize the FeCoMo samples, cobalt chloride hexahydrate (CoCl2·6H2O) and iron chloride hexahydrate (FeCl3·6H2O) were continuously hydrolysed with the addition of ammonium molybdate tetrahydrate ((NH4)6Mo7O24·4H2O) and hexamethylene tetramine (HMT) at a temperature of 90 °C. Because pyrolyzed (NH4)6Mo7O24 and HMT slowly generate MoO42− and OH− simultaneously,24,25 small fragments like metal molybdates and hydroxides were irregularly precipitated,26 and then the amorphous phases with long range ordering were obtained. As shown in Fig. 1a, X-ray diffraction (XRD) patterns revealed that the ternary FeCoMo samples stayed in the amorphous phase, without any obvious diffraction peaks. For comparison, the binary FeCo and unary CoCo samples had a layered double hydroxide (LDH) composition. The digital images of these samples are shown in Fig. S1,† and all three samples exhibited different colors. The Raman spectrum (Fig. 1b) further demonstrated the existence of thermolysis derived MoO42− ions, with featured bands at 330 cm−1 (bending modes), 855 cm−1 (antisymmetric stretching mode) and 932 cm−1 (symmetric stretching modes).27To characterize the morphologies of the FeCoMo sample and the controlled samples, scanning electron microscopy (SEM) and transmission electron microscopy (TEM) were carried out. In Fig. S2,† the CoCo sample displayed a plate-like shape, while the other two samples exhibited no particular morphology. In order to identify the uniformity of the FeCoMo catalyst, energy dispersive spectroscopy (EDS) element mapping was conducted. In Fig. S3,† the elements Fe, Co and Mo were uniformly distributed on the FeCoMo sample. In addition, the low-magnification TEM images of the FeCoMo sample showed rod-like shapes (Fig. 1c and S4†). Furthermore, the selected area electron diffraction (SAED) analysis again confirmed the amorphous structure of the FeCoMo sample (the inset of Fig. 1c), without any crystalline phases, which was consistent with the XRD results.
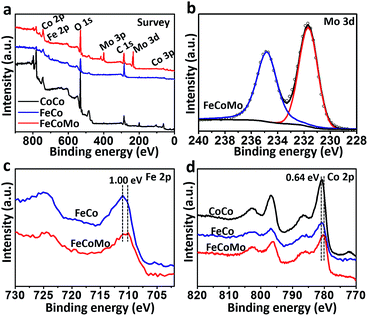
In order to compare the differences in the surface electronic structure for these three samples, X-ray photoelectron spectroscopy (XPS) was then carried out. In Fig. 2a, the survey XPS spectra proved that the Co element existed in all three samples, with additional Fe in FeCo and FeCoMo, and Mo in the FeCoMo sample. In the XPS spectrum of the Mo 3d region for FeCoMo (Fig. 2b), two apparent peaks at 231.7 and 234.8 eV can be observed, which were assigned to the Mo6+ species, indicating that the Mo element was in its highest valence state on the surface of the FeCoMo sample.28 In the XPS spectra of the Fe 2p region (Fig. 2c), the featured peaks of FeCoMo were shifted to a lower binding energy relative to the FeCo sample (∼1.0 eV), which suggested that the Fe element was in a relatively lower valence state in the FeCoMo sample, further demonstrating the strong electronic interactions between Fe and Mo. Meanwhile for the Co 2p region, the surface valence states of CoCo and FeCo behaved similarly to one another (Fig. 2d). For comparison, cobalt’s valence state in FeCoMo was slightly lower than in the other two samples.
To detect the bulk electronic structures, X-ray absorption near edge structure (XANES) spectra were collected, and the corresponding pre-edges are shown in Fig. S5.† The data showed that the three samples mainly consisted of Fe3+ in the bulk. A similar distribution was found for Co, and cobalt’s valence state exhibited negligible difference for the three samples. In particular, the bulk valence states of Co in the samples were lower than that of Co3O4.
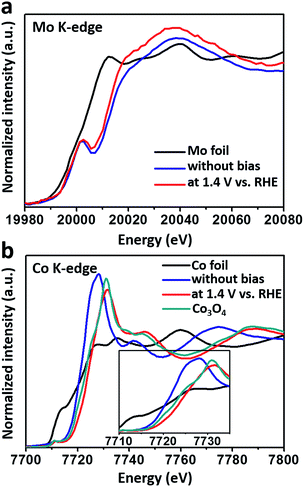
To monitor the bulk valence changes of the introduced versatile Mo6+ and 3d transition metals, in situ XANES tests were carried out, simultaneously testifying the modulation effect of high-valence metals in the real OER environment. In Fig. 3a, the XANES results of the Mo K-edge showed a continuous decrease in the energy of the absorption edge (∼1.4 eV) when a potential of 1.4 V (vs. RHE) was applied, indicating that the valence of Mo was decreased under the OER process. Meanwhile, the increased intensity of the white line suggested the decrease in the distorted octahedral environment around the Mo atom.29 In contrast, the valence of Co inversely increased under the water oxidation conditions (Fig. 3b), and was higher than that of Co3O4, nearly resembling that of active CoOOH.7 While for the Fe K-edge, iron’s valence in the FeCoMo sample nearly stayed the same as Fe3+ under the oxidation conditions (Fig. S6†). Notably, the decreased intensity of the white line for both Co and Fe evidenced the more distorted octahedral structure upon oxidation.30,31 Recent studies have proposed that high-valence Fe species, with unusually shorter Fe–O bonds and distorted octahedral structures, could probably be regarded as active sites for the OER, as evidenced using in situ analysis technologies.32–35 Although the high-valence Fe (Fe4+) has not been characterized in our experiments, we still think that the distorted FeO6 octahedra might contribute to the OER process. Overall, the Mo6+ species play an effective role in tuning the electronic structures of 3d metals. When applied under oxidation conditions, the external potential would stimulate the electrons of the 3d metals to transfer to Mo6+, which was in the highest oxidation state. Benefiting from the prominent ability of high-valence Mo6+ to draw electrons, the 3d metals would easily stay in their high-valence states, which are widely regarded as active sites for the OER.
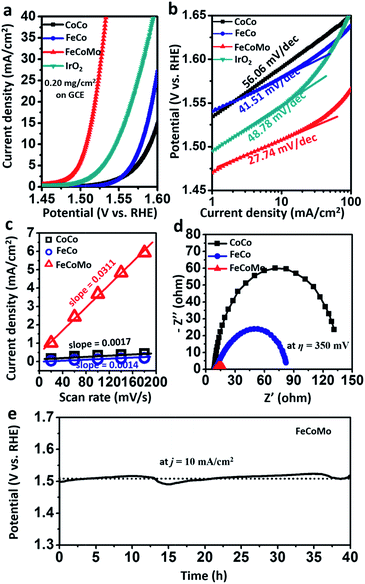
To evaluate the OER activities of amorphous multimetal FeCoMo catalysts, all of the electrocatalytic tests were conducted via a three-electrode system in an H-type cell with 1 M KOH electrolyte. In Fig. 4a and S7,† the FeCoMo catalyst required an η of 277 mV, 289 mV, and 336 mV to achieve a j of 10 mA cm−2, 20 mA cm−2 and 100 mA cm−2, respectively, which outperformed CoCo, FeCo and commercial IrO2 catalysts. The OER performances of the annealed samples were also evaluated, as shown in Fig. S8.† The amorphous FeCoMo catalyst exhibited better activity than the annealed one. To analyze the electrokinetics of the catalysts, Tafel plots were directly derived from the linear sweep voltammetry curves that were fit to the Tafel equation (η = b![[thin space (1/6-em)]](https://www.rsc.org/images/entities/char_2009.gif) log
log![[thin space (1/6-em)]](https://www.rsc.org/images/entities/char_2009.gif) j + a, where b is the Tafel slope). As shown in Fig. 4b, FeCoMo has a Tafel slope of 27.74 mV dec−1, which is much lower than those of CoCo (56.06 mV dec−1), FeCo (41.51 mV dec−1) and IrO2 (48.78 mV dec−1). Considering that the Tafel slope has been traditionally used to infer which of the four electron-/proton-transfer steps are rate limiting in the OER process, the Tafel slope of FeCoMo which is near 24 mV dec−1 indicates that the third electron transfer step is rate limiting.29 Furthermore, FeCoMo’s Tafel slope is very close to those observed for excellent Ni(Fe)OOH thin films (25–40 mV dec−1) in previous reports, implying that a similarly efficient OER mechanism exists. In general, the amorphous FeCoMo catalysts demonstrate excellent OER performances compared to benchmarking IrO2 and other controlled (oxy)hydroxides reported in the literature (Tables 1 and S1†).
j + a, where b is the Tafel slope). As shown in Fig. 4b, FeCoMo has a Tafel slope of 27.74 mV dec−1, which is much lower than those of CoCo (56.06 mV dec−1), FeCo (41.51 mV dec−1) and IrO2 (48.78 mV dec−1). Considering that the Tafel slope has been traditionally used to infer which of the four electron-/proton-transfer steps are rate limiting in the OER process, the Tafel slope of FeCoMo which is near 24 mV dec−1 indicates that the third electron transfer step is rate limiting.29 Furthermore, FeCoMo’s Tafel slope is very close to those observed for excellent Ni(Fe)OOH thin films (25–40 mV dec−1) in previous reports, implying that a similarly efficient OER mechanism exists. In general, the amorphous FeCoMo catalysts demonstrate excellent OER performances compared to benchmarking IrO2 and other controlled (oxy)hydroxides reported in the literature (Tables 1 and S1†).
| Catalystsa | η 10 (mV) | j 300 (mA cm−2) | Tafel slope (mV dec−1) | Bulk mass activityd (A g−1) | References |
|---|---|---|---|---|---|
| a All of the catalysts were deposited on the GCE to evaluate their OER performances. b η 10 is the overpotential to achieve a current density of 10 mA cm−2. c j 300 is the current density at an overpotential of 300 mV. d The bulk mass activity was calculated at an overpotential of 300 mV. | |||||
| FeCoMo | 277 | 35.5 | 27.74 | 177.35 | This work |
| CoCo | 361 | 0.9 | 56.06 | 4.40 | This work |
| FeCo | 349 | 0.5 | 41.51 | 2.30 | This work |
| IrO2 | 316 | 5.0 | 48.78 | 25.20 | This work |
| CoOOH | 300 | 10 | 38 | 66.6 | 7 |
| α Ni(OH)2 | 331 | ∼5 | ∼42 | ∼10 | 8 |
| NiFe nanosheets | 302 | ∼9.4 | 40 | ∼134.29 | 9 |
| NiV nanosheets | 318 | ∼5 | ∼50 | ∼34.97 | 10 |
| G-FeCoW | 223 | 246.8 | 37 | 1175 | 23 |
In order to compare the electrochemical surface areas (ECSAs) of the FeCoMo and controlled samples, the double-layer capacitances (Cdl) of the samples were estimated using a simple cyclic voltammetry (CV) method. As shown in Fig. S9† and 4c, the plots of Δj = (ja − jc) at 0.25 V (vs. Ag/AgCl/3.5 M KCl) against the scan rates were recorded. We can clearly find that the slope (equivalent to twice the value of Cdl) of FeCoMo (0.0311 F cm−2) is much larger than that of CoCo (0.0017 F cm−2) and that of FeCo (0.0014 F cm−2), suggesting that the FeCoMo catalyst had more exposed active sites for the OER. Next, we further investigated the intrinsic activity when the OER activity was normalized using Brunauer–Emmett–Teller (BET) surface areas, which is appropriate for these traditional (oxy)hydroxide catalysts with poor conductivity when they are not completely oxidized.36,37 In Fig. S10,† the intrinsic activity of the amorphous FeCoMo sample was notably higher than the controlled sample, with a large j (normalized using the BET surface areas) of 1.4 mA cm−2 at an η of 300 mV. It is worth mentioning that the BET surface area of the FeCoMo catalyst is only 10.5 m2 g−1, and its OER performance can be improved when the material is more nanostructured.
Electrical impedance spectroscopy (EIS) was carried out to evaluate the electric properties of the FeCoMo and controlled samples. In Fig. 4d, the FeCoMo catalyst showed the lowest transport resistance, indicating that it had superior charge transport kinetics.
To estimate the stability of the FeCoMo catalyst, we ran a chronopotentiometric test on the water oxidation of the catalyst with a constant j of 10 mA cm−2. In Fig. 4e, the potential of FeCoMo maintained around 1.5 V for about 40 h, without any appreciable deactivation, further demonstrating the operating stability of FeCoMo for large application. For comparison, the IrO2 benchmark catalyst exhibited poor stability (Fig. S11†). Moreover, we collected the FeCoMo sample after the stability tests and characterized it using SAED analysis, and the FeCoMo catalyst remained in the amorphous phase (Fig. S12†). To confirm whether the high-valence Mo6+ would be leached, inductively coupled plasma atomic emission spectroscopy (ICP-AES) measurements were conducted and almost no leaching phenomenon was observed (Table S2†). Furthermore, the EDS mapping images of FeCoMo after the stability tests also indicated that negligible Mo6+ species was leached (Fig. S13†).
Conclusions
In summary, Mo6+ activated amorphous multimetal oxygen-evolving catalysts have been successfully synthesized. The electronic structures of 3d transition metals in metal (oxy)hydroxides have been subtly modulated by high-valence metal Mo6+, to reach an optimized adsorption energy for the OER intermediates. The in situ XANES data have unambiguously identified that Mo6+ tends to draw in electrons to increase the valence of the 3d metals for promoting the OER. We believe that a high-valence metal incorporation strategy would pave a new way for rationally designing effective multimetal OER catalysts, holding promise for cheap, efficient and large scale alkaline water splitting in industry.Acknowledgements
This work was financially supported by the National Natural Science Foundation of China (21573068, 21503079), SRF for ROCS, SEM, SRFDP, Program of Shanghai Subject Chief Scientist (15XD1501300), Shanghai Municipal Natural Science Foundation (14ZR1410200), Fundamental Research Funds for the Central Universities (WD1313009) and 111 Project (B14018). The authors also thank the crew of the 1W1B beamline of Beijing Synchrotron Radiation Facility for constructive assistance in the XANES measurements and data analyses.Notes and references
- D. Guo, R. Shibuya, C. Akiba, S. Saji, T. Kondo and J. Nakamura, Science, 2016, 351, 361–365 CrossRef CAS PubMed.
- X. Huang, Z. Zhao, L. Cao, Y. Chen, E. Zhu, Z. Lin, M. Li, A. Yan, A. Zettl, Y. M. Wang, X. Duan, T. Mueller and Y. Huang, Science, 2015, 348, 1230–1234 CrossRef CAS PubMed.
- M. W. Kanan and D. G. Nocera, Science, 2008, 321, 1072–1075 CrossRef CAS PubMed.
- M. G. Walter, E. L. Warren, J. R. McKone, S. W. Boettcher, Q. Mi, E. A. Santori and N. S. Lewis, Chem. Rev., 2010, 110, 6446–6473 CrossRef CAS PubMed.
- K. S. Joya, K. Takanabe and H. J. M. de Groot, Adv. Energy Mater., 2014, 4, 1400252 CrossRef.
- J. W. D. Ng, M. Garcia-Melchor, M. Bajdich, P. Chakthranont, C. Kirk, A. Vojvodic and T. F. Jaramillo, Nat. Energy, 2016, 1, 16053 CrossRef CAS.
- J. Huang, J. Chen, T. Yao, J. He, S. Jiang, Z. Sun, Q. Liu, W. Cheng, F. Hu, Y. Jiang, Z. Pan and S. Wei, Angew. Chem., Int. Ed., 2015, 54, 8722–8727 CrossRef CAS PubMed.
- M. Gao, W. Sheng, Z. Zhuang, Q. Fang, S. Gu, J. Jiang and Y. Yan, J. Am. Chem. Soc., 2014, 136, 7077–7084 CrossRef CAS PubMed.
- F. Song and X. Hu, Nat. Commun., 2014, 5, 4477 CAS.
- K. Fan, H. Chen, Y. Ji, H. Huang, P. M. Claesson, Q. Daniel, B. Philippe, H. Rensmo, F. Li, Y. Luo and L. Sun, Nat. Commun., 2016, 7, 11981 CrossRef CAS PubMed.
- J. Suntivich, K. J. May, H. A. Gasteiger, J. B. Goodenough and Y. Shao-Horn, Science, 2011, 334, 1383–1385 CrossRef CAS PubMed.
- S. Zhou, X. Miao, X. Zhao, C. Ma, Y. Qiu, Z. Hu, J. Zhao, L. Shi and J. Zeng, Nat. Commun., 2016, 7, 11510 CrossRef CAS PubMed.
- Y. Li and C. Zhao, Chem. Mater., 2016, 28, 5659–5666 CrossRef CAS.
- H. Liu, H. Li and X. Wang, Small, 2016, 12, 2969–2974 CrossRef CAS PubMed.
- P. Chen, K. Xu, T. Zhou, Y. Tong, J. Wu, H. Cheng, X. Lu, H. Ding, C. Wu and Y. Xie, Angew. Chem., Int. Ed., 2016, 55, 2488–2492 CrossRef CAS PubMed.
- Z. Li, M. Shao, H. An, Z. Wang, S. Xu, M. Wei, D. G. Evans and X. Duan, Chem. Sci., 2015, 6, 6624–6631 RSC.
- X. Lu and C. Zhao, Nat. Commun., 2015, 6, 6616 CrossRef CAS PubMed.
- D. A. Corrigan and R. M. Bendert, J. Electrochem. Soc., 1989, 136, 723–728 CrossRef CAS.
- J. A. Haber, Y. Cai, S. Jung, C. Xiang, S. Mitrovic, J. Jin, A. T. Bell and J. M. Gregoire, Energy Environ. Sci., 2014, 7, 682–688 CAS.
- R. D. L. Smith, M. S. Prévot, R. D. Fagan, Z. Zhang, P. A. Sedach, M. K. J. Siu, S. Trudel and C. P. Berlinguette, Science, 2013, 340, 60–63 CrossRef CAS PubMed.
- R. D. L. Smith, M. S. Prévot, R. D. Fagan, S. Trudel and C. P. Berlinguette, J. Am. Chem. Soc., 2013, 135, 11580–11586 CrossRef CAS PubMed.
- C. Zhang, R. D. Fagan, R. D. L. Smith, S. A. Moore, C. P. Berlinguette and S. Trudel, J. Mater. Chem. A, 2015, 3, 756–761 CAS.
- B. Zhang, X. Zheng, O. Voznyy, R. Comin, M. Bajdich, M. García-Melchor, L. Han, J. Xu, M. Liu, L. Zheng, F. P. G. de Arquer, C. T. Dinh, F. Fan, M. Yuan, E. Yassitepe, N. Chen, T. Regier, P. Liu, Y. Li, P. D. Luna, A. Janmohamed, H. L. Xin, H. Yang, A. Vojvodic and E. H. Sargent, Science, 2016, 352, 333–337 CrossRef CAS PubMed.
- Z. Liu, R. Ma, M. Osada, K. Takada and T. Sasaki, J. Am. Chem. Soc., 2005, 127, 13869–13874 CrossRef CAS PubMed.
- M. Ghaed-Aminia, M. Bazarganipourb and M. Salavati-Niasari, J. Ind. Eng. Chem., 2015, 21, 1089–1097 CrossRef.
- Y.-P. Xu, D.-Y. Jiang, W.-B. Bu and J.-L. Shi, Chem. Lett., 2005, 34, 978–979 CrossRef CAS.
- N. Han, F. Zhao and Y. Li, J. Mater. Chem. A, 2015, 3, 16348–16353 CAS.
- M. Q. Yu, L. X. Jiang and H. G. Yang, Chem. Commun., 2015, 51, 14361–14364 RSC.
- F. A. Lima, R. Bjornsson, T. Weyhermüller, P. Chandrasekaran, P. Glatzel, F. Neesea and S. DeBeer, Phys. Chem. Chem. Phys., 2013, 15, 20911–20920 RSC.
- H.-Y. Wang, Y.-Y. Hsu, R. Chen, T.-S. Chan, H. M. Chen and B. Liu, Adv. Energy Mater., 2015, 5, 1500091 CrossRef.
- M. Hunault, J.-L. Robert, M. Newville, L. Galoisy and G. Calas, Spectrochim. Acta, Part A, 2014, 117, 406–412 CrossRef CAS PubMed.
- M. S. Burke, M. G. Kast, L. Trotochaud, A. M. Smith and S. W. Boettcher, J. Am. Chem. Soc., 2015, 137, 3638–3648 CrossRef CAS PubMed.
- B. J. Trześniewski, O. Diaz-Morales, D. A. Vermaas, A. Longo, W. Bras, M. T. M. Koper and W. A. Smith, J. Am. Chem. Soc., 2015, 137, 15112–15121 CrossRef PubMed.
- D. Friebel, M. W. Louie, M. Bajdich, K. E. Sanwald, Y. Cai, A. M. Wise, M.-J. Cheng, D. Sokaras, T.-C. Weng, R. Alonso-Mori, R. C. Davis, J. R. Bargar, J. K. Nørskov, A. Nilsson and A. T. Bell, J. Am. Chem. Soc., 2015, 137, 1305–1313 CrossRef CAS PubMed.
- J. Y. C. Chen, L. Dang, H. Liang, W. Bi, J. B. Gerken, S. Jin, E. E. Alp and S. S. Stahl, J. Am. Chem. Soc., 2015, 137, 15090–15093 CrossRef CAS PubMed.
- A. S. Batchellor and S. W. Boettcher, ACS Catal., 2015, 5, 6680–6689 CrossRef CAS.
- C. G. Morales-Guio, L. Liardet and X. Hu, J. Am. Chem. Soc., 2016, 138, 8946–8957 CrossRef CAS PubMed.
Footnote |
| † Electronic supplementary information (ESI) available: SEM and TEM images, XANES spectra and extra electrochemical test data. See DOI: 10.1039/c6sc04819f |
| This journal is © The Royal Society of Chemistry 2017 |


