 Open Access Article
Investigating allosteric effects on the functional dynamics of β2-adrenergic ternary complexes with enhanced-sampling simulations†
Noureldin
Saleh
a,
Giorgio
Saladino
b,
Francesco Luigi
Gervasio
 bc and
Timothy
Clark
 *a
*a
aComputer-Chemie-Centrum and Interdisciplinary Center for Molecular Materials, Friedrich-Alexander-Universität Erlangen-Nürnberg, Nägelsbachstraße 25, 91052 Erlangen, Germany. E-mail: tim.clark@fau.de
bDepartment of Chemistry, University College London, London WC1H 0AJ, UK
cInstitute of Structural and Molecular Biology, University College London, London WC1E 6BT, UK
First published on 24th March 2017
Abstract
Signalling by G-protein coupled receptors usually occurs via ternary complexes formed under cooperative binding between the receptor, a ligand and an intracellular binding partner (a G-protein or β-arrestin). While a global rational for allosteric effects in ternary complexes would be of great help in designing ligands with specific effects, the paucity of structural data for ternary complexes with β-arrestin, together with the intrinsic difficulty of characterizing the dynamics involved in the allosteric coupling, have hindered the efforts to devise such a model. Here we have used enhanced-sampling atomistic molecular-dynamics simulations to investigate the dynamics and complex formation mechanisms of both β-arrestin- and Gs-complexes with the β2-adrenergic receptor (ADRB2) in its apo-form and in the presence of four small ligands that exert different allosteric effects. Our results suggest that the structure and dynamics of arrestin–ADRB2 complexes depend strongly on the nature of the small ligands. The complexes exhibit a variety of different coupling orientations in terms of the depth of the finger loop in the receptor and activation states of ADRB2. The simulations also allow us to characterize the cooperativity between the ligand and intracellular binding partner (IBP). Based on the complete and consistent results, we propose an experimentally testable extended ternary complex model, where direction of the cooperative effect between ligand and IBP (positive or negative) and its magnitude are predicted to be a characteristic of the ligand signaling bias. This paves the avenue to the rational design of ligands with specific functional effects.
Introduction
G-protein coupled receptors (GPCRs) form activated ternary signalling complexes with an agonist ligand and an intracellular binding partner (IBP), which may be either a G-protein or arrestin, to control a plethora of physiological processes. GPCRs are targeted by over 30% of marketed drugs.1 Two crystal structures have revealed the architecture of rhodopsin–arrestin and β2-adrenergic receptor (ADRB2)–Gs signalling complexes.2,3 Still, the functional dynamics following the coupling mechanism of IBPs to GPCRs and the role of allosteric effects exerted by the ligands, which cannot be inferred easily from the static crystal structures, have only been partially addressed by spectroscopic studies.4GPCR–ligands can effect a variety of responses. They may not only be agonists, antagonists, partial agonists or inverse agonists, but can also affect alternative signalling pathways (such as those regulated by G-proteins or β-arrestin).5 This makes the rational design of GPCR–ligands particularly complex as both the binding affinity and the possible functional bias need to be predicted and designed. A global rational linking and explaining the various allosteric effects exerted by GPCR ligands remains elusive. However, devising such a model is complicated by the intrinsic difficulty of characterising the dynamic changes involved in the allosteric coupling and by the limited structural information available for β-arrestin ternary complexes. Indeed, only one agonist has been crystallized in an active G-protein-coupled state of ADRB2, and only rhodopsin was crystallized in complex with visual arrestin.2,3 The lack of high-resolution models complicates the design of ligands with specific allosteric effects and signalling bias.
Given the pivotal role of conformational dynamics in allosteric regulation,6,7 atomistic molecular-dynamics (MD) simulations can be of great help in providing a mechanistic understanding. MD simulations have successfully provided atomistic insight into microsecond-scale processes ranging from the deactivation of GPCRs, ligand–GPCR binding and nucleotide exchange in G-proteins.8–13 For instance, we recently proposed a three-site mechanism for activation/antagonism of the vasopressin receptor14 on the basis of extensive MD simulations using metadynamics enhanced sampling15,16 and showed that accurate binding free-energies can be obtained from metadynamics simulations on GPCR-complexes. We have also shown that enhanced-sampling simulations predict accurate free energies of binding (approximately within ±1 kcal mol−1) for all types of ligands (agonists, inverse agonists, antagonists) binding to the β2-adrenergic receptor.17
In this work, we investigate the far more complex cooperative effects of small ligands and an intracellular binding partner (IBP) forming a ternary complex.18 The extent of this cooperativity in the perspective of the ternary complex model has been determined experimentally in few cases for the G-protein3,19–22 and for arrestin,23–25 where the agonist affinity is enhanced to its GPCR in the presence of G-protein or arrestin.18 Building on our successful experience with the modelling and simulations of ternary complexes,26 we have computed for the first time the binding free energies along a physical association coordinate in a ternary complex (see Fig. 1 for modelled ADRB2 ternary complex structures). Our converged free energy landscapes allow us to quantify the cooperative effects of ligand and IBP on GPCR activation and to reveal the allosteric coupling mechanisms and the criteria that determine the efficacy of biased ligands. We propose an extended ternary complex model that can explain the functional bias of GPCR ligands. Our model leads to quantitative predictions that can be validated experimentally by measuring the cooperativity of ligands with each IBP. Moreover, we also provide detailed predictions on the effects of the ligands on the structure of the ADRB2–β arrestin complex.
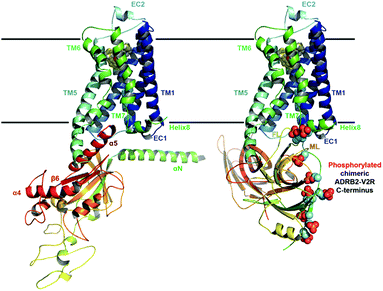 | ||
| Fig. 1 Ternary complex structure models of ADRB2 after 1 µs MD refinement Left: with its Gαs. Right: including the chimeric ADRB2–V2R C-terminus and in complex with β-arrestin. | ||
Results and discussion
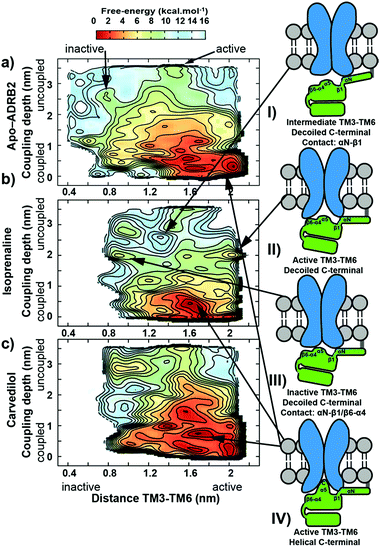
We have chosen ADRB2 as an example of a structurally well-characterized GPCR for which ample crystallographic information is available and for which well-characterized ligands have been co-crystallized. These include the full Gs-protein (Gs)/arrestin native agonist isoprenaline, 1,27 the Gs/arrestin unselective antagonist alprenolol, 2,28 the Gs inverse agonist/arrestin antagonist ICI-118,551, 3,28 and the Gs inverse agonist/arrestin partial agonist, carvedilol, 4.29 Ternary ADRB2–Gαs complexes for these ligands were constructed based on the X-ray structure of a ternary agonist (BI-167107)-ADBR2–Gs complex (PDB access code 3SN6).3 More complex modelling (see ESI Methods for more details†) was employed to model the experimental construct used by Wisler et al.30 to determine independent arrestin bias of ADRB2–ligands, by combining structural information from both crystal structures of the β-arrestin bound to the C-terminal peptide of the vasopressin-2 receptor (PDB access code 4JQI)31 and the S-arrestin-bound rhodopsin (PDB access code 4ZWJ).2 Our experience with transcription factors32 and GPCRs26,33–37 has shown that long relaxation times of one or more µs are necessary to eliminate the “memory effect” associated with simulations that start from homology models or from crystallographic structures far from the equilibrium structure in solution.32 This conclusion does not mean that the homology models can relax globally within the equilibrium time because activation timescale of GPCRs are known to be in the region of milliseconds.38 The results reported below, however, strongly suggest that the locally relaxed structures are sufficient to allow the subsequent metadynamics simulations to sample the conformational changes associated with activation/deactivation. Here, in accord with established practice,26,33–37,39,40 we have only included the α-subunit of the G-protein. This choice has been shown to allow a reduction of the size of the system (and a significant increase in the sampling) while not compromising the quality of the predictions. The chosen model is appropriate for describing the Gαs dissociation at the end of the signalling cycle, after the β- and γ-subunits have detached. All models were relaxed with long MD simulation (details are given in the ESI Methods).Using massive enhanced-sampling MD simulations and a generous computer time allocation on a Tier-0 supercomputer, we were able for the first time to compute the converged free-energy profiles (FEPs) associated to the binding of ADBR2 to both Gαs and β-arrestin, both in the absence and presence of four ligands (see Fig. 2 and S1†). The free energy was computed as a function of two variables describing the reaction coordinate. The distance between transmembrane helices 3 and 6 (TM3–TM6) was used to indicate receptor activation. The transition between active (large distances) and inactive receptor occurs at a distance of 1.4 nm.6 The coupling depth defines the binding position of the IBP. The coupling depth is defined as the z-component of the distance between Cα of Glu392 in the α5-helix of Gαs and Cα of Arg3.50 in ADRB2. As for our simulations of the ligand-binding process,17 we make use of the orientation of the receptor in the membrane, so that the z-distance, where the z-direction is perpendicular to the membrane plane, provides a convenient and effective collective variable for the IBP-binding process without restricting conformational or orientational freedom in the membrane plane (see ESI Methods for more details†). The bound Gs in the ternary complex crystal structure corresponds to a coupling depth of 0.1 nm and one larger than 2.5 nm to the uncoupled IBP. Each simulation required approximately 7 µs to converge (see Fig. S3† for sampling exhaustiveness) and by sampling multiple reactive events, quantified the deactivation behaviour observed in unbiased simulations8 (see Fig. S2†).
To our knowledge, these coupling simulations are the first to characterize G-protein or arrestin coupling to a GPCR for both the apo- and ligand-bound receptors. The simulations, which use proven enhanced-sampling algorithms and a reliable force field, reveal the activation state of the global energy minimum for each ligand–ADRB2–β-arrestin and ligand–ARDRB2–Gαs complex and thus ligand-effects on GPCR coupling and signalling.
Both the apo- and ligand-bound ADRB2 complexes exhibit a specific global minimum conformation, in which the TM3–TM6 distance indicates an active receptor and the IBP-coupling coordinate a tightly bound Gαs. Both the calculated apo-ADRB2–Gαs and isoprenaline–ADRB2–Gαs binding free energies (approximately −11 to −12 kcal mol−1, respectively, at 298 K) are consistent with those determined experimentally for the opioid receptor to Gi (Kd = 20 and 9 nM for the apo and agonist-bound receptors, respectively, corresponding to −10.9 and −11.1 kcal mol−1 at 298 K).41
The metadynamics simulations suggest a pattern of three closely located local minima (structures shown in Fig. S4 of the ESI†) less than 1 kcal mol−1 apart for the binary apo-ADRB2–Gαs complex (at 1.6/0.1, 1.6/0.8 and 2.0/0.1 nm values for the TM3–TM6 distance and coupling depth, respectively, see Fig. 2A). The error bar on the free energy reconstruction does not allow us to distinguish between three distinct minima and a single, wide free energy basin. However, earlier simulations have suggested plasticity of the conformations of ADRB2 and helix 5 of Gαs to allow ADRB2 to couple to both Gi and Gs,42 consistent with our results. Agonist binding to the ADRB2–Gαs complex (shown for isoprenaline in Fig. 2B) converts this wide basin to a single distinct minimum, indicating a cooperative allosteric communication between the coupling interface and the ligand-binding pocket, since the ability of the ligands to stabilize a distinct conformation was accompanied by a change in the affinity toward the coupling partner. The Gs inverse agonist carvedilol exhibits a similar extended binding basin as found for the apo-receptor (Fig. 2C).
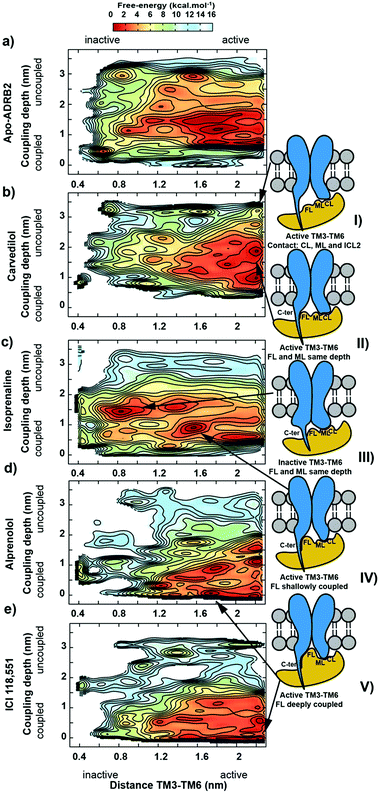
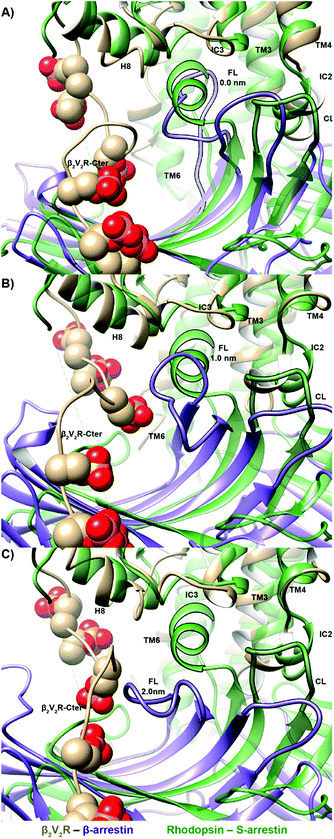
Arrestin coupling is far more complex and heterogeneous than for the G-protein. Coupling is initiated by the middle- and c-loops of the arrestin (see Fig. 1 and S5† for the arrestin complex structure) interacting with intracellular loop 2 (ICL2) of the receptor. In contrast, within the arrestin, the finger-loop retains its interaction with the polar core. The ligand-bound simulations show a broad binding basin spread over a 2 nm range of coupling depth and including both active and inactive states (see Fig. 3A). This is consistent with the experimental indications of conformational flexibility observed in attempts to crystallize rhodopsin-bound arrestin.2 This conformational heterogeneity also characterizes the coupling to both the full-agonist, isoprenaline (Fig. 3B), and the partial agonist, carvedilol (see Fig. 3C), neither of which coupled as intimately with the finger loop as found in the arrestin–rhodopsin structure. This deep finger loop conformer was found, however, for the receptor bound to the antagonist alprenolol and inverse agonist ICI 118551 (see Fig. 4, 3D and E). A recent fluorescence spectroscopy study has provided evidence of this partially engaged GPCR–arrestin complexes for both carvedilol and isoprenaline.43
Because the β-arrestin never separates fully from the phosphorylated chimeric C-terminus of the receptor in the metadynamics simulations, we cannot estimate a coupling affinity for arrestin, only for Gαs, for which a good correlation with experiment is found (see Table 1 and Fig. S1†).
| Ligand | Functional bias | ΔΔGligand | ΔΔGGs | ||
|---|---|---|---|---|---|
| Gs | β-Arrestin | Gs | β-Arrestin | ||
| 1 | Agonist | Agonist | −2.2 (−2.8) | −4.5 | −2 |
| 2 | Antagonist | Antagonist | +0.3 | +6.1 | 0 |
| 3 | Inverse agonist | Antagonist | +1.5 (+1.5) | +0.4 | +4 |
| 4 | Inverse agonist | Partial agonist | +2.5 | −3.6 | +3 |
The simulations also reveal some structural changes during the coupling to the IBP:
1. The C-terminus of the α5 helix of Gαs uncoils in the uncoupled states (coupling depth values > 2.5 nm), which explains the absence of this region in the crystal structure of the uncoupled trimeric G-protein (see Fig. S6,† PDB accession code: 1GOT44).
2. The isoprenaline-bound receptor then transits to either active or inactive receptor conformations that interact additionally with β6-α4 secondary structural elements of Gαs and subsequently slowly with the α5 helix, whose C-terminal later adopts a helix form (see diagrams II, III and IV in Fig. 2).
3. A recognition mechanism common to the two IBPs involves interactions between ICL2 of the receptor and either the αN-β1 secondary structural elements of Gαs or the middle and C-loops of the β-arrestin (see Fig. S5† and diagram I in both Fig. 2 and 3). The finger-loop of β-arrestin loses its helical form at coupling depths > 2.5 nm (similar to the α5 helix of Gαs) and returns to an uncoiled conformation that interacts intimately with the polar core of the arrestin.
The binding free energies computed following the protocol of ref. 17 agree well with experiment. The root mean square error (RMSE) is only 0.5 kcal mol−1 (see Fig. S7 and Table S1 of the ESI†). We extended the sampling to at least 1 µs to ensure convergence and accuracy, where the FES changes less than 0.1 kcal mol−1 in 200 ns of extra sampling (see Fig. S8†). The metadynamics simulations reproduce the free energy of the ligands as they progress from the extracellular region to the orthosteric binding site, and thus allow us to calculate the changes in both ligand- and IBP-binding energies caused by cooperative binding between the two. The deepest minima found for each ternary complex were refined with unbiased molecular dynamics and our recently reported metadynamics scheme17 used to scan the free-energy landscapes for the binding of each ligand to apo-ADRB2, the Gs- and arrestin-complexes. The agreement between the simulated complexes and the available X-ray structures is shown in Fig. S9 of the ESI.†Fig. 5 shows the binding free-energy profiles obtained and Table 1 summarizes the effects of Gαs and β-arrestin on the ligand-binding free energies and those of the ligands on Gαs-binding.
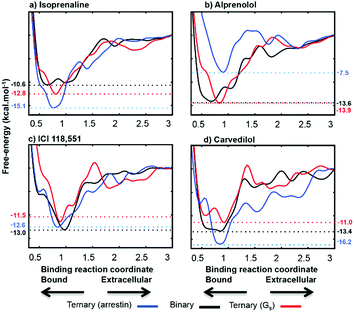 | ||
| Fig. 5 Calculated free energy profiles for the four ligands. The binding coordinate is defined in the ESI Methods section.† Free energies are given relative to the separated binding partners for apo-ADRB2 and the Gαs complex and as explained in the text for the β-arrestin complex. | ||
The free-energy profiles for ligand-binding (Fig. 5) show that both Gαs and arrestin affect the binding energy of the most stable binding site at approximately 0.8 nm on our reaction coordinate, in accord with the ternary-complex model.18 In particular, the experimentally known changes in binding free energy of ligands 1 and 3 on G-protein binding are reproduced well. Importantly Table 1 also shows that the direction in which the IBP changes the ligand-binding energy relative to apo-ADRB2 is indicative of the intrinsic activity of each ligand with respect to the pathway controlled by the IBP, as defined by Wisler et al.30
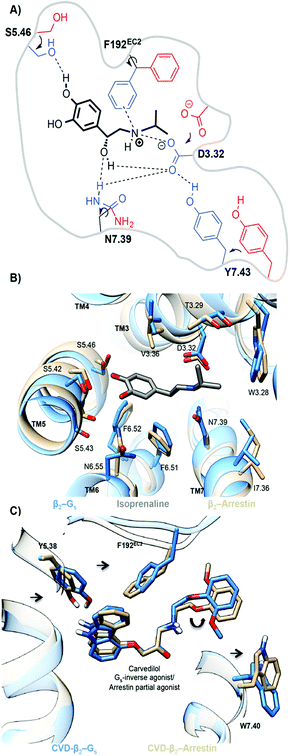
The simulations also provide atomistic details of the determinants of functional bias. Both the Gs- and arrestin-activated pockets of ADRB2–isoprenaline (TM3–TM6 distance; 1.6 nm = active) show similar tightening in the binding pocket relative to the inactive-binary ADRB2 (TM3–TM6 distance; 0.9 nm = inactive). The interaction of the agonist with S5.46, leads to an inward movement of TM5, and the size of the alkylammonium group allows the formation of a TM3–TM7 lock through interactions of the agonist with D3.32, N7.39 and Y7.43 (see Fig. 6(a)). Although these changes are similar for the G-protein and arrestin ternary complexes, the two do show slight differences. For the ternary Gs-complex, we find a larger inward movement of F192EC2, N6.55 and I7.36 and slightly more outward orientation of T3.29, V3.36 and S5.46. Because, however, isoprenaline is an agonist for both pathways, these differences need not be significant.
The biased arrestin partial-agonist/Gs inverse-agonist, carvedilol provides an excellent demonstration that marginally different binding-pocket geometries are important for biased ligand function. Fig. 6(c) shows the subtle reorientations in the binding pockets that lead to the change in the carvedilol pose. Both the unbiased MD- and metadynamics simulations exhibit a 180° flip of the phenoxyl moiety of carvedilol, 4, in the destabilized ternary Gs–carvedilol–ADRB2 complex relative to both the higher-affinity binary ADRB2–carvedilol complex and the stabilized ternary arrestin–ADRB2–carvedilol complex. This flip is caused by the preferred inward movement of F192EC2 in the ternary Gs-complex. It is thus responsible for the inverse agonistic effect of carvedilol toward G-protein coupling. Both arrestin and G-protein reoriented residues lining the binding pocket and controlled the size of the binding cavity. These changes in the ligand-binding pockets provide a basis for the rational design of biased agonists.
Conclusions
Our simulations suggest that an interplay between ligand binding and the coupling of either arrestin or G-protein can provide a basis to understand and predict biased signalling. The ligand changes the binding free-energy of the IBP, thus controlling the signalling pathway regulated by IBP. This free-energy change is due to an allosteric communication between the ligand binding site and the IBPs.ADRB2 belongs to the “class A” category of weakly arrestin-recruiting GPCRs.45 Thus, determining the biased arrestin signalling of ligands on the wild type receptor accurately remains a major experimental challenge.30 Our simulations therefore provide a basis and much needed tool for rationalizing the effects and assisting drug design of biased GPCR–ligands. Our ability to probe and map the free energy and the flexibility of the coupling between ADRB2 and the IBPs promises to be an important assisting factor for efforts to determine the structures of arrestin–GPCR complexes.
The simulations also provide another important tool for SBDD; they can be used to classify the effects of ligands on the receptor. This is shown schematically in Fig. 7. The effect of the IBP on the binding energy of the ligand is indicative of the effect invoked by the ligand. Agonists and partial agonists increase (make more negative) the binding free energy of the corresponding IBP, antagonists leave it largely unaffected or decrease it slightly, and inverse agonists decrease it strongly. Thus, based on the eight functional efficacies available for the four ligands, we can conclude that comparison of ligand-binding free energies from simulations of binary and ternary complexes (three simulations per ligand) allow us to identify the functional bias of the ligand. This is shown schematically in Fig. 7. This simple scheme allows ligands to be classified without resorting to experiment.
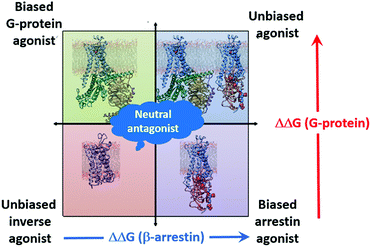 | ||
| Fig. 7 Schematic diagram showing the classification of the effects of ligands based on the change in the ligand binding free energy on binding an IBP. | ||
Growing experimental evidence has connected the changes upon IBP-coupling and the ligand binding sites.42,46 Designing drugs for the active and inactive conformational states of ADRB2 using virtual screening has shown potential in discovering agonists.47,48 Our results indicate that using further receptor states including the subtle changes between different IBPs may help discover functionally biased ligands. Our work has shown the success of metadynamics-enhanced atomistic simulations in probing those different functional states, thus further assessment for the ability of the method to predict active state GPCR conformations using the inactive crystal structures might enforce the ability of the methods to reveal and predict the multiple GPCR conformational states observed in spectroscopy49–51 and to reproduce their equilibrium probabilities. Our simulations have provided the first structural insight in atomistic resolution of the partially-engaged arrestin complexes to the ADRB2 that were characterized only recently.43
This work highlights the role of MD simulations as tools to obtain information that would otherwise be hardly accessible to experiment. This is both an important point and one that requires careful validation by prediction of and comparison with experimentally available data. We have shown that metadynamics simulations of the type used here are able to calculate ligand free energies of binding accurately, regardless of the efficacy of the ligand with remarkable agreement with experiment as shown by the RMSE of only 0.5 kcal mol−1. We suggest that a further extension of the ternary complex model, where the ligand bias towards either the G-protein or arrestin pathway is controlled by the cooperative effect induced by the coupling partner on the ligand affinity, as shown in Fig. 7. Our simulations reveal the fine difference in the architecture of the ADRB2 in both arrestin- and Gs-stabilized states, thus design of ligands with specific signalling properties can be achieved through stabilization of these specific changes in each pocket. We also suggest that Fig. 7 provides an excellent opportunity for blind tests as to whether the simulations can predict both the binding affinity and the efficacy (unbiased or biased, agonist, antagonist, inverse agonist) of unknown ligands based on their cooperative effect to the IBP to match that from experiment.
Acknowledgements
This work was supported by the Deutsche Forschungsgemeinschaft as part of GRK1910 “Medicinal Chemistry of Selective GPCR Ligands” and by a generous grant of computer time on SuperMUC at the Leibniz Rechenzentrum, Munich (projects pr94to and pr74su). G. S. and F. L. G. acknowledge EPSRC [grant no. EP/M013898/1] for financial support. We thank Peter Gmeiner and Lampros Milanos for helpful discussions.Notes and references
- J. W. Wisler, K. Xiao, A. R. Thomsen and R. J. Lefkowitz, Curr. Opin. Cell Biol., 2014, 27, 18–24 CrossRef CAS PubMed.
- Y. Kang, X. E. Zhou, X. Gao, Y. He, W. Liu, A. Ishchenko, A. Barty, T. A. White, O. Yefanov, G. W. Han, Q. Xu, P. W. de Waal, J. Ke, M. H. Tan, C. Zhang, A. Moeller, G. M. West, B. D. Pascal, N. Van Eps, L. N. Caro, S. A. Vishnivetskiy, R. J. Lee, K. M. Suino-Powell, X. Gu, K. Pal, J. Ma, X. Zhi, S. Boutet, G. J. Williams, M. Basu, S. Roy-Chowdhury, C. E. Conrad, J. Coe, H. Liu, S. Lisova, C. Kupitz, I. Grotjohann, R. Fromme, Y. Jiang, M. Tan, H. Yang, J. Li, M. Wang, Z. Zheng, D. Li, N. Howe, Y. Zhao, J. Standfuss, K. Diederichs, Y. Dong, C. S. Potter, B. Carragher, M. Caffrey, H. Jiang, H. N. Chapman, J. C. Spence, P. Fromme, U. Weierstall, O. P. Ernst, V. Katritch, V. V. Gurevich, P. R. Griffin, W. L. Hubbell, R. C. Stevens, V. Cherezov, K. Melcher and H. E. Xu, Nature, 2015, 523, 561–567 CrossRef CAS PubMed.
- S. G. Rasmussen, B. T. DeVree, Y. Zou, A. C. Kruse, K. Y. Chung, T. S. Kobilka, F. S. Thian, P. S. Chae, E. Pardon, D. Calinski, J. M. Mathiesen, S. T. Shah, J. A. Lyons, M. Caffrey, S. H. Gellman, J. Steyaert, G. Skiniotis, W. I. Weis, R. K. Sunahara and B. K. Kobilka, Nature, 2011, 477, 549–555 CrossRef CAS PubMed.
- K. Y. Chung, S. G. Rasmussen, T. Liu, S. Li, B. T. DeVree, P. S. Chae, D. Calinski, B. K. Kobilka, V. L. Woods Jr and R. K. Sunahara, Nature, 2011, 477, 611–615 CrossRef CAS PubMed.
- E. J. Whalen, S. Rajagopal and R. J. Lefkowitz, Trends Mol. Med., 2011, 17, 126–139 CrossRef CAS PubMed.
- J. Guo and H.-X. Zhou, Chem. Rev., 2016, 116, 6503–6515 CrossRef CAS PubMed.
- E. Papaleo, G. Saladino, M. Lambrughi, K. Lindorff-Larsen, F. L. Gervasio and R. Nussinov, Chem. Rev., 2016, 116, 6391–6423 CrossRef CAS PubMed.
- R. O. Dror, D. H. Arlow, P. Maragakis, T. J. Mildorf, A. C. Pan, H. F. Xu, D. W. Borhani and D. E. Shaw, Proc. Natl. Acad. Sci. U. S. A., 2011, 108, 18684–18689 CrossRef CAS PubMed.
- Y. L. Miao, S. E. Nichols, P. M. Gasper, V. T. Metzger and J. A. McCammon, Proc. Natl. Acad. Sci. U. S. A., 2013, 110, 10982–10987 CrossRef CAS PubMed.
- R. O. Dror, A. C. Pan, D. H. Arlow, D. W. Borhani, P. Maragakis, Y. Shan, H. Xu and D. E. Shaw, Proc. Natl. Acad. Sci. U. S. A., 2011, 108, 13118–13123 CrossRef CAS PubMed.
- R. O. Dror, H. F. Green, C. Valant, D. W. Borhani, J. R. Valcourt, A. C. Pan, D. H. Arlow, M. Canals, J. R. Lane, R. Rahmani, J. B. Baell, P. M. Sexton, A. Christopoulos and D. E. Shaw, Nature, 2013, 503, 295–299 CAS.
- R. O. Dror, T. J. Mildorf, D. Hilger, A. Manglik, D. W. Borhani, D. H. Arlow, A. Philippsen, N. Villanueva, Z. Yang, M. T. Lerch, W. L. Hubbell, B. K. Kobilka, R. K. Sunahara and D. E. Shaw, Science, 2015, 348, 1361–1365 CrossRef CAS PubMed.
- D. Provasi, A. Bortolato and M. Filizola, Biochem., 2009, 48, 10020–10029 CrossRef CAS PubMed.
- N. Saleh, G. Saldino, F. L. Gervasio, E. Haensele, L. Banting, D. C. Whitley, J. Sopkova-de Oliveira Santos, R. Bureau and T. Clark, Angew. Chem., Int. Ed., 2016, 128, 8008–8012 CrossRef PubMed.
- A. Laio and M. Parrinello, Proc. Natl. Acad. Sci. U. S. A., 2002, 99, 12562–12566 CrossRef CAS PubMed.
- A. Cavalli, A. Spitaleri, G. Saladino and F. L. Gervasio, Acc. Chem. Res., 2015, 48, 277–285 CrossRef CAS PubMed.
- N. Saleh, G. Saladino, F. L. Gervasio and T. Clark, J. Chem. Inf. Model. Search PubMed , submitted.
- A. De Lean, J. M. Stadel and R. J. Lefkowitz, J. Biol. Chem., 1980, 255, 7108–7117 CAS.
- V. V. Gurevich, R. Pals-Rylaarsdam, J. L. Benovic, M. M. Hosey and J. J. Onorato, J. Biol. Chem., 1997, 272, 28849–28852 CrossRef CAS PubMed.
- A. C. Kruse, A. M. Ring, A. Manglik, J. Hu, K. Hu, K. Eitel, H. Hubner, E. Pardon, C. Valant, P. M. Sexton, A. Christopoulos, C. C. Felder, P. Gmeiner, J. Steyaert, W. I. Weis, K. C. Garcia, J. Wess and B. K. Kobilka, Nature, 2013, 504, 101–106 CrossRef CAS PubMed.
- W. Huang, A. Manglik, A. J. Venkatakrishnan, T. Laeremans, E. N. Feinberg, A. L. Sanborn, H. E. Kato, K. E. Livingston, T. S. Thorsen, R. C. Kling, S. Granier, P. Gmeiner, S. M. Husbands, J. R. Traynor, W. I. Weis, J. Steyaert, R. O. Dror and B. K. Kobilka, Nature, 2015, 524, 315–321 CrossRef CAS PubMed.
- S. G. F. Rasmussen, H. J. Choi, J. J. Fung, E. Pardon, P. Casarosa, P. S. Chae, B. T. DeVree, D. M. Rosenbaum, F. S. Thian, T. S. Kobilka, A. Schnapp, I. Konetzki, R. K. Sunahara, S. H. Gellman, A. Pautsch, J. Steyaert, W. I. Weis and B. K. Kobilka, Nature, 2011, 469, 175–180 CrossRef CAS PubMed.
- S. J. Sanni, J. T. Hansen, M. M. Bonde, T. Speerschneider, G. L. Christensen, S. Munk, S. Gammeltoft, J. L. Hansen and J. Brit, Pharmacol., 2010, 161, 150–161 CAS.
- R. Jorgensen, L. Martini, T. W. Schwartz and C. E. Elling, Mol. Endocrinol., 2005, 19, 812–823 CrossRef CAS PubMed.
- L. Martini, H. Hastrup, B. Holst, A. Fraile-Ramos, M. Marsh and T. W. Schwartz, Mol. Endocrinol., 2002, 62, 30–37 CAS.
- R. C. Kling, H. Lanig, T. Clark and P. Gmeiner, PloS one, 2013, 8, e67244 CAS.
- T. Warne, R. Moukhametzianov, J. G. Baker, R. Nehme, P. C. Edwards, A. G. Leslie, G. F. Schertler and C. G. Tate, Nature, 2011, 469, 241–244 CrossRef CAS PubMed.
- D. Wacker, G. Fenalti, M. A. Brown, V. Katritch, R. Abagyan, V. Cherezov and R. C. Stevens, J. Am. Chem. Soc., 2010, 132, 11443–11445 CrossRef CAS PubMed.
- T. Warne, P. C. Edwards, A. G. Leslie and C. G. Tate, Structure, 2012, 20, 841–849 CrossRef CAS PubMed.
- J. W. Wisler, S. M. DeWire, E. J. Whalen, J. D. Violin, M. T. Drake, S. Ahn, S. K. Shenoy and R. J. Lefkowitz, Proc. Natl. Acad. Sci. U. S. A., 2007, 104, 16657–16662 CrossRef CAS PubMed.
- A. K. Shukla, A. Manglik, A. C. Kruse, K. H. Xiao, R. I. Reis, W. C. Tseng, D. P. Staus, D. Hilger, S. Uysal, L. Y. Huang, M. Paduch, P. Tripathi-Shukla, A. Koide, S. Koide, W. I. Weis, A. A. Kossiakoff, B. K. Kobilka and R. J. Lefkowitz, Nature, 2013, 497, 137–141 CrossRef CAS PubMed.
- F. Haberl, H. Lanig and T. Clark, Proteins: Struct., Funct., Bioinf., 2009, 77, 857–866 CrossRef CAS PubMed.
- L. Milanos, N. Saleh, R. C. Kling, J. Kaindl, N. Tschammer and T. Clark, Angew. Chem., Int. Ed., 2016, 55, 15277–15281 CrossRef CAS PubMed.
- H. Hübner, T. Schellhorn, M. Gienger, C. Schaab, J. Kaindl, L. Leeb, T. Clark, D. Möller and P. Gmeiner, Nat. Commun., 2016, 7, 12298 CrossRef PubMed.
- R. C. Kling, T. Clark and P. Gmeiner, PLoS ONE, 2016, 11, e0146612 Search PubMed.
- C. Schaab, R. C. Kling, J. Einsiedel, H. Hübner, T. Clark, D. Seebach and P. Gmeiner, ChemistryOpen, 2014, 3, 206–218 CrossRef CAS PubMed.
- R. C. Kling, N. Tschammer, H. Lanig, T. Clark and P. Gmeiner, PLoS ONE, 2014, 9, e100069 Search PubMed.
- A. Grossfeld and D. M. Zuckermann, Annu. Rep. Comput. Chem., 2009, 5, 23–48 CrossRef.
- D. V. Pachov, R. Fonseca, D. Arnol, J. Bernauer and H. van den Bedem, J. Chem. Theory Comput., 2016, 12, 946–956 CrossRef CAS PubMed.
- Z. Feng, T. Hou and Y. Li, J. Chem. Inf. Model., 2012, 52, 1005–1014 CrossRef CAS PubMed.
- I. D. Alves, Z. Salamon, E. Varga, H. I. Yamamura, G. Tollin and V. J. Hruby, J. Biol. Chem., 2003, 278, 48890–48897 CrossRef CAS PubMed.
- A. S. Rose, M. Elgeti, U. Zachariae, H. Grubmuller, K. P. Hofmann, P. Scheerer and P. W. Hildebrand, J. Am. Chem. Soc., 2014, 136, 11244–11247 CrossRef CAS PubMed.
- P. Kumari, A. Srivastava, R. Banerjee, E. Ghosh, P. Gupta, R. Ranjan, X. Chen, B. Gupta, C. Gupta, D. Jaiman and A. K. Shukla, Nature Commun., 2016, 7, 13416 CrossRef CAS PubMed.
- D. G. Lambright, J. Sondek, A. Bohm, N. P. Skiba, H. E. Hamm and P. B. Sigler, Nature, 1996, 379, 311–319 CrossRef CAS PubMed.
- R. H. Oakley, S. A. Laporte, J. A. Holt, M. G. Caron and L. S. Barak, J. Biol. Chem., 2000, 275, 17201–17210 CrossRef CAS PubMed.
- B. T. DeVree, J. P. Mahoney, G. A. Velez-Ruiz, S. G. Rasmussen, A. J. Kuszak, E. Edwald, J. J. Fung, A. Manglik, M. Masureel, Y. Du, R. A. Matt, E. Pardon, J. Steyaert, B. K. Kobilka and R. K. Sunahara, Nature, 2016, 535, 182–186 CrossRef CAS PubMed.
- M. Marti-Solano, D. Schmidt, P. Kolb and J. Selent, Drug Discovery Today, 2016, 21, 625–631 CrossRef CAS PubMed.
- D. R. Weiss, S. Ahn, M. F. Sassano, A. Kleist, X. Zhu, R. Strachan, B. L. Roth, R. J. Lefkowitz and B. K. Shoichet, ACS Chem. Biol., 2013, 8, 1018–1026 CrossRef CAS PubMed.
- J. J. Liu, R. Horst, V. Katritch, R. C. Stevens and K. Wuthrich, Science, 2012, 335, 1106–1110 CrossRef CAS PubMed.
- A. Manglik, T. H. Kim, M. Masureel, C. Altenbach, Z. Yang, D. Hilger, M. T. Lerch, T. S. Kobilka, F. S. Thian, W. L. Hubbell, R. S. Prosser and B. K. Kobilka, Cell, 2015, 161, 1101–1111 CrossRef CAS PubMed.
- L. Ye, N. Van Eps, M. Zimmer, O. P. Ernst and R. S. Prosser, Nature, 2016, 533, 265–268 CrossRef CAS PubMed.
Footnote |
| † Electronic supplementary information (ESI) available. See DOI: 10.1039/c6sc04647a |
| This journal is © The Royal Society of Chemistry 2017 |

