 Open Access Article
Rapid and sensitive detection of Salmonella enteritidis by a pre-concentrated immunochromatographic assay in a large-volume sample system†
Miao-Lin Duan a,
Yan-Mei Huangc,
Song-Song Wua,
Guo-Qiang Lia,
Shu-Ying Wanga,
Ming-Hui Chena,
Chun Wanga,
Dao-Feng Liu*b,
Cheng-Wei Liu*b and
Wei-Hua Lai*a
aState Key Laboratory of Food Science and Technology, Nanchang University, 235, Nanjing East Road, Nanchang 330047, China. E-mail: talktolaiwh@163.com; Fax: +86 791 88333708; Tel: +86 138 79178802
bInstitute for Nutrition and Food Safety, Jiangxi Province Centre for Disease Control and Prevention, 555, Beijing East Road, Nanchang 330029, China. E-mail: defoelau@163.com; liuchengwei718@sina.com
cJiangxi YeLi Medical Device Co., Ltd, 2799, Tianxiang Road, Nanchang 330008, China
First published on 4th December 2017
Abstract
A pre-concentrated immunochromatographic assay for Salmonella enteritidis (S. enteritidis) detection was developed based on the unique optical and magnetic properties of magnetic nanoparticles (MNPs). The target was easily concentrated from a large volume of sample by using immune MNPs (IMNPs) with superparamagnetism. The results could be directly distinguished using colored IMNPs on test strip. A target elution step was not required in the proposed method. The key parameters, including coupling pH, blocking agents, and amount of IMNPs on the test strip, were optimized. Colloidal gold-based immunochromatographic assay (CG-ICA), MNP-based immunochromatographic assay (MNP-ICA), and MNP-ICA for a large-volume sample (large-volume MNP-ICA) were compared. Under optimal conditions, the sensitivity of large-volume MNP-ICA was 1.95 × 10⁵ CFU mL−1, which was 10 times higher than that of MNP-ICA and 1000 times higher than that of CG-ICA, owing to the pre-concentration from a large sample volume. Moreover, the antibody consumption of large-volume MNP-ICA was lower than that of conventional CG-ICA. The entire detection time of the proposed method was only 30 min. In general, the proposed method may be considered as a rapid, sensitive, and simple screening tool for on-site detection of S. enteritidis as well as other pathogens.
1 Introduction
Salmonella is the most common and primary cause of food contamination in many countries.1,2 Approximately 93.8 million cases of Salmonella infection and 155![[thin space (1/6-em)]](https://www.rsc.org/images/entities/char_2009.gif) 000 associated deaths occur each year.3 In Salmonella species, Salmonella enterica subsp. enterica serovar Enteritidis (S. enteritidis) is the main pathogen, infection of which involves typical symptoms of fever, diarrhea, vomiting, and acute gastroenteritis.4,5 As one of the most important causes of food-borne illness worldwide, among Salmonella serovars, the proportion of S. enteritidis isolated from humans was 43.5% in the North American and Oceania (Australia and New Zealand) regions.6 Traditional separation identification method, including pre-enrichment, selective enrichment, isolated culture, biochemical identification, and serological identification, is used as the “gold standard” for detecting S. enteritidis in food samples. However, it takes 5–7 days to identify the target bacterium, and isolation and culture are also time-consuming and laborious. To address these issues, several effective methods for the detection of S. enteritidis have been developed, including enzyme-linked immunosorbent assay7 (ELISA), electrochemical method,8 and polymerase chain reaction-based method.9 These detection methods have the advantages of high sensitivity and high specificity.10–12 However, these methods require trained personnel, complex procedure, or expensive instruments. To a certain degree, such drawbacks limit these methods from application in on-site detection.
000 associated deaths occur each year.3 In Salmonella species, Salmonella enterica subsp. enterica serovar Enteritidis (S. enteritidis) is the main pathogen, infection of which involves typical symptoms of fever, diarrhea, vomiting, and acute gastroenteritis.4,5 As one of the most important causes of food-borne illness worldwide, among Salmonella serovars, the proportion of S. enteritidis isolated from humans was 43.5% in the North American and Oceania (Australia and New Zealand) regions.6 Traditional separation identification method, including pre-enrichment, selective enrichment, isolated culture, biochemical identification, and serological identification, is used as the “gold standard” for detecting S. enteritidis in food samples. However, it takes 5–7 days to identify the target bacterium, and isolation and culture are also time-consuming and laborious. To address these issues, several effective methods for the detection of S. enteritidis have been developed, including enzyme-linked immunosorbent assay7 (ELISA), electrochemical method,8 and polymerase chain reaction-based method.9 These detection methods have the advantages of high sensitivity and high specificity.10–12 However, these methods require trained personnel, complex procedure, or expensive instruments. To a certain degree, such drawbacks limit these methods from application in on-site detection.
Immunochromatographic assay (ICA) is a widely used technology in the field of rapid detection.13–16 Traditional colloidal gold-based immunochromatographic assay (CG-ICA) has four advantages: short period of time required to acquire test results, user-friendly format, and long-term stability over a wide range of climates, and relatively inexpensive production. However, CG-ICA shows limited detection sensitivity.17,18
Immunomagnetic separation has been a useful technology to concentrate and separate target pathogens from complex food samples.19–22 In recent years, immunomagnetic separation was also coupled with ICA to improve the detection sensitivity and specificity. For example, Cui et al.23 established a method combined immunomagnetic separation with CG-ICA to isolate and detect Escherichia coli O157:H7. Zhang et al.16 reported a method for the detection of Enterobacter cloacae by immunomagnetic separation and a CG-ICA. The sensitivity of the method was 10 times higher than that of direct detection with ICA. Li et al.24 developed a rapid method to detect Listeria monocytogenes using fluorescence immunochromatographic assay combined with immunomagnetic separation and 40-fold improvement of detection limit was achieved compared with fluorescence immunochromatographic assay. In their previous work, the optical property of MNPs was underutilized. Target bacteria need to be eluted and then detected by an additional ICA. The elution step complicated the detection procedure and probably resulted in the loss of targets.
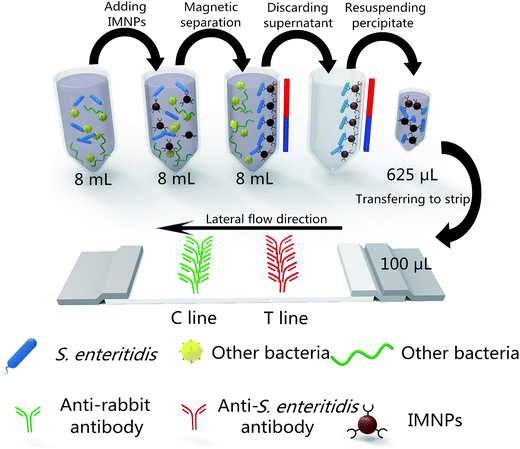
In this study, a MNP-based pre-concentrated ICA was developed for rapid and sensitive detection of S. enteritidis (large-volume MNP-ICA). A large-volume of sample (8 mL) was used in this proposed method and concentrated to a small volume for S. enteritidis detection. IMNPs were used not only to capture S. enteritidis from large-volume sample but also to act as a colored signal label based on its optical property. Target elution step was omitted and the loss of target was avoided. The sensitivity of the proposed method was obviously improved with simplified experimental procedure.
2 Materials and methods
2.1 Materials
2.2 Preparation of probes
A total of 100 μL of active N-hydroxysuccinimide esterified MNPs (10 mg mL−1) with the diameter of 150 nm was added into a centrifuge tube. After washing with MES buffer solution twice to remove the excess chemical reagents, 1 mL of pH-adjusted purified anti-S. enteritidis polyclonal antibody (Q1) solution (60 μg mL−1) was added to the centrifuge tube. The mixture was reacted at room temperature for 4 h. After magnetic separation, the supernatant was used for subsequent calculation of coupling rate. Afterward, 1 mL of 3% BSA (w/v) was added in the centrifuge tube. The antibody-conjugated MNPs were then blocked overnight at 4 °C. The supernatant was removed in the magnetic field, and the precipitate was resuspended with 1 mL of phosphate buffered saline solution containing 3% BSA and 0.1% Tween 20 (v/v) (pH 8.5) and then stored at 4 °C.The colloidal gold with an average diameter of 30 nm was produced by reduction of gold chloride trihydrate with 1% trisodium citrate as described previously25 and immune colloidal gold (ICG) was prepared according to the method of Peng.26
2.3 Calculation of coupling rate and capture efficiency
Coupling rate is defined as the percentage fraction of the antibody bound onto the surface of the MNPs. The concentration of anti-S. enteritidis polyclonal antibody Q1 left in the supernatant was calculated by BCA assay.The BCA working reagent was prepared by mixing the solutions A, B, and C at 25![[thin space (1/6-em)]](https://www.rsc.org/images/entities/char_2009.gif) :
:![[thin space (1/6-em)]](https://www.rsc.org/images/entities/char_2009.gif) 24
24![[thin space (1/6-em)]](https://www.rsc.org/images/entities/char_2009.gif) :
:![[thin space (1/6-em)]](https://www.rsc.org/images/entities/char_2009.gif) 1 proportion. Serial dilutions from the standard concentration were prepared from the BSA and assayed alongside the unknown(s) before the concentration of each unknown is determined based on the standard curve. In brief, 150 μL of standard BSA solution and the supernatant reserved from the preparation of IMNPs was added into an ELISA well. Afterward, 150 μL of the working solution was added into the well, and the mixture was incubated at 37 °C for 2 h in dark. Optical density (OD) at 560 nm was measured using a Microplate Reader, and the result was calculated according to the standard curve drawn. Coupling rate was calculated using the following formula:
1 proportion. Serial dilutions from the standard concentration were prepared from the BSA and assayed alongside the unknown(s) before the concentration of each unknown is determined based on the standard curve. In brief, 150 μL of standard BSA solution and the supernatant reserved from the preparation of IMNPs was added into an ELISA well. Afterward, 150 μL of the working solution was added into the well, and the mixture was incubated at 37 °C for 2 h in dark. Optical density (OD) at 560 nm was measured using a Microplate Reader, and the result was calculated according to the standard curve drawn. Coupling rate was calculated using the following formula:
| Coupling rate (%) = (1 − A/A0) × 100% |
The number of S. enteritidis in the supernatant after capture was measured using the plate counting method. Capture efficiency was calculated using the following formula:
| Capture efficiency (%) = (1 – N/N0) × 100% |
2.4 Preparation of test strip
Anti-S. enteritidis polyclonal antibody Q1 (1.5 mg mL−1) and donkey anti-rabbit antibody (0.5 mg mL−1) were sprayed as test line (T line) and control line (C line) on nitrocellulose membrane, respectively. Afterward, the nitrocellulose membrane was dried at 37 °C for 2 h in a vacuum drying chamber. The sample pad was immersed in 0.1 M phosphate buffer containing 1% BSA (w/v), 0.5% Tween 20 (v/v), and 0.05% NaN3 (w/v), and the conjugate pad was immersed in 0.1 M phosphate buffer containing 0.25% Tween 20 (v/v) and 2% glucose (w/v). The sample pad and conjugate pad were dried at 37 °C overnight in a vacuum drying chamber. The prepared nitrocellulose membrane, conjugate pad, sample pad, and absorption pad were then assembled as the test strip.2.5 Optimizations of key parameters
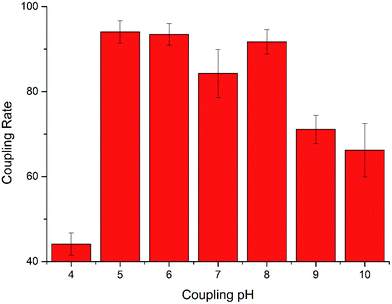
The coupling pH of 4, 5, 6, 7, 8, 9, and 10 were explored in the conjugation of MNPs and anti-S. enteritidis polyclonal antibody Q1. The coupling rate and capture efficiency were used to evaluate the influence of coupling pH on the IMNPs conjugation.Four commonly used blocking agents in the preparation of IMNPs, including 2% ethanolamine (w/v), D-glucosamine (1 mg mL−1), 3% BSA, and 3% casein sodium (w/v) were tested and evaluated in the study. A total of 4 μL of IMNPs blocked with four blocking agent solutions were added to the strips. A blocking agent was considered ideal in the presence and absence of a colored signal in the C line and the T line, respectively.
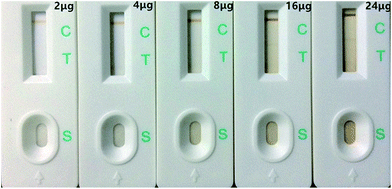
To determine the appropriate additive amount of IMNPs on the strip, different additive amounts of IMNPs (2, 4, 8, 16, and 24 μg, all in 100 μL) were tested. The mixture solution was added into the strip, and the background color and color signal of T and C lines of the strip were observed and evaluated after 15 min.
2.6 Immunological kinetics analysis of IMNPs and ICG
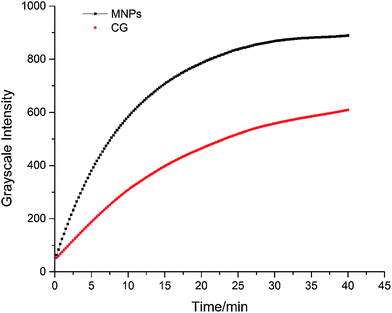
Outer membrane protein antigen was extracted (0.4 mg mL−1) from S. enteritidis and was sprayed on the C line to build a strip for running this comparison. A total of 6 μg of IMNPs or 6 μL of ICG was added to the strip. The optical signals on the T line were repeatedly read every 15 s by using an optical signal strip reader. The kinetic curves were established by plotting the signal intensity of T line against time.2.7 Sensitivity test of three ICAs
Under optimized conditions, the procedure for large-volume MNP-ICA was conducted as follows. A total of 50 μg of IMNPs was added into 8 mL of S. enteritidis-enriched culture broth at room temperature for 20 min. After magnetic separation, the precipitate was resuspended in 625 μL of Luria-Bertani broth (8 μg IMNPs per 100 μL) containing 0.3% BSA (w/v) and 0.01% Tween 20 (v/v), and 100 μL of the resuspended solution was applied to the test strip directly without elution step. After 10 min, the results were read with the naked eye.For comparison, the CG-ICA and MNP-ICA were developed and optimized according to previous work.19,27 The procedure of CG-ICA and MNP-ICA were conducted as follows. A total of 8 μL of ICG or 8 μg of IMNPs was added in 100 μL of a series of S. enteritidis dilutions (1.95 × 10³ to 1.95 × 10⁸ CFU mL−1), and 100 μL of the mixture was transferred into the test strip. After 15 min, the results were read with the naked eye.
2.8 Specificity test
S. enteritidis at a concentration of 106 CFU mL−1 and nine non-S. enteritidis strains at a concentration of 106 CFU mL−1 were tested to evaluate the specificity of the proposed method.2.9 Detection of S. enteritidis in food sample
Low fat milk (3% milk fat) samples were spiked with diluted cultures of S. enteritidis with final concentrations of 1.95 × 10⁸, 1.95 × 10⁷, 1.95 × 10⁶, 1.95 × 10⁵, 1.95 × 10⁴, and 1.95 × 10³ CFU mL−1. Large-volume MNP-ICA was applied in this test and the results were obtained after 15 min (Fig. 1)3 Results and discussion
3.1 Effects of coupling pH on IMNPs
The coupling pH is a key parameter in the conjugation of MNPs and antibody. At different pH conditions, the exposed domain that reacts with MNPs and the activity of antibody are both affected.28 As shown in Fig. 2 and Table 1, as pH decreased from 10 to 5, both coupling rate and capture efficiency seemed to be on a slight upward trend. The amino groups on the antibody are hypothesized as more likely to be positively charged in an acidic environment. Therefore, the conjugation between MNPs and antibody seemed to be easier at more acidic environments. However, when the pH was too low (pH = 4), the active esters tended to be more stable, that is, most parts of the ester group on the surface of MNPs become inactive, and MNPs and antibody became hard to conjugate. At pH 5, both the coupling rate and capture efficiency reached their highest value. Thus, pH 5 was selected as the appropriate coupling pH for the conjugation.| Coupling pH | 4 | 5 | 6 | 7 | 8 | 9 | 10 |
| Capture efficiency (%) | 23.8 ± 4.8 | 99.3 ± 0.2 | 97.6 ± 0.6 | 95.9 ± 1.0 | 96.3 ± 1.2 | 96.1 ± 1.2 | 92.2 ± 0.5 |
3.2 Effects of blocking agent on IMNPs
Blocking is an important step in the process of IMNPs preparation. An ideal blocking agent can encapsulate IMNPs to prevent them from binding to other substances in the chromatographic system and can quench the active group that was not consumed by the antibody in the coupling process.Four different commonly used blocking agents (ethanolamine, D-glucosamine, BSA, and casein sodium) were compared. In the absence of a blocking agent, the IMNPs were easily bound to the antibodies on the T line because of many unquenched active sites (Fig. 3E). Moreover, blocking IMNPs by ethanolamine and D-glucosamine also showed undesirable T line on the strips (Fig. 3A and B), which was hypothesized to be due to a number of hydroxyl and other charged groups introduced, which brought about nonspecific binding even though the active ester was quenched. When IMNPs were blocked with casein sodium solution (Fig. 3D), weak color signal on both T line and C line appeared, which was speculated to be due to immune reaction inhibition by casein sodium. However, when IMNPs were blocked by BSA solution, the color signal appeared in C line without nonspecific binding on the T line as shown in Fig. 3C. Thus, BSA was chosen as the optimal blocking agent.
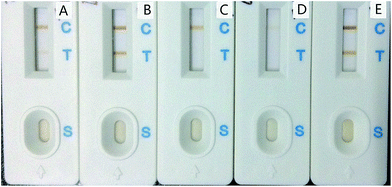 | ||
| Fig. 3 Comparison of different blockers. (A) 2% Ethanolamine (v/v); (B) 1 mg mL−1 D-glucosamine; (C) 3% BSA (w/v); (D) 3% casein sodium (w/v); (E) without blocking. | ||
3.3 Effects of additive amount of IMNPs
When IMNPs were added to the test in excess, portions of IMNPs were deposited on the nitrocellulose membrane, resulting in a brown background color on the membrane. By contrast, when the IMNPs were added in too low amounts, the colored signal in the C line was weak and the detection sensitivity also decreased. To have an appropriate signal color and a weak background color, the additive amounts of IMNPs should be explored.As shown in Fig. 4, the colored signal on the C line increased in intensity as the additive amount of IMNPs was increased. However, excessive IMNPs have obvious impact on background color on the whole nitrocellulose membrane. As 16 μg and 24 μg of IMNPs were added, a brown background on the strip was obvious.
An additive amount of 8 μg permitted a strong colored signal on the C line and an absence of background color on the nitrocellulose membrane. Thus, 8 μg of IMNPs was selected as the appropriate additive amount.
3.4 Immunological kinetics analysis of IMNPs and ICG
To further explore the reasons behind the improvement in sensitivity, the dynamic properties between immunochromatography of MNPs and CG were compared. As shown in Fig. 5, using the same antibody-antigen system, the peak grayscale intensity of MNPs (917.4) was about 1.5 times higher than that of CG (607.4). Moreover, the antibody concentration used for MNP-ICA was 0.36 μg, whereas that for the CG-ICA was 3.6 μg. Compared with CG, 1.5 times signal intensity was produced by MNPs, with a 1/10 antibody consumption. As label in immunochromatographic assay, MNPs produce stronger signal intensity, demonstrating higher sensitivity than the traditional and widely used CG. Moreover, the consumption of antibody could be greatly reduced when MNPs are used as the label, indicating its industrial and economical value.3.5 Results of sensitivity test of three ICAs
As shown in Fig. 6, the sensitivity of traditional CG-ICA and MNP-ICA were 1.95 × 10⁸ and 1.95 × 10⁶, respectively. However, when the concentration of S. enteritidis was at 1.95 × 10⁵ CFU mL−1, a visible T line was produced in the proposed large-volume MNP-ICA.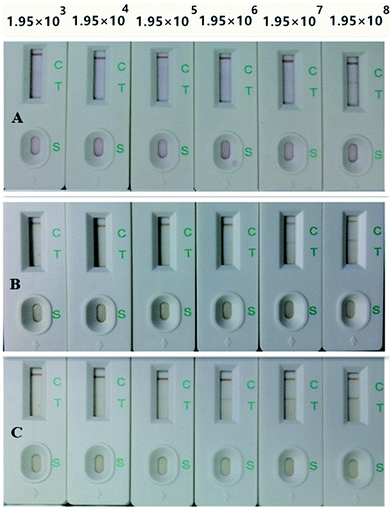 | ||
| Fig. 6 Sensitivity of CG-ICA (A), MNP-ICA (B), and large-volume MNP-ICA (C) for detection of S. enteritidis. | ||
Using the same antibody, the sensitivity of large-volume MNP-ICA was 10 times higher than that of MNP-ICA. In large-volume MNP-ICA, 50 μg of IMNPs were added into 8 mL of sample solution. After magnetic separation, the sample was concentrated by 12.8 times. An MNP-based pre-concentrated immunochromatographic assay offers improved sensitivity due to the concentration of sample, as demonstrated by the similarity between the rate of sensitivity enhancement and the rate of concentration increase.
Moreover, compared with traditional CG-ICA, the sensitivity of the proposed large-volume MNP-ICA was 1000 times higher using the same antibody. We presume that the diameter of MNPs was larger than that of CG, thus the flow rate of IMNPs was slower than that of ICG, leading to a more sufficient immune reaction on T line.
Some parameters of the three ICAs are listed in Table 2. From the comparison between CG-ICA and MNP-ICA, the antibody consumption per test of MNP-ICA was only 1/10 of CG-ICA, whereas the sensitivity was 100 times higher than that of the latter, proving that as an optical label, IMNPs not only improved the detection sensitivity but also diminished antibody consumption.
| Methods | Additive amount of IMNPs/ICG | Antibody consumption | Sample volume | Concentration ratio | Sensitivity |
|---|---|---|---|---|---|
| CG-ICA | 8.0 μL per test | 4.8 μg per test | 100.0 μL | 1![[thin space (1/6-em)]](https://www.rsc.org/images/entities/char_2009.gif) : :![[thin space (1/6-em)]](https://www.rsc.org/images/entities/char_2009.gif) 1 1 |
1.95 × 10⁸ CFU mL−1 |
| MNP-ICA | 8.0 μg per test | 0.5 μg per test | 100.0 μL | 1![[thin space (1/6-em)]](https://www.rsc.org/images/entities/char_2009.gif) : :![[thin space (1/6-em)]](https://www.rsc.org/images/entities/char_2009.gif) 1 1 |
1.95 × 10⁶ CFU mL−1 |
| Large-volume MNP-ICA | 50.0 μg per test | 3.0 μg per test | 8.0 mL | 1![[thin space (1/6-em)]](https://www.rsc.org/images/entities/char_2009.gif) : :![[thin space (1/6-em)]](https://www.rsc.org/images/entities/char_2009.gif) 12.8 12.8 |
1.95 × 10⁵ CFU mL−1 |
Based on the unique optical and magnetic properties of MNPs, IMNPs not only improves the detection sensitivity but also offers great economic potential.
3.6 Results of specificity test
To examine the specificity of the large-volume MNP-ICA, cross-reactivity during assay development must be tested. Nine non-target strains were used to evaluate the specificity of the proposed method and no brown band appeared in the test line when each bacterium was added at concentration of 106 CFU mL−1 (Fig. S2†). This result indicated that the test strip has high specificity.3.7 Results of detection in food sample
The detection results of S. enteritidis in low fat milk was shown in Fig. S3.† 1.95 × 10⁵ CFU mL−1 of S. enteritidis in milk could be detected with large-volume MNPs-ICA by naked eye. The sensitivity of the method with the low fat milk was basically consistent with that with Luria-Bertani broth (1.95 × 10⁵ CFU mL−1). The results showed that this proposed method had little matrix effect.4 Conclusions
A pre-concentrated immunochromatographic assay was developed for the rapid and sensitive detection of S. enteritidis in a large of volume sample based on the magnetic and optical properties of MNPs. The sensitivity of large-volume MNP-ICA was 1.95 × 10⁵ CFU mL−1, which was 10 times higher than that of MNP-ICA, and 1000 times higher than that of CG-ICA.In the proposed method, the MNPs were used not only as a magnetic capturing probe to concentrate the target from a large-volume of sample but also as a colored signal label based on its optical property. No additional elution operation was required, thus target loss during elution was avoided. Furthermore, immunological kinetics comparison between MNP and CG showed that compared with CG, MNP produced much higher signal strength with less antibody consumption. MNP proved to be an ideal optical label in addition to being a sample pretreatment tool. Most importantly, the sensitivity of the proposed method was clearly improved considering the pre-concentration of a large volume of sample (8 mL).
Considering these advantages, the proposed method is worthy to be applied for both on-site and in the laboratory, and it offers an important role in the field of food safety.
Conflicts of interest
There are no conflicts to declare.Acknowledgements
This work was supported by the National Natural Science Foundation of China (no. 31772066), Young Scientist Fund of Jiangxi Province (2016BAB21418), Jiangxi Special Fund for Agro-scientific Research in the Collaborative Innovation (JXXTCX201703-1), Jiangxi Agriculture Research System (JXARS-03), and Science and Technology Program of Health and family planning commission of Jiangxi Province (20176011).Notes and references
- D. Zhu, Y. Yan, P. Lei, B. Shen, W. Cheng, H. Ju and S. Ding, Anal. Chim. Acta, 2014, 846, 44–50 CrossRef CAS PubMed.
- G. Muluneh and M. Kibret, Asian Pac. J. Trop. Dis., 2015, 5, 130–135 CrossRef.
- S. E. Majowicz, J. Musto, E. Scallan, F. J. Angulo, M. Kirk, S. J. O'Brien, T. F. Jones, A. Fazil and R. M. Hoekstra, Clin. Infect. Dis., 2010, 50, 882–889 CrossRef PubMed.
- C. H. Kuan, L. W. K. Lim, T. W. Ting, Y. Rukayadi, S. H. Ahmad, C. W. J. Wan Mohamed Radzi, T. Y. Thung, O. B. Ramzi, W. S. Chang, Y. Y. Loo, C. S. Kuan, S.-K. Yeo and S. Radu, Food Control, 2017, 80, 395–400 CrossRef.
- G. Mellon, C. Delanoe, A. L. Roux, B. Heym, O. Dubourg, P. Hardy, B. Chevallier, C. Perronne, E. Rouveix and J. Salomon, Medicine and infectious diseases, 2017, 47, 389–393 CAS.
- R. S. Hendriksen, A. R. Vieira, S. Karlsmose, D. M. Lo Fo Wong, A. B. Jensen, H. C. Wegener and F. M. Aarestrup, Foodborne Pathog. Dis., 2011, 8, 887–900 CrossRef PubMed.
- S. A. Mirhosseini, A. A. I. Fooladi, J. Amani and H. Sedighian, Braz. J. Microbiol., 2017, 48, 774–781 CrossRef PubMed.
- X. Ma, Y. Jiang, F. Jia, Y. Yu, J. Chen and Z. Wang, J. Microbiol. Methods, 2014, 98, 94–98 CrossRef CAS PubMed.
- J. Y. Hyeon and X. Deng, Food Microbiol., 2017, 63, 111–116 CrossRef CAS PubMed.
- E. Galikowska, D. Kunikowska, E. Tokarska-Pietrzak, H. Dziadziuszko, J. M. Los, P. Golec, G. Wegrzyn and M. Los, Eur. J. Clin. Microbiol. Infect. Dis., 2011, 30, 1067–1073 CrossRef CAS PubMed.
- D. Lu, G. Pang and J. Xie, Biomed. Microdevices, 2017, 19, 12 CrossRef PubMed.
- J. Chen, L. Zhang, G. C. Paoli, C. Shi, S. I. Tu and X. Shi, Int. J. Food Microbiol., 2010, 137, 168–174 CrossRef CAS PubMed.
- W. C. Mak, V. Beni and A. P. F. Turner, TrAC, Trends Anal. Chem., 2016, 79, 297–305 CrossRef CAS.
- M. Sajid, A.-N. Kawde and M. Daud, J. Saudi Chem. Soc., 2015, 19, 689–705 CrossRef.
- S. H. Paek, S. H. Lee, J. H. Cho and Y. S. Kim, Methods, 2000, 22, 53–60 CrossRef CAS PubMed.
- X. Zhang, J. Zhou, C. Zhang, D. Zhang and X. Su, RSC Adv., 2016, 6, 1279–1287 RSC.
- Q. Y. Xie, Y. H. Wu, Q. R. Xiong, H. Y. Xu, Y. H. Xiong, K. Liu, Y. Jin and W. H. Lai, Biosens. Bioelectron., 2014, 54, 262–265 CrossRef CAS PubMed.
- J. Li, H. Duan, P. Xu, X. Huang and Y. Xiong, RSC Adv., 2016, 6, 26178–26185 RSC.
- Q. Xiong, X. Cui, J. K. Saini, D. Liu, S. Shan, Y. Jin and W. Lai, Food Control, 2014, 37, 41–45 CrossRef.
- S. Shan, Z. Zhong, W. Lai, Y. Xiong, X. Cui and D. Liu, Food Control, 2014, 45, 138–142 CrossRef.
- P. M. Fratamico, F. J. Schultz and R. L. Buchanan, Food Microbiol., 1992, 9, 105–113 CrossRef.
- W.-B. Shim, J.-G. Choi, J.-Y. Kim, Z.-Y. Yang, K.-H. Lee, M.-G. Kim, S.-D. Ha, K.-S. Kim, K.-Y. Kim, C.-H. Kim, S. A. Eremin and D.-H. Chung, J. Food Prot., 2008, 71, 781–789 CrossRef CAS PubMed.
- X. Cui, Q.-R. Xiong, Y.-H. Xiong, S. Shan and W.-H. Lai, Chin. J. Anal. Chem., 2013, 41, 1812–1816 CrossRef CAS.
- Q. Li, S. Zhang, Y. Cai, Y. Yang, F. Hu, X. Liu and X. He, Int. J. Food Sci. Technol., 2017, 52, 1559–1566 CrossRef CAS.
- C. Li, W. Luo, H. Xu, Q. Zhang, H. Xu, Z. P. Aguilar, W. Lai, H. Wei and Y. Xiong, Food Control, 2013, 34, 725–732 CrossRef CAS.
- T. Peng, W.-c. Yang, W.-H. Lai, Y.-H. Xiong, H. Wei and J. Zhang, Anal. Methods, 2014, 6, 7394–7398 RSC.
- J.-Y. Wang, M.-H. Chen, Z.-C. Sheng, D.-F. Liu, S.-S. Wu and W.-H. Lai, RSC Adv., 2015, 5, 62300–62305 RSC.
- Y. Chen, Y. Xin, H. Yang, L. Zhang, Y. Zhang, X. Xia, Y. Tong and W. Wang, Int. J. Biol. Macromol., 2013, 56, 6–13 CrossRef CAS PubMed.
Footnote |
| † Electronic supplementary information (ESI) available. See DOI: 10.1039/c7ra11006e |
| This journal is © The Royal Society of Chemistry 2017 |

