 Open Access Article
Creative Commons Attribution 3.0 Unported Licence
An ionic liquid loaded magnetically confined polymeric mesoporous adsorbent for extraction of parabens from environmental and cosmetic samples†
Masrudin Md Yusoffa,
Muggundha Raoov *a,
Noorfatimah Yahayaa and
Noorashikin Md Sallehb
aIntegrative Medicine Cluster, Advanced Medical and Dental Institute (AMDI), Universiti Sains Malaysia, 13200 Bertam Kepala Batas, Penang, Malaysia. E-mail: muggundha@usm.my
bDepartment of Chemical and Process Engineering, Faculty of Engineering and Built Environment, Universiti Kebangsaan Malaysia, 43600 Bangi, Selangor Darul Ehsan, Malaysia
First published on 19th July 2017
Abstract
An ionic liquid loaded magnetically confined polymeric mesoporous adsorbent based magnetic solid phase extraction (MSPE) procedure has been developed for the extraction and pre-concentration of parabens, namely methyl paraben (MP), ethyl paraben (EP), propyl paraben (PP) and butyl paraben (BP) from environmental and cosmetic samples. In this study, hydrophilic ionic liquids (ILs), 1-butyl-3-methylimidazolium chloride (BMIM-Cl) was loaded onto the surface of MNP grafted β-cyclodextrin polymer (MNP-βCD-TDI) to form a new ionic liquid based magnetic polymeric adsorbent (IL-MNP-βCD-TDI). This is a new approach for the extraction of parabens followed by high-performance liquid chromatography with diode-array detection (HPLC-DAD). The formation of IL-MNP-βCD-TDI was characterized by FT-IR, CHN, BET, SEM, TEM, VSM and XRD techniques and compared with native MNPs and MNP-βCD-TDI. Several variables were optimized thoroughly including the types of adsorbents used, concentration of ionic liquid loaded, amount of adsorbent, extraction and desorption time, types and volumes of desorption solvent, sample pH, ionic strength, and sample volume. Under-optimized conditions, excellent linearity was achieved in the range of 0.3–500.0 μg L−1 for MP and EP, and 0.1–500.0 μg L−1 for PP and BP, with a correlation coefficient of R2 > 0.999. High sensitivity with limits of detection (LODs: 0.02 to 0.09 μg L−1) and quantification (LOQs: 0.05 to 0.28 μg L−1), and good recoveries (80.3–117.3%) were obtained with satisfactory relative standard deviations (RSDs: 1.1–14.9%). The developed material (IL-MNP-βCD-TDI) proved to be a simple and effective alternative adsorbent for the extraction of parabens from various types of environmental water samples and cosmetic products.
1. Introduction
Parabens are a class of widely used preservatives in cosmetics and health-care products. They are derived from a family of synthetic esters of p-hydroxybenzoic acid that can be easily found in shampoos, toothpastes, moisturizers, personal lubricants, make-up, pharmaceutical products and food additives. Parabens are not only found in cosmetic products but can also be found in environmental water samples.1 The wastewater from municipal and domestic health-care and cosmetic products contaminates fresh water due to the large load of contaminants, which may lead to some cross reactions.2–4 Recently, these paraben compounds have raised concerns about their safety and potential effect of emerging pollutants,5 because they are considered as endocrine disrupting chemicals (EDCs) due to their ability to affect the endocrine system.6–8In the past, methyl paraben (MP) and propyl paraben (PP) have been the most frequently used as antimicrobial preservatives9 especially in cosmetic products.10–12 According to the European Commission's (EC) Scientific Committee on Consumer Safety (SCCS), the tolerable amount of paraben that can be used in such cosmetic product is 8 g kg−1 with no single paraben that have concentration more than 4 g kg−1. Moreover, SCCS also has confirmed that the tolerable limit for smaller chains of paraben (methyl and ethyl parabens) is considered safe, but must be lower than 1.9 g kg−1 for longer chains of paraben (propyl and butyl parabens).13 Whereas, other literatures have also stated that the paraben concentrations are usually less than 0.3% in single preservative systems but may range up to 1%.14
If these types of contaminants exceed the tolerable limits, they may lead to unpredictable influences to human life because of their toxicity and widespread use in the environment.15 Thus, sample pre-treatment is crucial when dealing with complex matrices especially in environmental water samples, because parabens exist in low concentrations. The most common and widely used sample pre-treatment for the analysis of parabens in environmental water samples and cosmetic based products is solid phase extraction (SPE).16–20 SPE is a conventional alternative method compared to traditional liquid–liquid extraction (LLE) that has been applied mostly in the extraction of parabens in environmental samples and any cosmetic products due to its advantages of high recovery, short extraction time, higher absorption rate, high enrichment factor, low consumption of organic solvents, and ease of automation.21 However, by employing the SPE method, sample preparation is quite difficult and time consuming when dealing with a lot of samples especially in batch mode. Therefore, a simple and efficient sample preparation procedure is required.
In this research, the magnetic based nano-materials are used to improve the traditional SPE method. The magnetic solid phase extraction (MSPE) method has been discussed among researchers although the application of this method is still in early stages.22,23 It is also scientifically proven being able to shorten the sample preparation step and increase the enrichment process due to their rapid isolation using strong magnet.24–26 Magnetic nanoparticles (MNPs) guarantee high extraction efficiency when dealing with small sample volumes due to the large surface areas.27 However, MNPs are not only efficient in enriching the selectivity of targeted analytes, but with some modifications onto the surface of the MNPs associated with other polymeric based adsorbent, it has been shown that both properties of the MNPs and polymeric adsorbent give significant impacts in separation science.28–30
Polymeric adsorbents such as cyclodextrin polymers have become a topic of interest by some researchers especially in combining with MNPs.31–35 Cyclodextrins (CDs) are well-established series of macro cyclic oligosaccharides that are structurally related to natural products formed from degradation of starch by bacterial enzymes. Basically, CDs are composed of 6, 7, or 8 D-glucose units connected by α-1,4-glucosidic linkages which are categorized as α-CD, β-CD, γ-CD, respectively. β-CD was chosen in this research because it is inexpensive and has an ability to form solid inclusion complexes with a very wide range of solid, liquid and gaseous compounds via molecular complexation36,37 and through various kinds of interaction, i.e. van der Waals forces, hydrophobic interactions, electrostatic affinities, dipole–dipole interactions, and hydrogen bonding.38
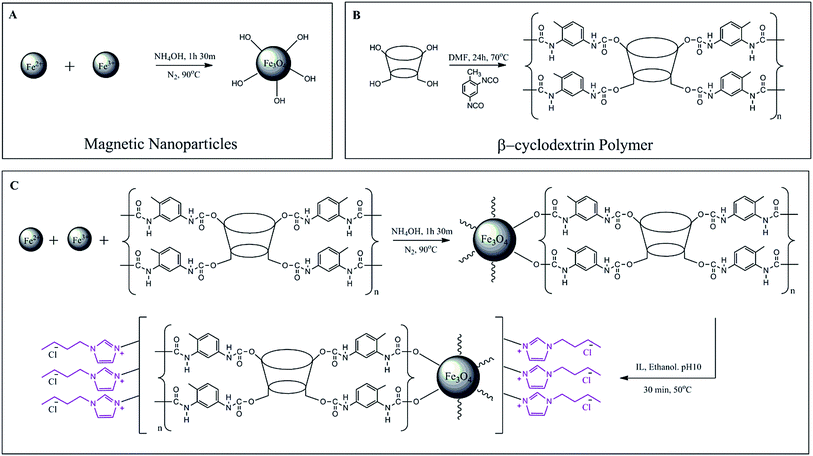
Therefore, modification on the surfaces of MNPs with cyclodextrin polymer is a crucial step because it can improve the selectivity of targeted analytes and the stability of the MNPs. Better yet, some researchers reported that the loading of ionic liquids (ILs) onto the surface of MNPs based adsorbent also showed significant results.27,39,40 ILs are a type of salt in form of liquid below 100 °C or even room temperature, known as room temperature ionic liquids (RTILs).41 Non-volatility, non-flammability, low viscosity and electrochemical stability are common and unique characteristics of ILs, giving them an advantage in various types of applications especially in extraction, separation and supramolecular materials.42,43 Owing to the properties of MNPs, β-CD polymer and ILs, some researchers reported the application of these materials is quite good in separation analysis.44–46 Hence, a new approach was employed in this work by loading the hydrophilic ILs, 1-butyl-3-methylimidazolium chloride (BMIM-Cl) onto the surface of MNPs grafted β-CD polymer (MNP-βCD-TDI) to form the new generation material (IL-MNP-βCD-TDI) as shown in Fig. 1. The developed material IL-MNP-βCD-TDI, may demonstrate an interesting phenomenon in extraction studies due to its unique properties. To the best of our knowledge, this study is the first report on application of this IL-MNP-βCD-TDI as an adsorbent in MSPE for the extraction of parabens from environmental and cosmetic samples.
2. Experimental
2.1 Reagents and materials
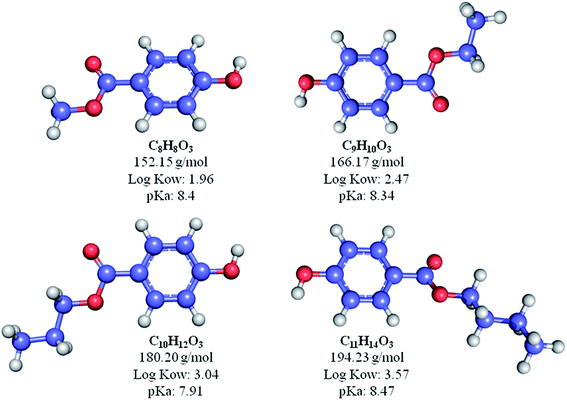
Methyl paraben (MP), ethyl paraben (EP), propyl paraben (PP), butyl paraben (BP) as shown in Fig. 2, 1-butyl-3-methylimidazolium chloride (BMIM-Cl) and toluene-2,4-diisocyanate (TDI) were purchased from Sigma Aldrich (St. Louis, MO, USA). Iron(II) chloride tetrahydrate (FeCl2·4H2O) and iron(III) chloride hexahydrate (FeCl3·6H2O) were purchased from R&M Chemicals (Essex, UK). Acetonitrile (ACN), methanol (MeOH), isopropanol (IPA) (HPLC grade, 99.7%), acetone technical grade and ammonia solution (25%) were supplied from Friendemann Schmidt (Parkwood, Australia). β-cyclodextrin (βCD, 99%) was commercially available and purchased from Acros (Hungary). Anhydrous N,N-dimethylformamide (DMF) was purchased from Merck (Kennilworth, NJ, USA). Analytical grade absolute ethanol (Denatured, 99.7%) was purchased from J. Kollin Chemicals (Midlothian, UK). The standard stock solution of parabens (1000 mg L−1) were prepared in 100 mL of methanol and stored in the dark amber reagent bottles at 4 °C to prevent degradation. The working solution was freshly prepared by dilution of the stock solution with deionized (DI) water (18.2 MΩ cm) that was generated by a Sartorius Milli-Q system (Aubagne, France).2.2 Instruments
Agilent 1200 Series HPLC from Agilent Technologies Inc. (Santa Clara, CA, USA) was used to analyze the paraben compounds. The compounds were separated using C18 column, Supelco (150 mm × 4.6 mm × 5 μm, Bellefonte, PA, USA) by isocratic condition with mobile phase composition of 50% ACN: 50% DI water, flow rate: 1.0 mL min−1, under DAD detection of 256 nm at 25 °C. pH of sample was adjusted using pH meter (OHAUS Starter 3100, Ohio, USA). The Fourier transform infrared spectroscopy (FT-IR) was carried out using Thermo Nicolet FT-IR machine with the wavenumber range between 4000 cm−1 and 400 cm−1 using the KBr technique in absorption mode with 32 scans by a germanium detector. The amounts of carbon, hydrogen and nitrogen contents were analyzed using CHN Analyzer (Perkin Elmer 2400 Series II, Massachusetts, USA). The magnetizations of the native and both modified MNPs were measured using a vibrating sample magnetometer (VSM, Lake Shore 7404 series, McCorkle Boulevard, Westerville OH). The morphology and particle size were investigated using scanning electron microscope (SEM Quanta FEG650, Oxford Instruments, Hillsboro, USA) and transmission electron microscope (TEM, FEI CM12, Hillsboro, USA). The Brunauer–Emmett–Teller (BET) surface area and porous properties of the materials were determined from the nitrogen adsorption–desorption analysis at 77 K on surface area analyzer (Quantachrome, Boynton Beach, FL, USA). X-ray diffraction (XRD, Panalytical, Almelo, Netherlands) patterns were recorded using an Empyrean X-ray Diffractometer from 2θ = 10° to 90° using Cu Kα radiation (λ = 1.5418 Å) at a scan rate of 0.02 s−1.2.3 Synthesis methods
![[thin space (1/6-em)]](https://www.rsc.org/images/entities/char_2009.gif) :
:![[thin space (1/6-em)]](https://www.rsc.org/images/entities/char_2009.gif) 2 by dissolving 0.86 g of FeCl2·4H2O and 2.34 g of FeCl3·6H2O in 40 mL of deionized water and was stirred for 30 min at 1200 rpm. 5 mL of NH4OH (25%) was added after the solution was heated to 90 °C and the reaction mixture was continued stirring for an hour. The resulting nanoparticles were then washed with deionized water five to six times to remove any unreacted chemicals. The product was isolated by the application of an external magnet and dried in a vacuum oven at 40 °C.
2 by dissolving 0.86 g of FeCl2·4H2O and 2.34 g of FeCl3·6H2O in 40 mL of deionized water and was stirred for 30 min at 1200 rpm. 5 mL of NH4OH (25%) was added after the solution was heated to 90 °C and the reaction mixture was continued stirring for an hour. The resulting nanoparticles were then washed with deionized water five to six times to remove any unreacted chemicals. The product was isolated by the application of an external magnet and dried in a vacuum oven at 40 °C.
![[thin space (1/6-em)]](https://www.rsc.org/images/entities/char_2009.gif) :
:![[thin space (1/6-em)]](https://www.rsc.org/images/entities/char_2009.gif) 2
2![[thin space (1/6-em)]](https://www.rsc.org/images/entities/char_2009.gif) :
:![[thin space (1/6-em)]](https://www.rsc.org/images/entities/char_2009.gif) 0.3 were dissolved in 40 mL of deionized water with vigorous stirring at a speed of 1200 rpm at 90 °C for 30 min. Then, 5 mL of NH4OH (25%) was added after the solution was heated to 90 °C. The reaction was continued for 1 h at 90 °C under constant stirring and inert condition. The formed nanoparticles were then washed with deionized water five to six times in order to remove any unreacted chemicals. The obtained product was isolated by the application of an external magnet and dried in a vacuum oven at 40 °C.
0.3 were dissolved in 40 mL of deionized water with vigorous stirring at a speed of 1200 rpm at 90 °C for 30 min. Then, 5 mL of NH4OH (25%) was added after the solution was heated to 90 °C. The reaction was continued for 1 h at 90 °C under constant stirring and inert condition. The formed nanoparticles were then washed with deionized water five to six times in order to remove any unreacted chemicals. The obtained product was isolated by the application of an external magnet and dried in a vacuum oven at 40 °C.2.4 Sample preparations
Water samples were collected and filtered by using 0.45 μm membrane filters and were kept in the dark condition at 4 °C. 25 mL of water sample was directly added into the vial for the extraction process. Furthermore, cream was chosen for the analysis of cosmetic products because it is one of the products that commonly used in daily routine. As for the sample preparation of cream, firstly, 2.5 mg of cream was weighted and then 1.5 mL of methanol was added to the sample. The sample was vortexed for 1 min and followed by sonication for another 5 min. After that, the sample was spiked and the total volume was made up to 25 mL (optimum volume) with deionized water and centrifuged for 15 min. The sample was further undergoing MSPE procedure as described in Section 2.5.2.5 MSPE procedure
Before extraction, 25 mg of IL-MNP-βCD-TDI was added to a 40 mL vial. Then, 25 mL of spiked water sample (pH adjusted to 7.0 with 0.01 M NaOH) was added and was shaken for 20 min. Then, IL-MNP-βCD-TDI was forced to settle down by placing the external magnet near the vial and the water was decanted and removed. The wet IL-MNP-βCD-TDI was eluted using 700 μL of ACN under shaking for 20 min. The eluate was filtered through 0.45 μm nylon membrane and transferred to auto sampler for HPLC analysis.3. Results and discussion
3.1 Characterization of the synthesized materials
| Characteristic | MNP | MNP-βCD-TDI | IL-MNP-βCD-TDI |
|---|---|---|---|
| FTIR spectra (nm) | |||
| N–H and O–H stretching | 3418 | 3389 | 3378 (imidazole) |
| Fe–O stretching vibration | 571 | 580 | 585 |
Absence of N![[double bond, length as m-dash]](https://www.rsc.org/images/entities/char_e001.gif) C C![[double bond, length as m-dash]](https://www.rsc.org/images/entities/char_e001.gif) O group O group |
— | 2270 | 2270 |
| NHCO, carbamate linkage | — | 1654, 1540 | 1663, 1540 |
| Aromatic group in TDI | — | 1601, 1449 | 1601, 1449 |
C![[double bond, length as m-dash]](https://www.rsc.org/images/entities/char_e001.gif) C and C C and C![[double bond, length as m-dash]](https://www.rsc.org/images/entities/char_e001.gif) N stretching N stretching |
— | — | 1663, 1601 |
| C–N stretching vibration | — | 869 | 875 |
![[thin space (1/6-em)]](https://www.rsc.org/images/entities/char_2009.gif) |
|||
| CHN analysis (%) | |||
| Carbon (C) | 0.23 | 18.96 | 47.75 |
| Hydrogen (H) | 0.23 | 1.92 | 5.28 |
| Nitrogen (N) | 0.05 | 3.79 | 9.32 |
![[thin space (1/6-em)]](https://www.rsc.org/images/entities/char_2009.gif) |
|||
| BET analysis | |||
| Surface area (m2 g−1) | 90.14 m2 g−1 | 54.72 m2 g−1 | 42.95 m2 g−1 |
| Pore volume (cm3 g−1) | 0.33 cm3 g−1 | 0.21 cm3 g−1 | 0.19 cm3 g−1 |
| Pore size (nm) | 14.72 nm (mesopore) | 15.49 nm (mesopore) | 18.27 nm (mesopore) |
| N2 adsorption/desorption isotherm | Type IV isotherm with H3 type hysteresis loop | Type IV isotherm with H3 type hysteresis loop | Type IV isotherm with H3 type hysteresis loop |
3.2 Optimization of MSPE condition
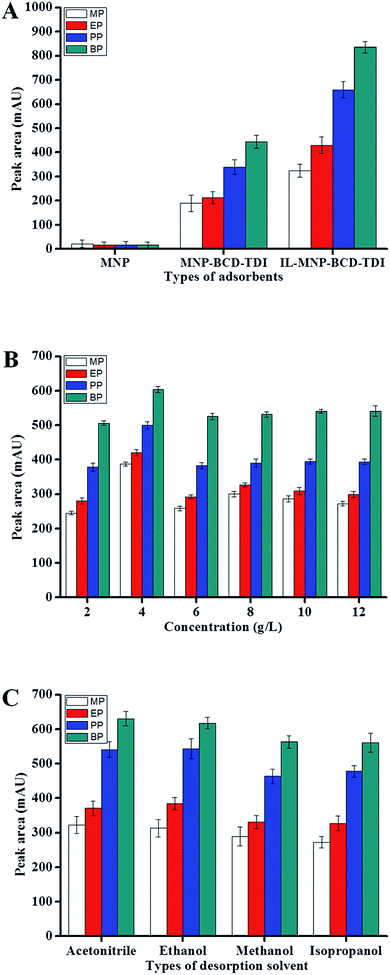
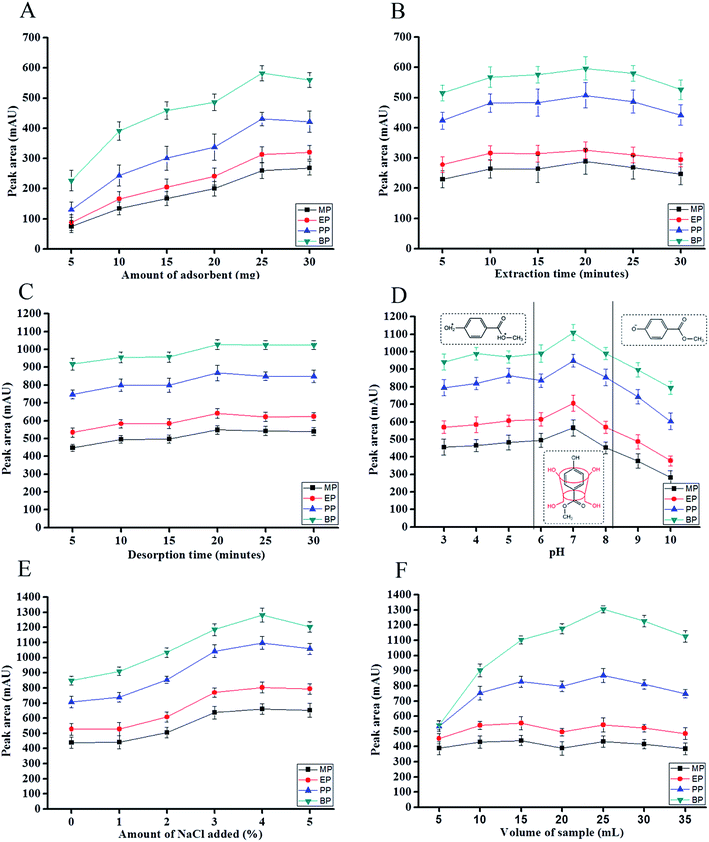
In this study, several parameters that may influence the extraction performance of IL-MNP-βCD-TDI adsorbent based MSPE for parabens were optimized, including the loading concentration of ionic liquid, types of desorption solvents, amount of adsorbent, extraction time, desorption volumes, desorption time, sample pH, ionic strength and sample volume. The optimization was carried out in triplicates with spiked parabens at 1000 μg L−1. Preliminary investigation was conducted using MSPE method, capitalizing on the newly synthesized adsorbent, IL-MNP-βCD-TDI, MNP-βCD-TDI and native MNP. It was found that high extraction efficiency of parabens was obtained using IL-MNP-βCD-TDI as adsorbent (Fig. 6A) due to unique properties of ILs and βCD. Thus, IL-MNP-βCD-TDI adsorbent was further used in this study for the extraction of the four parabens.
 | (1) |
Therefore, 700 μL was found to be sufficient to completely immerse the IL-MNP-βCD-TDI adsorbent.
Apart from that, paraben is an acidic compound with the pKa value approximately 8.3 (the pKa of parabens were shown in Fig. 2) and exists in anionic form at pH > 8,57 which means the hydroxyl (–OH) group of the paraben compounds are fully deprotonated and exists in negatively charged form. According to Angelov et al., at pH 8 to pH 10, a process of alkaline hydrolysis of the parabens took place, leading to the corresponding alcohol and p-hydroxybenzoic acid,58 and this makes the analytes are likely to have some competition with the hydroxyl anions thus that is the reason why the graph was descending up to pH 10. In addition, the more the –OH group exist, it makes the analytes become more hydrophilic, so the material itself does not absorb the anionic or hydrophilic types of analytes since the cavity of βCD polymer is hydrophobic. Thus, the only interaction took place are π–π interaction and electrostatic interaction between parabens and ILs. Eventually, inclusion complex cannot be formed with the protonated and deprotonated analytes, hence pH 7 was favourable condition to form stable inclusion complex between the cavity of βCD polymer with parabens because at this region, parabens were found to be in neutral form as illustrated in Fig. 7D.
3.3 Analytical performance of proposed MSPE method
Under-optimized MSPE conditions, four paraben compounds were separated well by using HPLC-DAD in seven minutes. The analytical performances of the synthesized materials MNP, MNP-βCD-TDI and IL-MNP-βCD-TDI based MSPE method were assessed. The linearity was carried out with at least eight concentrations levels. To make it more interesting, the analytical performances in term of limit of detections (LODs) and limit of quantifications (LOQs) were compared between MNP and MNP-βCD-TDI as shown in Table 2 and IL-MNP-βCD-TDI in Table 3. These comparisons were studied to prove that the highest performance was subjected to the new developed material, which was IL-MNP-βCD-TDI.| Analyte | MNP | MNP-βCD-TDI | ||||
|---|---|---|---|---|---|---|
| RSD (%) | LOD (μg L−1) | LOQ (μg L−1) | RSD (%) | LOD (μg L−1) | LOQ (μg L−1) | |
| a Linearity ranges: MNP between 5–500 μg L−1, in MNP-βCD-TDI between 0.5–500 μg L−1 | ||||||
| MP | 4.0 | 1.36 | 4.11 | 0.6 | 0.16 | 0.49 |
| EP | 1.1 | 1.50 | 4.55 | 2.6 | 0.12 | 0.37 |
| PP | 3.6 | 1.07 | 3.23 | 0.5 | 0.06 | 0.17 |
| BP | 2.7 | 0.82 | 2.47 | 2.7 | 0.03 | 0.10 |
| Analyte | IL-MNP-βCD-TDI | ||||||
|---|---|---|---|---|---|---|---|
| Regression equation | Linear range (μg L−1) | RSD (%) | Coefficient of determination (R2) | LOD (μg L−1) | LOQ (μg L−1) | ||
| Intra-day (n = 5) | Inter-day (n = 3) | ||||||
| MP | y = 0.6456x + 3.3362 | 0.3–500 | 2.2 | 4.4 | 0.9991 | 0.09 | 0.28 |
| EP | y = 0.8589x + 3.0866 | 0.3–500 | 3.8 | 4.5 | 0.9995 | 0.06 | 0.18 |
| PP | y = 1.3042x + 3.3774 | 0.1–500 | 3.6 | 4.9 | 0.9992 | 0.03 | 0.09 |
| BP | y = 1.6663x + 1.4998 | 0.1–500 | 3.2 | 4.4 | 0.9996 | 0.02 | 0.05 |
The IL-MNP-βCD-TDI adsorbent based MSPE method was found to be good in linear dynamic range of 0.3–500.0 μg L−1 for MP and EP, and 0.1–500.0 μg L−1 for PP and BP, with coefficient of determination (R2) ranging from 0.9991 to 0.9996, as presented in Table 3. The LODs were defined as LOD = 3.3s/m (s = the standard deviation of the blank residuals, m = the slope of calibration graph) were in the range of 0.02 to 0.09 μg L−1. While the LOQs were defined as LOQ = 10s/m and resulted in the range of 0.05 to 0.28 μg L−1. The intra-day and inter-day precisions were calculated based on three consecutive injections with five different vials (n = 5) on the same day and in three different days between two weeks period (n = 3) respectively. The relative standard deviations (RSDs) value were calculated using working solution of 10.0 μg L−1, and it was found in the ranges of 2.2% to 3.8% for intra-day and 4.4% to 4.9% for inter-day precisions. From all these analytical performances, the IL-MNP-βCD-TDI was the ideal magnetically confined adsorbent for MSPE conditions. The IL-MNP-βCD-TDI adsorbent was proven to be robust, reliable and capable of accurately quantifying the endocrine disrupting chemicals, which were parabens at trace levels.
3.4 Analysis of real samples
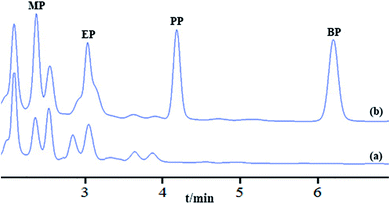
To evaluate the applicability of the developed method, three different types of environmental water samples and seven cosmetic products were analyzed under the optimum IL-MNP-βCD-TDI based MSPE conditions. Sources of water sample include were river, pond, and lake water. The analytical results were tabulated in Table 4, where the satisfactory recoveries were achieved in the range between 80.3–117.3%, with the RSDs of real samples were between 1.1–14.9%. The spiking concentrations were chosen based on low, medium, and high concentrations for recoveries, i.e. 10, 50 and 100 μg L−1 and the RSDs were performed using three different vials as triplicates (n = 3). The HPLC chromatograms of blank and spiked pond water are shown in Fig. 8. As can be seen, in the pond water, two paraben compounds were detected in blank sample as shown in Fig. 8a. In comparison, there were four significant peaks that appeared under spiking concentration of 100 μg L−1 as shown in Fig. 8b. Hence, the results showed that the developed method was successfully validated and applied to real samples and it is suitable for simultaneous extraction of paraben compounds in trace level. Seven different creams were analyzed and the detected concentrations are shown in Table 5.| Paraben | Spiked (μg L−1) | River water | Pond water | Lake water | Cream | ||||
|---|---|---|---|---|---|---|---|---|---|
| Found (μg L−1) | Recovery (%) ± RSD | Found (μg L−1) | Recovery (%) ± RSD | Found (μg L−1) | Recovery (%) ± RSD | Found (μg L−1) | Recovery (%) ± RSD | ||
| a Average value from triplicate individual vials.b Relative standard deviations (triplicate).c Not detected. | |||||||||
| MP | 0 | 22.4 | — | 1.2 | — | ND | — | ND | — |
| 10 | 10.5 | 104.8a ± 6.9b | 10.5 | 104.8 ± 5.5 | 9.4 | 93.9 ± 12.5 | 10.3 | 103.2 ± 1.1 | |
| 50 | 56.3 | 112.7 ± 6.6 | 58.6 | 117.3 ± 4.4 | 56.9 | 113.6 ± 7.1 | 52.7 | 105.5 ± 4.4 | |
| 100 | 111.6 | 111.6 ± 1.7 | 109.0 | 109.0 ± 3.5 | 91.1 | 91.1 ± 11.1 | 80.3 | 80.3 ± 11.2 | |
| EP | 0 | 1.3 | — | 0.6 | — | ND | — | ND | — |
| 10 | 11.2 | 111.9 ± 3.2 | 9.7 | 96.8 ± 5.8 | 11.5 | 114.5 ± 10.4 | 9.6 | 95.6 ± 7.4 | |
| 50 | 51.2 | 102.5 ± 9.4 | 53.7 | 107.4 ± 4.8 | 55.0 | 109.9 ± 5.9 | 49.0 | 98.1 ± 6.9 | |
| 100 | 97.5 | 97.5 ± 3.1 | 105.4 | 105.4 ± 1.2 | 84.1 | 84.1 ± 13.0 | 110.2 | 110.2 ± 7.9 | |
| PP | 0 | ND | — | NDc | — | 0.3 | — | ND | — |
| 10 | 9.5 | 94.5 ± 4.0 | 9.7 | 96.8 ± 5.8 | 8.3 | 83.0 ± 10.0 | 9.8 | 98.3 ± 4.5 | |
| 50 | 56.3 | 112.6 ± 8.9 | 58.6 | 117.2 ± 2.6 | 43.8 | 87.6 ± 14.0 | 49.7 | 99.4 ± 13.8 | |
| 100 | 83.7 | 83.7 ± 9.8 | 115.2 | 115.2 ± 1.6 | 81.8 | 81.8 ± 11.4 | 80.8 | 80.8 ± 14.9 | |
| BP | 0 | ND | — | ND | — | 0.15 | — | ND | — |
| 10 | 9.2 | 91.8 ± 8.1 | 9.8 | 97.8 ± 2.3 | 8.6 | 85.8 ± 10.4 | 8.9 | 89.4 ± 7.1 | |
| 50 | 55.9 | 111.7 ± 12.2 | 53.1 | 106.1 ± 4.6 | 45.7 | 91.3 ± 10.5 | 52.1 | 104.2 ± 10.5 | |
| 100 | 82.5 | 82.5 ± 14.9 | 106.4 | 106.4 ± 9.4 | 81.1 | 81.1 ± 11.1 | 94.0 | 94.0 ± 1.7 | |
| Samples | MP | EP | PP | BP |
|---|---|---|---|---|
| Cream 1 | ND | ND | ND | ND |
| Cream 2 | 131.9 | 26.1 | 8.3 | 3.7 |
| Cream 3 | 194.3 | ND | 149 | ND |
| Cream 4 | 139.3 | ND | 67.6 | ND |
| Cream 5 | 44.9 | ND | ND | ND |
| Cream 6 | 150.5 | ND | 50.8 | ND |
| Cream 7 | 91.8 | 21.3 | 18.2 | ND |
3.5 Comparison of the proposed method with other methods
The IL-MNP-βCD-TDI based MSPE method was compared with other previously reported methods. Some analytical methods based SPE, SPME, and MSPE methods were summaries in Table 6 for the determination of parabens. These results indicated that the proposed method has low LOD and satisfactory RSD values and served as rapid, reproducible and provide simple and efficient technique.| Extraction method | Analytical method | Analytes | Matrix | Extraction times (min) | LOD (μg L−1) | Recovery (%) | Ref. |
|---|---|---|---|---|---|---|---|
| SPE | HPLC-UV | MP, EP, PP, i-PP, BP, i-BP, BzP | Soil, sea sediments | — | 0.16–0.33 | 80–90 | 17 |
| SPE | HPLC-ED | MP, EP, PP | Shampoo | — | 400 | 93.1–104.4 | 18 |
| SPE | HPLC-C-CAD | MP, EP, PP, BP | Make-up, creams, shampoo | — | 500–2100 | 90–104 | 19 |
| SPME | UPLC-DAD | MP, EP, PP, BzP | Creams, lotions | 20 | 120–150 | 90–98 | 61 |
| MSPE | GC-MS | MP, EP, PP, BP | Swimming pool, seawater | 20 | 0.02–0.09 | 96–106 | 62 |
| MSPE | GC-PID | MP, EP, i-PP, n-PP, BP | River water, mouth wash, hand cream | 20 | 0.05–0.3 | 87–103 | 63 |
| MSPE | GC-FID | MP, PP, BP | Sunscreen cream, moisturizing cream, toothpaste | 5 | 0.2–0.9 | 85–107 | 64 |
| MSPE | HPLC-MS/MS | MP,EP, PP, BP | Seawater, river water, swimming pool | 20 | 0.26–1.35 | 87–99 | 65 |
| MSPE | HPLC-UV | MP, EP, PP | Cream, toothpaste, wastewater | 3 | 0.3–0.4 | 84.8–108.6 | 57 |
| MSPE | HPLC-DAD | MP,EP, PP, BP | River water, pond water, lake water, creams | 20 | 0.02–0.09 | 80.3–117.3 | This work |
3.6 Reusability of IL-MNP-βCD-TDI adsorbent
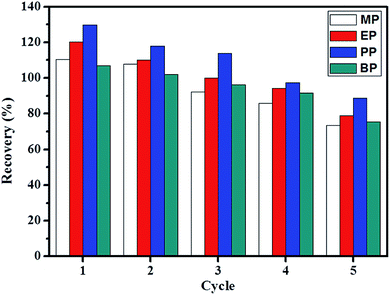
The reusability test of the synthesized material was performed to observe the stability of the adsorbent to be reused after extraction process. Fig. 9 illustrates that the IL-MNP-βCD-TDI could be reused after 5 times without a significant reduction in recoveries. The lowest recoveries in cycle 5 were in the range of 73.4% to 88.8%. The good reusability showed that the use of 2 mL of deionized water and 1 mL of ACN (vortex) was enough to be a favorable desorption solution. Thus, the synthesized material was proven to be an effective adsorbent.4. Conclusion
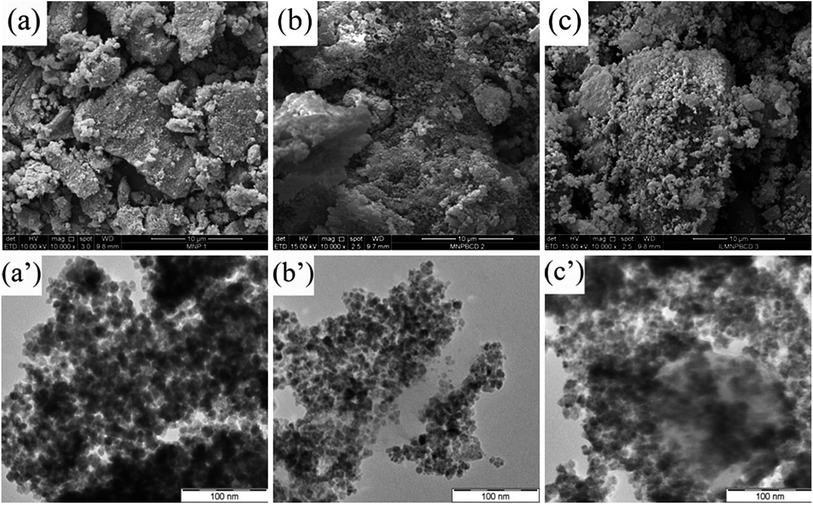
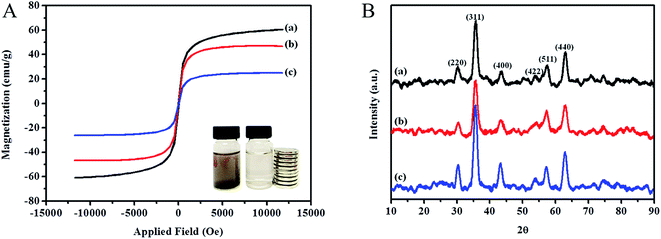
In this study, the ionic liquid loaded magnetically confined polymeric mesoporous adsorbent (IL-MNP-βCD-TDI) was successfully synthesized and characterized. The adsorbent demonstrated that the presence of ILs increased the interaction between the adsorbent and the analytes of interest. The IL-MNP-βCD-TDI offered an interesting and effective option to be used in MSPE as an adsorbent to separate paraben compounds from environmental water samples and cosmetic creams. Higher enrichments were obtained with IL-MNP-βCD-TDI adsorbent compared to native MNPs and MNP-βCD-TDI due to its unique morphologies and structures. The results showed that the proposed IL-MNP-βCD-TDI based MSPE method offers good sensitivity in term of lower LOD and LOQ values. It also offers good repeatability, reproducibility and it is simple and rapid technique to determine parabens from various matrices.Conflict of interest
All authors declare that there is no conflict of interest.Acknowledgements
The authors greatly appreciate the financial support by Universiti Sains Malaysia Research Grant (1001/CIPPT/811322) and Fundamental Research Grant Scheme (203/CIPPT/6711557) for providing the fund to complete this study. The authors also gratefully acknowledge My Brain 15 (My Master) from the Ministry of Higher Education (MOHE) for providing the scholarship to one of the authors, Masrudin bin Md Yusoff.References
- M. S. Noorashikin, M. Raoov, S. Mohamad and M. R. Abas, Int. J. Mol. Sci., 2013, 14, 24531–24548 CrossRef CAS PubMed
.
- C. Haman, X. Dauchy, C. Rosin and J.-F. Munoz, Water Res., 2015, 68, 1–11 CrossRef CAS PubMed
.
- D. Błędzka, J. Gromadzińska and W. Wąsowicz, Environ. Int., 2014, 67, 27–42 CrossRef PubMed
.
- S. Sasi, M. P. Rayaroth, D. Devadasan, U. K. Aravind and C. T. Aravindakumar, J. Hazard. Mater., 2015, 300, 202–209 CrossRef CAS PubMed
.
- J. A. Ocaña-González, M. Villar-Navarro, M. Ramos-Payán, R. Fernández-Torres and M. A. Bello-López, Anal. Chim. Acta, 2015, 858, 1–15 CrossRef PubMed
.
- P. D. Darbre and P. W. Harvey, J. Appl. Toxicol., 2008, 28, 561–578 CrossRef CAS PubMed
.
- J. Boberg, C. Taxvig, S. Christiansen and U. Hass, Reprod. Toxicol., 2010, 30, 301–312 CrossRef CAS PubMed
.
- R. E. Dodson, M. Nishioka, L. J. Standley, L. J. Perovich, J. G. Brody and R. A. Rudel, Environ. Health Perspect., 2012, 120, 935 CrossRef CAS PubMed
.
- R. Decker Jr and J. Wenninger, Cosmet. Toiletries, 1987, 102, 21–24 Search PubMed
.
- P. Berke, D. Steinberg and W. Rosen, Cosmet. Toiletries, 1982, 97, 89–93 CAS
.
- B. Gruvberger, M. Bruze and M. Tammela, Acta Derm.-Venereol., 1998, 78, 52–56 CrossRef CAS PubMed
.
- M. Soni, G. Burdock, S. Taylor and N. Greenberg, Food Chem. Toxicol., 2001, 39, 513–532 CrossRef CAS PubMed
.
- SCCS (Scientific Committee on Consumer Safety), Opinion on parabens, 14 December 2010, revision of 22 March 2011.
- M. Soni, S. L. Taylor, N. Greenberg and G. Burdock, Food Chem. Toxicol., 2002, 40, 1335–1373 CrossRef CAS PubMed
.
- I. Bazin, A. Gadal, E. Touraud and B. Roig, in Xenobiotics in the urban water cycle, Springer, 2010, pp. 245–257 Search PubMed
.
- A. Beltran, R. Marcé, P. Cormack and F. Borrull, Anal. Chim. Acta, 2010, 677, 72–78 CrossRef CAS PubMed
.
- L. Núñez, E. Turiel, A. Martin-Esteban and J. Tadeo, Talanta, 2010, 80, 1782–1788 CrossRef PubMed
.
- I. Martins, F. C. Carreira, L. S. Canaes, F. A. d. S. C. Junior, L. M. da Silva Cruz and S. Rath, Talanta, 2011, 85, 1–7 CrossRef CAS PubMed
.
- I. Márquez-Sillero, E. Aguilera-Herrador, S. Cárdenas and M. Valcárcel, J. Chromatogr. A, 2010, 1217, 1–6 CrossRef PubMed
.
- N. Ye, P. Shi, J. Li and Q. Wang, Anal. Lett., 2013, 46, 1991–2000 CrossRef CAS
.
- S. Rodriguez-Mozaz, M. J. L. de Alda and D. Barceló, J. Chromatogr. A, 2007, 1152, 97–115 CrossRef CAS PubMed
.
- K. K. Senapati, S. Roy, C. Borgohain and P. Phukan, J. Mol. Catal. A: Chem., 2012, 352, 128–134 CrossRef CAS
.
- T. D. Schladt, K. Schneider, H. Schild and W. Tremel, Dalton Trans., 2011, 40, 6315–6343 RSC
.
- S. Khan, T. G. Kazi and M. Soylak, Spectrochim. Acta, Part A, 2014, 123, 194–199 CrossRef CAS PubMed
.
- G. Giakisikli and A. N. Anthemidis, Talanta, 2013, 110, 229–235 CrossRef CAS PubMed
.
- M. Somayeh, K. Gholamreza, A. Bahareh and R. Amin, J. Braz. Chem. Soc., 2014, 25, 2039–2047 Search PubMed
.
- M. Karimi, A. M. Shabani and S. Dadfarnia, J. Braz. Chem. Soc., 2016, 27, 144–152 CAS
.
- A. Farrukh, A. Akram, A. Ghaffar, S. Hanif, A. Hamid, H. Duran and B. Yameen, ACS Appl. Mater. Interfaces, 2013, 5, 3784–3793 CAS
.
- B. Sahoo, K. S. P. Devi, R. Banerjee, T. K. Maiti, P. Pramanik and D. Dhara, ACS Appl. Mater. Interfaces, 2013, 5, 3884–3893 CAS
.
- L. Wang, M. Cole, J. Li, Y. Zheng, Y. P. Chen, K. P. Miller, A. W. Decho and B. C. Benicewicz, Polym. Chem., 2015, 6, 248–255 RSC
.
- A. Z. M. Badruddoza, G. S. S. Hazel, K. Hidajat and M. Uddin, Colloids Surf., A, 2010, 367, 85–95 CrossRef CAS
.
- A. Z. M. Badruddoza, Z. B. Z. Shawon, D. W. J. Tay, K. Hidajat and M. S. Uddin, J. Chem. Eng., 2013, 27, 69–73 Search PubMed
.
- A. Z. M. Badruddoza, Z. B. Z. Shawon, W. J. D. Tay, K. Hidajat and M. S. Uddin, Carbohydr. Polym., 2013, 91, 322–332 CrossRef CAS PubMed
.
- A. R. Kiasat and S. Nazari, J. Mol. Catal. A: Chem., 2012, 365, 80–86 CrossRef CAS
.
- L. Fan, M. Li, Z. Lv, M. Sun, C. Luo, F. Lu and H. Qiu, Colloids Surf., B, 2012, 95, 42–49 CrossRef CAS PubMed
.
- K. P. Sambasevam, S. Mohamad, N. M. Sarih and N. A. Ismail, Int. J. Mol. Sci., 2013, 14, 3671–3682 CrossRef CAS PubMed
.
- S. Mohamad, H. Surikumaran, M. Raoov, T. Marimuthu, K. Chandrasekaram and P. Subramaniam, Int. J. Mol. Sci., 2011, 12, 6329–6345 CrossRef CAS PubMed
.
- J. Zhang, X. Shen and Q. Chen, Curr. Org. Chem., 2011, 15, 74–85 CrossRef CAS
.
- G. Absalan, M. Asadi, S. Kamran, L. Sheikhian and D. M. Goltz, J. Hazard. Mater., 2011, 192, 476–484 CrossRef CAS PubMed
.
- M. Ghaemi and G. Absalan, Microchim. Acta, 2014, 181, 45–53 CrossRef CAS
.
- P. Subramaniam, S. Mohamad and Y. Alias, Int. J. Mol. Sci., 2010, 11, 3675–3685 CrossRef CAS PubMed
.
- A. B. McEwen, H. L. Ngo, K. LeCompte and J. L. Goldman, J. Electrochem. Soc., 1999, 146, 1687–1695 CrossRef CAS
.
- J. L. Anderson, J. Ding, T. Welton and D. W. Armstrong, J. Am. Chem. Soc., 2002, 124, 14247–14254 CrossRef CAS PubMed
.
- W. Ping, H. Xu and X. Zhu, Biochem. Anal. Biochem., 2013, 2013 Search PubMed
.
- W. Ping, X. Zhu and B. Wang, Anal. Lett., 2014, 47, 504–516 CrossRef CAS
.
- G. Feng, W. Ping, X. X. Qin, J. Liu and X. Zhu, Food Anal. Methods, 2015, 8, 2315–2320 CrossRef
.
- M. Raoov, S. Mohamad and M. R. Abas, J. Hazard. Mater., 2013, 263, 501–516 CrossRef CAS PubMed
.
- M. Raoov, S. Mohamad, M. R. bin Abas and H. Surikumaran, Talanta, 2014, 130, 155–163 CrossRef CAS PubMed
.
- S. Sinniah, S. Mohamad and N. S. Manan, Appl. Surf. Sci., 2015, 357, 543–550 CrossRef CAS
.
- M. Bhaskar, P. Aruna, R. J. G. Jeevan and G. Radhakrishnan, Anal. Chim. Acta, 2004, 509, 39–45 CrossRef CAS
.
- S. Bakhshaei, M. A. Kamboh, H. R. Nodeh, S. M. Zain, S. K. M. Rozi, S. Mohamad and I. A. M. Mohialdeen, RSC Adv., 2016, 6, 77047–77058 RSC
.
- K. S. Sing, Pure Appl. Chem., 1985, 57, 603–619 CrossRef CAS
.
- Z. Ma, Y. Guan and H. Liu, J. Polym. Sci., Part A: Polym. Chem., 2005, 43, 3433–3439 CrossRef CAS
.
- S. K. M. Rozi, S. Bakhshaei, N. S. A. Manan and S. Mohamad, RSC Adv., 2016, 6, 87719–87729 RSC
.
- L. Zhao and H. K. Lee, J. Chromatogr. A, 2001, 931, 95–105 CrossRef CAS PubMed
.
- M.-E. Yue, Q. Li, J. Xu and T.-F. Jiang, Food Anal. Methods, 2016, 9, 699–705 CrossRef
.
- E. Tahmasebi, Y. Yamini, A. Mehdinia and F. Rouhi, J. Sep. Sci., 2012, 35, 2256–2265 CrossRef CAS PubMed
.
- T. Angelov, A. Vlasenko and W. Tashkov, J. Liq. Chromatogr. Relat. Technol., 2007, 31, 188–197 CrossRef
.
- T. Chatzimitakos, C. Binellas, K. Maidatsi and C. Stalikas, Anal. Chim. Acta, 2016, 910, 53–59 CrossRef CAS PubMed
.
- T. D. Ho, W. T. Cole, F. Augusto and J. L. Anderson, J. Chromatogr. A, 2013, 1298, 146–151 CrossRef CAS PubMed
.
- T. Fei, H. Li, M. Ding, M. Ito and J. M. Lin, J. Sep. Sci., 2011, 34, 1599–1606 CrossRef CAS PubMed
.
- M. Alcudia-León, R. Lucena, S. Cárdenas and M. Valcárcel, Microchem. J., 2013, 110, 643–648 CrossRef
.
- M. Abbasghorbani, A. Attaran and M. Payehghadr, J. Sep. Sci., 2013, 36, 311–319 CrossRef CAS PubMed
.
- A. Mehdinia, M. Bahrami and S. Mozaffari, J. Iran. Chem. Soc., 2015, 12, 1543–1552 CrossRef CAS
.
- F. A. Casado-Carmona, M. del Carmen Alcudia-León, R. Lucena, S. Cárdenas and M. Valcárcel, Microchem. J., 2016, 128, 347–353 CrossRef CAS
.
Footnote |
| † Electronic supplementary information (ESI) available. See DOI: 10.1039/c7ra06682a |
| This journal is © The Royal Society of Chemistry 2017 |


