
 Open Access Article
 This Open Access Article is licensed under a Creative Commons Attribution-Non Commercial 3.0 Unported Licence
Flame retardancy and smoke suppression properties of flexible polyurethane foams containing an aluminum phosphate microcapsule
Hong Liu,
Bin Zhang and
Jian Han*
and
Jian Han*
Zhejiang Provincial Key Lab. of Industrial Textile Materials & Manufacturing Technology, College of Materials and Textiles, Zhejiang Sci-Tech University, Hangzhou 310018, P. R. China. E-mail: hanjian8@zstu.edu.cn
First published on 14th July 2017
Abstract
A novel aluminum phosphate (ALP) microcapsule was synthesized with the aim of enhancing the flame retardancy and smoke suppression properties of flexible polyurethane (PU) foams. Meanwhile, the ALP microcapsule was analyzed by SEM, XRD, and EDX. The ALP microcapsule was added into PU foams to prepare flame retardant PU composites which show good flame retardancy, thermal stability, synergy effect and anti-dripping performance. Meanwhile, the LOI of the PU composites was about 28.5% and a V-0 rating in UL-94 was attained in the case of 15 wt% of the flame retardant compared to 21.0% and no rating for pure PU. An SDR of the PU composites of about 16.0% was attained in the case of 20 wt% of the flame retardant compared to 29.0% for pure PU. The gaseous phase mechanism of PU composites was investigated with thermogravimetry and Py-GC-MS. SEM, EDX and FTIR were employed to investigate the chemical structure and composition of the residual char of the flame retardant PU composites after TG tests. The results indicated that the ALP microcapsule could serve as an outstanding flame retardant that operates by both chemical (condensation) and physical (cooling and blocking) mechanisms. This suggests that the ALP microcapsule may provide a promising option for a new, cost-effective, eco-friendly, yet efficient flame retardant.
1. Introduction
Polyurethane (PU) foam is one example of a highly flammable material that is used widely in consumer products (e.g., furniture, bedding, mattresses, and automotive seating).1,2 Moreover, just like flexible PU foams, it also shows the drawback of in flammability, which limits its application in these fields.3 Therefore, it is significant to improve the flame retardancy properties of flexible PU foam. Flexible PU foam is susceptible to ignition with severe dripping and its limiting oxygen index (LOI) value is as low as 20.0%. Hence, it is clear that fire retardants are an important part of polymer formulations. The conventional fire retardants are halogen-based compounds that are economical and which can enhance the fire retardancy of polymers without degrading their physical properties, such as strength. However, toxic species such as dioxins and furans, which are generated during the combustion of halogen-containing composites, could cause serious environmental contamination.4,5 Therefore, developing halogen-free, low-smoke, and environmentally-friendly fire retardant composites has become increasingly important in recent years.6,7Phosphorus-containing flame retardants and inorganic hydroxides, such as aluminum hydroxide or magnesium hydroxide are among the most widely used inorganic fire retardants at the present time due to their non-toxic and environmentally friendly properties. However, the high levels of loading (30–60 wt%) are required, leading to additional costs, processing difficulties and a decrease in physical properties of the polymers.8,9 Hence the development of new highly effective flame retardants has prompted much attention during the last decade. In recent years, little attention has been focused on the development of nanocomposites with an inorganic aluminum compound that contains phosphate, ammonium, molybdate.14 It is challenge to achieve high flame retardancy and non-dripping for PU foam simultaneously by the multilayer phase (aluminum compound that contains phosphate, ammonium, molybdate).
Microencapsulation was a mature technique and has been widely used in many fields.10 It could endow especial properties with the core materials by forming a solid shell. The capsule materials can be chosen from a great variety of natural or synthetic polymers which depend on the core materials. For example, ammonium polyphosphate has been microencapsulated by melamine-formaldehyde and polyurethane to enhance its water resistance.11,12 Microencapsulated ammonium polyphosphate with shell of epoxy resin has better compatibility in polypropylene composite.13 Inspired by the above researches, the capsule material should provide protective layer for aluminum phosphate (ALP).
In addition to aluminum phosphate (ALP) microcapsule, there are other types of microcapsule, such as red microcapsule, ammonium polyphosphate microcapsule, melamine-formaldehyde microcapsule and polyurethane microcapsule. These materials have the different structure with ALP microcapsule, and the most important shell materials are polymeric material, the core materials are inorganic compound. However, the shell material of ALP microcapsule is ammonium phosphomolybdate trihydrate, the core material is aluminum phosphate, and these compounds are inorganic compound. Varying the metal identity and composition in these compounds is expected to generate a wide range of chemical applications. One of the most interesting aspects of the ALP microcapsule is their capacity to reduce rate of combustion of the flexible PU foams, we have prepared the ALP microcapsule, and the flame retardant was compounded into PU matrix to prepare the flame-retardant PU foam. Thermal stability, flame retardancy properties and thermal degradation behavior of the composites were studied. The flame retardant mechanism based on gas and condensed actions was investigated.
2. Experimental
2.1. Materials and chemicals
The following chemicals were purchased from Aladdin reagent (Shanghai) Co., Ltd (China): aluminum phosphate (AlPO4, AR) and diethanolamine (AR). The following chemicals were purchased from Hangzhou Gaojing Fine Chemical Co., Ltd (China): phosphoric acid (H3PO4, AR), nitric acid (HNO3, AR), polyether polyol (GEP-330N, Mn = 5000 g mol−1), 2,6-toluene diisocyanate (TDI80, –NCO content, 48 wt%) and silicone oil (Y-10366). The catalyst A-33 (a dipropylene glycol solution of triethylenediamine (mass fraction of 33%)) and ammonium molybdate were obtained from Hangzhou Baoxin Chemical Co., Ltd (China). All reagents were used as received without further purification.2.2. Preparation of ALP microcapsule
The microencapsulation process used in this study was illustrated in Fig. 1(1). In a typical procedure, the aluminum phosphate (10 g) was dispersed in 45% phosphoric acid aqueous solution (10 ml) and stirred at room temperature using a magnetic stirrer for 6 h. Then, the ammonium molybdate (3 g) and nitric acid were added into the suspension, followed by pH to 1. The mixture was allowed to sit for 24 h, the obtained precipitate was filtered, washed with deionized water several times, and dried at 30 °C overnight. | ||
| Fig. 1 (1) The synthetic route of the ALP microcapsules; (2) X-ray diffraction patterns of ALP and ALP microcapsules; (3) SEM micrographs of ALP; (4) SEM micrographs of ALP microcapsules; (5) EDX analysis of ALP; (6) EDX analysis of ALP microcapsules. | ||
2.3. Preparation of the PU foams
The polyether polyol (100 g), silicone oil (1.7 g), distilled water (2.75 g), catalyst A-33 (1.6 g), diethanolamine (2.5 g), flame retardant (5.0 wt%, 10.0 wt%, 15.0 wt%, 20.0 wt%, 25.0 wt%) were mixed at room temperature for 4 s using mechanical stirring. TDI80 (38 g) was then quickly added into the suspension. After high speed stirring at 1400 rpm for about 4 s, the mixture was poured quickly into a cast mold completely covered with a lid. When frothy bubbles formed fast, the mold was put into an oven and heated for 2 h at 55 °C. The foam was then taken out from the mold. The PU foam containing ALP and ALP microcapsules were denoted as PU/ALP composite and PU/ALP microcapsule composite, respectively. For comparison, pure PU was also fabricated via a similar process.2.4. Characterization and analysis
The crystalline structure of samples were characterized by powder X-ray diffraction using a D/MAX 2550V diffractometer (Rigaku, Tokyo) with Cu Kα radiation (λ = 1.5406 Å; scanning speed: 0.02° s−1). Files from the Joint Committee on Powder Diffraction Standards (JCPDS) were used for phase identification. TG was carried out using a PYRIS 1 TGA analyzer at a linear heating rate of 20 °C min−1 under pure nitrogen. The weight of all the samples were kept within 5–10 mg. Samples in an open Pt pan were examined under an airflow rate of 6 × 10⁻⁵ m3 min−1 at a temperature ranging from room temperature to 650 °C. Energy dispersive X-ray (EDX) measurements were conducted on an energy dispersive X-ray spectrometer (EDX, INCA, PENTAFETX3, OXFORD) equipped with an SEM (JEOL JSM-5610LV), the samples were observed after gold plating. Fourier transform infrared analysis (FTIR): the FTIR spectra were recorded with MAGNA-IR 7500 spectrometer (Nicolet Instrument Company, USA) using KBr pellet. The transition mode was used and the wavenumber range was set from 4000 to 400 cm−1. LOI was measured using a HC-2 oxygen index meter (Jiangning Analysis Instrument Company China) on sheets 130 × 10 × 10 mm3. According to the standard oxygen index test ASTM D2863-2010. Horizontal and vertical burning ratings of all samples were measured on a CZF-2 instrument produced by Jiangning Analysis Instrument Factory, China, according to ASTM D3801-96 standard. Vertical burning test results were classified by burning ratings V-0, V-1, and V-2; horizontal burning test results were classified by burning ratings HB, HB40, and HB75. HB and V-0 rating indicates polymeric materials with the best flame retardancy. The smoke density (SDR) values of all samples were determined to study the smoke release of these composites using a JCY21 instrument (Jiangning Analysis Instrument Factory, China) according to ASTM D2843-1993 standard. To recognize the pyrolysis fragments of PU foam thermosets, a Shimadzu GC-MS-QP5050A gas chromatography-mass spectrometer equipped with a PYR-4A pyrolyzer was employed. The helium (He) was utilized as carrier gas for the volatile products. The injector temperature was 250 °C, the temperature of GC/MS interface was 280 °C and the cracker temperature was 550 °C.3. Results and discussion
3.1. Characterization of ALP microcapsules
The XRD patterns of ALP and ALP microcapsule were shown in Fig. 1(2). All of the observed diffraction peaks in the XRD patterns were well indexed to the ALP (JCPDS 48-0034). We can see that the two patterns all had two peaks at 2θ of about 21.5°, 29.5° corresponding to the characteristic diffraction adsorptions of ALP. However, compared with raw ALP, the spectrum of the ALP microcapsule was found to have the peak appeared at about 27.33°, 35.59°, 41.55°, 43.87°, and that a significant change has happened in crystal structure of ALP. All of the observed diffraction peaks in the XRD patterns were well indexed to the ammonium phosphomolybdate trihydrate (JCPDS 43-315). This result indicated that ALP and ammonium phosphomolybdate trihydrate had been appeared in the ALP microcapsule.The surface morphology of ALP was shown in Fig. 1(3). It can be seen that the particle shape of ALP was irregular, the raw materials were smooth with sharp edges. After phosphoric acid reacts with ammonium molybdate, the formed nano inorganic rods can be seen in Fig. 1(4). These nano rods had a uniform length of 300–400 nm and a diameter of less than 300 nm, which exhibited well-dispersed morphology. After microencapsulation, the surface of ALP microcapsule turned to relatively rough.
This can be further examined by EDX. The EDX results were shown in Fig. 1(5). For pure ALP, only the Al, P and O elements were detected, the Al, P and O atom content on the surface of ALP were 14.15 wt%, 31.64 wt%, 54.00 wt%, respectively. However, for the ALP microcapsule, not only did the peaks of the Al, P and O elements appear, but also new peaks corresponding the N and Mo were found, the Al, P and O atom content on the surface of ALP microcapsule were 8.6 wt%, 39 wt%, 32 wt%, respectively. Meanwhile, the N and Mo atom content were 6.15 wt%, 14.25 wt%, respectively. The P atom content on the surface of ALP microcapsule (39 wt%) was higher than that of ALP (31.64 wt%). The Al and O atom content on the surface of ALP (14.15 wt%, 54.00 wt%) were higher than that of ALP microcapsule (8.6 wt%, 32 wt%). To summarize, the changes of the above elemental compositions illustrated that ALP was successfully microencapsulated.
TGA and DTG curves of ALP and ALP microcapsule in nitrogen were shown in Fig. 2. For ALP, it can be found that the thermal degradation process was also consists of two main stages. The temperature of the maximum mass loss rate (Tmax) was defined as the temperature at which the samples presented the maximal mass loss rate. The solid residue was obtained from TGA curves; Tmax was obtained from DTG curves. As shown in Fig. 2(a), the first decomposition temperature at 80–120 °C and leads to the release of water, Tmax at 110 °C. The second decomposition temperature at 210–240 °C and leads to the decomposition of ALP, Tmax at 260 °C. The solid residue at 800 °C was 87 wt%. As for ALP microcapsule, it can be found that the thermal degradation process was also consists of two main stages. In the first stage, the decomposition temperature had no obvious change. But the maximum mass loss rate of ALP microcapsule was apparently higher than that of ALP. The difference could be ascribed to the formation of microcapsule. For ALP microcapsule, ammonium phosphomolybdate trihydrate as the capsule material was exposed to the external environment and had a larger surface area, leads to the release of water. Consequently, the maximum mass loss rate of ALP microcapsule was higher than ALP. For the second stage, the decomposition temperature at 500–560 °C and leads to the decomposition of ALP microcapsule, Tmax at 560 °C and this means that ALP microcapsule was more stable than ALP. At last, the residues of ALP microcapsule at 800 °C was 88.5 wt%. The improvement in thermal stability of ALP microcapsule was beneficial to its application in polymers because the compounding of fillers and polymers were usually performed by melt blending methods.
 | ||
| Fig. 2 (a) TGA and DTG curves of ALP in nitrogen atmosphere. (b) TGA and DTG curves of ALP microcapsule in nitrogen atmosphere. | ||
3.2. Thermal stability of PU composites
Thermogravimetric analysis of the PU composites was performed in nitrogen conditions. Thermal degradation behaviors of pure PU and the PU composites in nitrogen condition were presented in Fig. 3. For PU composites, it can be found that the thermal degradation process was also consists of one main stages. The temperature of the maximum mass loss rate (Tmax) was defined as the temperature at which the samples presented the maximal mass loss rate. The first mass loss was attributed to the degradation of hard segments and soft segments (polyether polyol group). In this stage, there were many kinds of gases released, such as carbon monoxide, carbon dioxide, formaldehyde, and so on.15,16 The first decomposition temperature of pure PU at 240–420 °C, Tmax at 357 °C. The solid residue at 800 °C was 0.1 wt%. As for ALP, it was decomposed to water at above 100 °C, and they further degenerated to phosphorus oxide and aluminum oxide. These products and ALP itself could absorb heat. Moreover, ALP dehydrated to coke residue which covered the PU substrate, and this decreasing the thermal conductivity. So it can be seen in Fig. 3, the first decomposition temperature of PU/10% ALP composites at 250–411 °C, Tmax at 371 °C. The solid residue at 800 °C was 21.36 wt%. ALP microcapsule can strengthen the dense structure of char, which will release water and ammonia easily at higher temperature and form phosphorus oxide and aluminium oxide to promote the formation of charred layers in the PU foam more effectively.17,18 So it can be seen in Fig. 3, the first decomposition temperature of PU/10% ALP microcapsule composites at 250–409 °C, Tmax at 381 °C. The solid residue at 800 °C was 31.5 wt%, indicating that it had good charring capacity under high temperature. Meanwhile, effect of ALP microcapsule on the thermal degradation behavior of PU composites was both evident.19 | ||
| Fig. 3 TG curves of PU composites in nitrogen atmosphere. | ||
3.3. Flammability behavior of the PU composites and the mechanism consideration
Underwriters Laboratory (UL-94) and limited oxygen index (LOI) tests were two of the most widely used tests to characterize the fire performance of polymer composites. The LOI test was one of the most important screening and quality control methods used in the plastics industry.20 The UL-94 tests, developed by the Underwriters Laboratories, was the most common procedure to check the regulatory compliance of plastic materials for parts in devices and appliances. The results of LOI and UL-94 tests for PU composites were showed in Fig. 4(a). Neat PU was an easily flammable polymeric material, and its LOI value was only 21.0%. For PU composites in which the content of ALP was 5%, 10%, 15%, 20%, 25%, the LOI value showed an increase and reached to 22%, 24%, 24.9%, 27.5%, 28.5%, respectively. In UL-94 test, neat PU, PU/5% ALP, PU/10% ALP and PU/15% ALP had no rating, and accompanied by heavy melt dripping during the combustion process. While for PU/20% ALP and PU/25% ALP, the V-0 rating was totally achieved, the dripping phenomenon was totally existed. For PU/20% ALP microcapsule composites, the LOI value increases to 29.5%, indicating that ALP microcapsule had an influence on the flame retardation of PU. For PU composites in which the content of ALP microcapsule was 5%, 10%, 15%, 20%, 25%, the LOI value showed an remarkable increase and reached to 25%, 27%, 28.5%, 29.5%, 33%, respectively. The dripping phenomenon was totally eliminated. Meanwhile, the V-0 rating was achieved. Obviously, the incorporation of ALP microcapsule not only promoted the UL-94 rating of PU composite from no rating to V-0 rating, but also decreased the amount of flame retardant in the case of fulfilling the requirement of V-0 rating. As a result, it can be concluded that the charring of ALP microcapsule played a very important role in flame retarding PU. | ||
| Fig. 4 (a) LOI and UL-94 results of PU composites. (b) SDR results of PU composites. | ||
The results of SDR tests for PU composites were showed in Fig. 4(b). Neat PU was an easily produce black and toxic smoke, and its SDR value was only 29.0%. For PU composites in which the content of ALP was 5%, 10%, 15%, 20%, 25%, the SDR value showed an decrease and reaches to 27.5%, 27.0%, 26.5%, 24.5%, 23.5%, respectively. For PU/20% ALP microcapsule composites, the SDR value decreases to 16.0%, indicating that ALP microcapsule had an influence on the flame retardation of PU. For PU composites in which the content of ALP microcapsule was 5%, 10%, 15%, 20%, 25%, the SDR value showed an remarkable decrease and reached to 26.0%, 21.0%, 17.0%, 16.0%, 15.5%, respectively. Obviously, the incorporation of ALP microcapsule not only promoted the fire resistance of PU composite, but also decreased the smoke density during the combustion process. As a result, it can be concluded that the charring of ALP microcapsule played a very important role in flame-retardant PU.
The residual length data of horizontal burning was shown in Fig. 5(a). It can be seen that the residual length of horizontal burning increased with an increase of the content of ALP and ALP microcapsule. When the content of ALP and ALP microcapsule were 25%, PU/ALP and PU/ALP microcapsule composites obtained a HB rating, the residual length of PU/ALP microcapsule composite was higher than that of PU/ALP composite. When the content of ALP microcapsule were more than 15%, PU/ALP microcapsule composite can maintain the residual length of composites at 24.9 cm. From Fig. 5(b), the residual length of vertical burning showed a sharply increase with the increase of the content of ALP microcapsule, when the content of ALP microcapsule were more than 20%, PU/ALP microcapsule composite can maintain the residual length of composites at 24.5 cm. The residual length of PU/ALP microcapsule composite was higher than that of PU/ALP composite, PU/ALP composites not obtained a V-0 rating.
 | ||
| Fig. 5 Comparison of residual length curves of PU composites: (a) horizontal burning; (b) vertical burning. | ||
Fig. 6(a and b) showed the digital photos of horizontal burning and vertical burning residue of PU composites, respectively. Neat PU, PU/5% composite, PU/15% composite had been burned out and large amounts of melt droplet, igniting off fat cotton. PU/15% microcapsule composite and PU/25% microcapsule composite immediately self-extinguish after leaving the fire, they were completely maintained the initial shape, indicating excellent flame retardancy property. In addition, the detailed data for all composites were also given in Table 1. It can be seen that PU/ALP microcapsule composite can be self-extinguish and resistance of melt drip. Moreover, based upon horizontal burning results, PU/15% ALP microcapsule composite, PU/25% ALP composite and PU/25% ALP microcapsule composite can obtain a HB rating, and PU/5% ALP composite, PU/15% ALP composite and PU/5% ALP microcapsule composite can not obtain a HB rating. Based upon vertical burning results, PU/15% ALP microcapsule composite, PU/25% ALP composite and PU/25% ALP microcapsule composite can obtain a V-0 rating, and PU/5% ALP composite, PU/15% ALP composite and PU/5% ALP microcapsule composite can not obtain a V-0 rating. Therefore, ALP microcapsule can effectively enhanced the flame retardancy of PU composites compared with neat PU foam. The flame retardancy, self-extinguish and resistance of melt drip properties of the PU/ALP microcapsule composite was higher than PU/ALP composite.
 | ||
| Fig. 6 Digital photos of PU composites after burning 10 s: (a) horizontal burning; (b) vertical burning. | ||
| Samples code | Dripping | Self-extinguish time/s | Horizontal burning rating | Vertical burning rating |
|---|---|---|---|---|
| Neat PU | Very intense | Burn out | No rating | V-2 |
| PU/5% ALP composites | Very intense | Burn out | No rating | V-2 |
| PU/15% ALP composites | Very intense | 9 | No rating | V-2 |
| PU/25% ALP composites | Very intense | 4 | HB | V-0 |
| PU/5% ALP microcapsule composites | No dripping | 4 | No rating | V-1 |
| PU/15% ALP microcapsule composites | No dripping | 2 | HB | V-0 |
| PU/25% ALP microcapsule composites | No dripping | 1 | HB | V-0 |
In order to further measure the quality of the residues obtained after LOI test, SEM measurement was performed. As shown in Fig. 7, the char residue of pure PU was continuous, but some big holes locate in the residue, which might be formed due to the permeating of gases resulting from the decomposition of PU. The char residue of PU/10% ALP composite was like a network with continuous, which was compact. However, the residue char of PU/10% ALP microcapsule composites was not only continuous, but also very compact, which can provide a shielding effect for the materials underneath from the radiant heat source, oxygen, and combustible gases.21 Obviously, both PU/ALP microcapsule composites and PU/ALP composites have better barrier than pure PU, which must be the leading reason for improving flame retardancy. SEM results directly confirm that the ALP microcapsule had an influence on the quality of the residue formed after the combustion process, consequently affected the flame retardancy of PU matrix. To further confirm the effect of condensed phase in the inner layer of the residue on the flame retardancy of PU composites, the composition of the inner residues obtained in LOI test was detected using EDX. The EDX results were presented in Fig. 8. For pure PU, only the carbon (C), oxygen (O) and nitrogen (N) were detected. However, for the PU/10% ALP composites and PU/10% ALP microcapsule composites, not only did the peaks of the C, O and N appear, but also new peaks corresponding the aluminum (Al) was found, indicating that some matters containing the Al remained in the residues after incorporating the ALP microcapsule and ALP. Generally, the matters containing the Al have good contribution to the flame retardancy of PU. EDX results further demonstrated that the condensed phase formed during the combustion process might play an important role in flame-retardant PU through ALP microcapsule.
 | ||
| Fig. 7 (a) Digital photos and (b) SEM images of the residual chars after LOI test. | ||
 | ||
| Fig. 8 EDX analysis of the residual chars of: (1) pure PU, (2) PU/10% ALP composites, (3) PU/10% ALP microcapsule composites. | ||
To illuminate the effect of the charring of ALP microcapsule on the flame-retardant efficiency of ALP, the Py-GC/MS test was performed for pure PU, PU/10% ALP microcapsule composites and PU/10% ALP composites, and the results were shown in Fig. 9 and Table 2. For pure PU, more than nine kinds of pyrolysis products were detected, in which pyrazine, ethylbenzene, 2-ethylpyrazine, 3-ethylpyrrole, 2,6-diethylpyrazine, N-(1-ethyl-3-piperidyl)-cyclohexane-1-carboxamide, 3,4-dimethoxytoluene, geraniol and 4,4′-methylene-phenyl isocyanate-phenyl carbamate, corresponding to peaks (1), (2), (3), (4), (5), (6), (7), (8) and (9), respectively,22–24 were the major components. The abundant pyrazine derivatives make a great contribution to the generation of sufficient aromatic structures. Generally, the aromatic structures play an important role in forming a stable char layer.25 For PU/10% ALP composites, more than five kinds of pyrolysis products were detected, in which pyrazine, ethylbenzene, 2-ethylpyrazine, 3-ethylpyrrole, 2,6-diethylpyrazine, corresponding to peaks (1), (2), (3), (4) and (5), respectively, were the major components. When PU/10% ALP microcapsule composites was heated up to 550 °C, some small molecules like NH3 and H2O were produced, and some cross-linked structures like polyphosphoric acid etc. were also generated. However, the detection limit of the instrument was 30 (m/z ≥ 30), and the only four kinds of major components were detected, in which pyrazine, ethylbenzene, 2-ethylpyrazine, 3-ethylpyrrole, corresponding to the peaks (1), (2), (3) and (4), respectively. Therefore, it can be speculated that some kind of chemical interaction between ALP microcapsule and PU occurred, which promoted the formation of aromatic structures. For the aromatic process, the dehydrogenation and catalysis effect of ALP microcapsule should play an important role. During the process, the small molecular fragments of the decomposition products of ALP microcapsule might rearrange and cyclize, then led to the formation of aromatic structures.26 Moreover, the (5), (6), (7), (8) and (9) peaks were disappeared, indicating more piperazine rings might be retained in the condensed phase as the original form, or transformed into aromatic structures that were more stable, enriching the components of the residue.
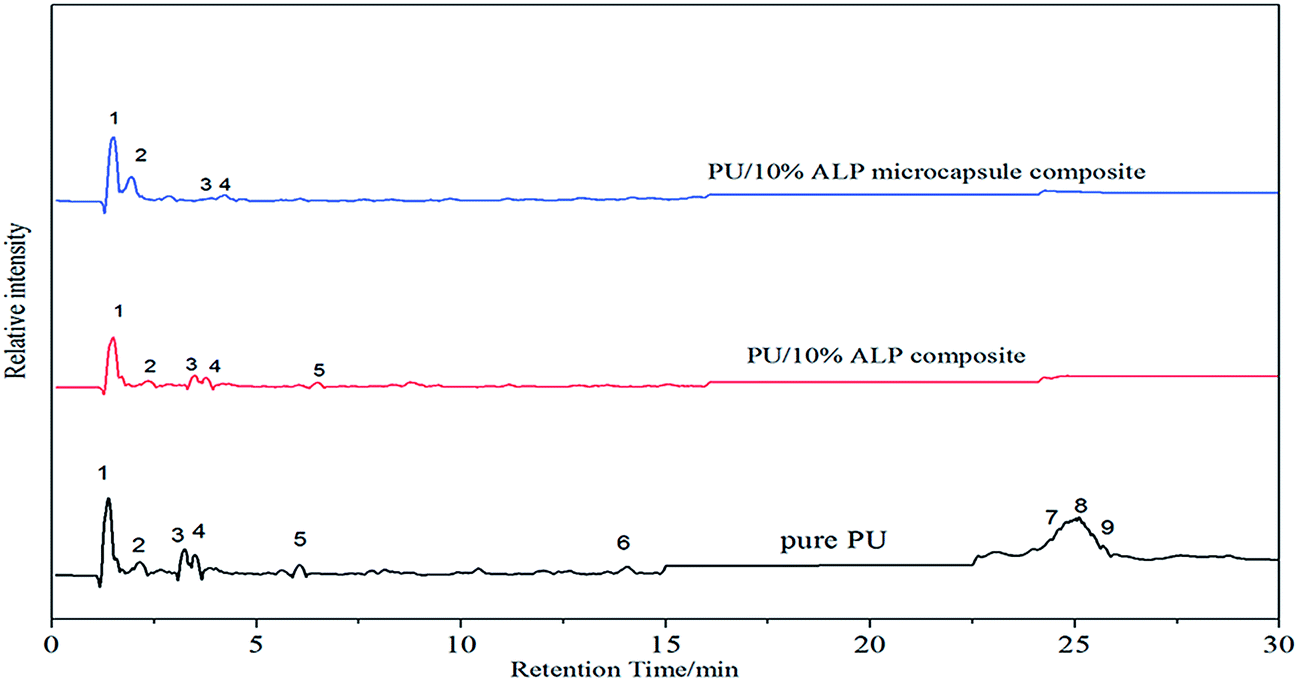 | ||
| Fig. 9 The pyrograms of PU composites. | ||
| No. | Retention time/min | Compounds |
|---|---|---|
| 1 | 1.18 | Pyrazine |
| 2 | 2.42 | Ethylbenzene |
| 3 | 3.77 | 2-Ethylpyrazine |
| 4 | 4.07 | 3-Ethylpyrrole |
| 5 | 7.91 | 2,6-Diethylpyrazine |
| 6 | 14.07 | N-(1-Ethyl-3-piperidyl)-cyclohexane-1-carboxamide |
| 7 | 24.497 | 3,4-Dimethoxytoluene |
| 8 | 25.195 | Geraniol |
| 9 | 27.16 | 4,4′-Methylene-phenyl isocyanate-phenyl carbamate |
To further illuminate the charring process of PU composites and its contribution in flame-retardant PU, and the condensed phases were investigated by FTIR. Fig. 10 was the FTIR spectra of char residues left by the burning of the PU composites. It can be observed that the peak at 3439 cm−1 belongs to –OH group, and the absorption peak observed at 2928 cm−1, 2842 cm−1 could be assigned to CH3, CH2 group, respectively. The peak at 1624–1637 cm−1 corresponds to C![[double bond, length as m-dash]](https://www.rsc.org/images/entities/char_e001.gif) C, the peak at 732 cm−1 corresponds to Al–O, the peak at 1720 cm−1 corresponds to CO, the peak at 1236 cm−1 corresponds to CN.21−25 For neat PU, the peak at 3439 cm−1 corresponding to OH group, –CH3, –CH2 and CC were observed in the neat PU. The peaks at 1236 cm−1 was observed for the residue, indicating that CN bond existed in the residue. For PU/10% ALP composites, the peak corresponding the –OH, CO, CC, Al–O bond still exists, illustrating that the stable Al–O structures should be one kind of important component in the char residue. Meanwhile, the absorbing peak at 1624 cm−1 becomes wider, indicating the generation of structures containing CC bond. According to the results presented above, it was concluded that the existence of CO, Al–O, CN and CC structures in the residue after the decomposition process should be the leading reason for the excellent charring capacity of flame-retardant PU composites. As for PU/10% ALP microcapsule composites, the peaks at 3439 cm−1 and 1624 cm−1 always exist in the FTIR curves of the residue, which was the same as those in the residue of PU/10% ALP composites. The compact and continuous char layer consisting of –OH, CO, Al–O, CC and CN structures resulted in the better flame retardancy of PU/10% ALP microcapsule composites than that of neat PU.
C, the peak at 732 cm−1 corresponds to Al–O, the peak at 1720 cm−1 corresponds to CO, the peak at 1236 cm−1 corresponds to CN.21−25 For neat PU, the peak at 3439 cm−1 corresponding to OH group, –CH3, –CH2 and CC were observed in the neat PU. The peaks at 1236 cm−1 was observed for the residue, indicating that CN bond existed in the residue. For PU/10% ALP composites, the peak corresponding the –OH, CO, CC, Al–O bond still exists, illustrating that the stable Al–O structures should be one kind of important component in the char residue. Meanwhile, the absorbing peak at 1624 cm−1 becomes wider, indicating the generation of structures containing CC bond. According to the results presented above, it was concluded that the existence of CO, Al–O, CN and CC structures in the residue after the decomposition process should be the leading reason for the excellent charring capacity of flame-retardant PU composites. As for PU/10% ALP microcapsule composites, the peaks at 3439 cm−1 and 1624 cm−1 always exist in the FTIR curves of the residue, which was the same as those in the residue of PU/10% ALP composites. The compact and continuous char layer consisting of –OH, CO, Al–O, CC and CN structures resulted in the better flame retardancy of PU/10% ALP microcapsule composites than that of neat PU.
 | ||
| Fig. 10 FTIR spectra of the residues for the PU composites after LOI test. | ||
The FTIR spectrum curves of the residues of PU composites were presented in Fig. 11. The heating temperature range of the samples was 200–400 °C, the heating rate was 20 K min−1. It could be seen from the FTIR spectra of PU/ALP microcapsule composite in Fig. 11(a and b), when the temperature rose up to 200 °C, the peak locating at 1750 cm−1 was attributed to the carbonyl group (CO) in the PU soft segment. The absorption peak locating at 2950 cm−1 corresponds to the flexural vibration of C–H structure. The absorption peak locating at 3700 cm−1 corresponds to the flexural vibration of O–H in H2O appeared. At a temperature of 300 °C, the absorption peak locating at 1622 cm−1 indicated the existence of the CC structure and some aromatic compounds were released during the thermal degradation of PU at low wavenumber. From 400 °C, the characteristic absorption peak locating at 1250 cm−1 could be attributed to the stretching vibration of the C–O structure.
 | ||
| Fig. 11 FTIR spectra of the residues of PU/5% ALP microcapsule composite (a), PU/25% ALP microcapsule composite (b) and the heating temperature range of the samples was 200–400 °C. | ||
It can be seen from the FTIR spectrum of the residues of PU/5% ALP microcapsule composite in Fig. 11(a) that the characteristic absorption peak of CO absorption peaks of locating at 1750 cm−1 were presented at about 200 °C. With the increase of the temperature, the absorption peak intensity of CO disappeared gradually. When the temperature rose up to 350 °C, the absorption peak of CO disappeared. The C–H absorption peak locating at 2950 cm−1 appeared at about 200 °C and 250 °C, the C–H absorption peak at 250 °C was a little higher than that at 200 °C, with the increase of the temperature, the absorption peak intensity of C–H disappeared gradually. When the temperature rose up to 400 °C, the absorption peak of C–H disappeared. While the absorption peak of O–H in H2O locating at 3700 cm−1 appeared at lower temperature. With the increase of the temperature, the absorption peak intensity of O–H increased gradually, reached the maximum at about 400 °C. With the increase of the temperature, the absorption peak intensity of CC increased gradually, reached the maximum at about 400 °C. The aromatic compounds and the C–O characteristic peak locating at 1250 cm−1 increased gradually, reached the maximum at about 400 °C.
It can be seen from the FTIR spectrum of the residues of PU/25% ALP microcapsule composite in Fig. 11(b) that the characteristic absorption peak of CO absorption peaks of locating at 1750 cm−1 were presented. With the increase of the temperature, the absorption peak intensity of CO decreased gradually. When the temperature rose up to 400 °C, the absorption peak of CO disappeared. With the increase of the temperature, the absorption peak intensity of C–H decreased gradually, reached the maximum at about 200 °C, and then began to increased gradually. While the absorption peak of O–H in H2O locating at 3700 cm−1 appeared at lower temperature. With the increase of the temperature, the absorption peak intensity of O–H increased gradually, reached the maximum at about 350 °C. With the increase of the temperature, the absorption peak intensity of CC increased gradually, reached the maximum at about 350 °C, and then began to decline gradually. The aromatic compounds and the C–O characteristic peak locating at 1250 cm−1 increased obviously with the increase of the temperature, reached the maximum at about 400 °C.
It can be easily concluded that the absorption peaks of C–H appeared at higher temperature in the PU/ALP microcapsule composite because the char formation prevents the thermal decomposition of polymers, as a result the LOI was higher than that of neat PU. And with help of the carbon layer, which can work as physical barrier to inhibit the heat and mass transfer and pyrolysis of polymer. At the same time, due to hindrance of the compact char layers, more aluminum-containing pyrolysis products of ALP microcapsule were left in condensed phase resulting in denser and larger amount of char residue.27–29 After the PU foam was ignited, ALP microcapsule firstly decomposed to generate NH3 and H2O before aluminum phosphate and catalyze the pyrolysis of PU, and then ALP began to decompose. P element can promote the decomposition of PU, releasing more CO2 at a lower temperature. This means that P element catalyzes dehydration of polyol from the depolymerization of PU to form water; then water can react with isocyanate from the depolymerization of PU to form CO2 and polyurea structure. The polyurea structure has better fire safety than polyurethane structure from PU, and can be used as carbon source with P element in flame retardants.
4. Conclusion
In the present era in which the environment pollution and the waste of resources is getting worse and worse, a new clean environmental friendly flame retardant of polymer is very necessary. In this paper, a novel ALP microcapsule was synthesized successfully. The flame retardancy of PU foam was studied by various measures. The results showed that the ALP microcapsule had better flame retardant effect on PU foam than pure ALP. Through the analysis of these experiments, it had provided a new idea and method to study the shell–core structure, and these shell–core materials were inorganic compound, halogen-free, non-toxic and environmentally friendly, and that green flame retardant of polymer. This will be very significant.Acknowledgements
We gratefully acknowledge financial supports from the Zhejiang Provincial Key Lab. Of Industrial Textile Materials & Manufacturing Tech (No. 2011R50003).References
- X. Flambard, S. Bourbigot, R. Kozlowski, M. Muzyczek, B. Mieleniak, M. Ferreira, B. Vermeulen and F. Poutch, Polym. Degrad. Stab., 2005, 88, 98–105 CrossRef CAS.
- R. Kozlowski, B. Mieleniak, M. Helwig and A. Przepiera, Polym. Degrad. Stab., 1999, 64, 523–528 CrossRef CAS.
- X. Chen, C. Ma and C. Jiao, Polym. Degrad. Stab., 2016, 129, 275–285 CrossRef CAS.
- D. Tabuani, F. Bellucci, A. Terenzi and G. Camino, Polym. Degrad. Stab., 2012, 97, 2594–2601 CrossRef CAS.
- A. Toldy, G. Harakály, B. Szolnoki, E. Zimonyi and G. Marosi, Polym. Degrad. Stab., 2012, 97, 2524–2530 CrossRef CAS.
- U. Almeida Pinto, L. L. Y. Visconte, J. Gallo and R. C. R. Nunes, Polym. Degrad. Stab., 2000, 69, 257–260 CrossRef.
- H. Li, N. Ning, L. Zhang, Y. Wang, W. Liang and M. Tian, Polym. Degrad. Stab., 2014, 105, 86–95 CrossRef CAS.
- G. Laufer, C. Kirkland, A. B. Morgan and J. C. Grunlan, ACS Macro Lett., 2013, 2, 361–365 CrossRef CAS.
- M. Berta, C. Lindsay, G. Pans and G. Camino, Polym. Degrad. Stab., 2006, 91, 1179–1191 CrossRef CAS.
- Z. H. Zheng, H. M. Sun, W. J. Li, S. L. Zhong, J. T. Yan, X. J. Cui and H. Y. Wang, Polym. Compos., 2014, 35, 715–729 CrossRef CAS.
- K. Wu, L. Song, Z. Wang and Y. Hu, Polym. Adv. Technol., 2010, 19, 1914–1921 CrossRef.
- J. X. Ni, L. Song, Y. A. Hu, P. Zhang and W. Y. Xing, Polym. Adv. Technol., 2009, 20, 999–1005 CrossRef CAS.
- K. Wu, Y. K. Zhang, W. G. Hu, J. T. Lian and Y. Hu, Compos. Sci. Technol., 2013, 81, 17–23 CrossRef CAS.
- T. N. Kovács, D. Hunyadi, A. L. A. D. Lucena and I. M. Szilágyi, J. Therm. Anal. Calorim., 2016, 124, 1013–1021 CrossRef.
- M. J. Chen, C. R. Chen, Y. Tan, J. Q. Huang, X. L. Wang, L. Chen and Y. Z. Wang, Ind. Eng. Chem. Res., 2014, 53, 1160–1171 CrossRef CAS.
- D. K. Chattopadhyay and D. C. Webster, Prog. Polym. Sci., 2009, 34, 1068–1133 CrossRef CAS.
- S. V. Levchik and E. D. Weil, Polym. Int., 2010, 53, 1901–1929 CrossRef.
- H. J. Duan, H. Q. Kang, W. Q. Zhang, X. Ji, Z. M. Li and J. H. Tang, Polym. Int., 2014, 63, 72–83 CrossRef CAS.
- T. C. Chang, W. S. Shen, Y. S. Chiu and S. Y. Ho, Polym. Degrad. Stab., 1995, 49, 353–360 CrossRef CAS.
- R. Dupretz, G. Fontaine, S. Duquesne and S. Bourbigot, Polym. Adv. Technol., 2015, 26, 865–873 CrossRef CAS.
- Z. Wang, P. Wei, Y. Qian and J. Liu, Composites, Part B, 2014, 60, 341–349 CrossRef CAS.
- C. Bao, L. Song, C. A. Wilkie, B. Yuan, Y. Guo, Y. Hu and X. Gong, J. Mater. Chem., 2012, 22, 23057–23063 RSC.
- X. Wen, J. Gong, H. Yu, Z. Liu, D. Wan, J. Liu, Z. Jiang and T. Tang, J. Mater. Chem., 2012, 22, 19974–19980 RSC.
- M. Gao and S. Yang, J. Appl. Polym. Sci., 2010, 115, 2346–2351 CrossRef CAS.
- W. Liu, D. Q. Chen, Y. Z. Wang, D. Y. Wang and M. H. Qu, Polym. Degrad. Stab., 2007, 92, 1046–1052 CrossRef CAS.
- S. Nie, Y. Hu, L. Song, Q. He, D. Yang and H. Chen, Polym. Adv. Technol., 2008, 19, 1077–1083 CrossRef CAS.
- L. J. Qian, Y. Qiu, N. Sun, M. L. Xu, G. Z. Xu, F. Xin and Y. J. Chen, Polym. Degrad. Stab., 2014, 107, 98–105 CrossRef CAS.
- L. J. Qian, Y. Qiu, J. Y. Wang and W. Xi, Polymer, 2015, 68, 262–269 CrossRef CAS.
- S. Takayama, N. Mathubara, T. Arai and K. Takeda, Polym. Degrad. Stab., 1995, 50, 277–284 CrossRef CAS.
| This journal is © The Royal Society of Chemistry 2017 |