 Open Access Article
Creative Commons Attribution 3.0 Unported Licence
Phase-conjugated directional diffraction from a retroreflector array hologram
Rajib Ahmed *a,
Ahmmed. A. Rifatb,
Muhammad Umair Hassanac,
Ali K. Yetisen
 d and
Haider Butt
 *a
*a
aNanotechnology Laboratory, School of Engineering, University of Birmingham, Birmingham B15 2TT, UK. E-mail: a.rajib@osamember.org; h.butt@bham.ac.uk
bNonlinear Physics Centre, Research School of Physics & Engineering, Australian National University, Canberra, ACT-2601, Australia
cDepartment of Physics, COMSATS Institute of Information Technology, Islamabad 44000, Pakistan
dHarvard-MIT Division of Health Sciences and Technology, Massachusetts Institute of Technology, Cambridge, MA 02139, USA
First published on 12th May 2017
Abstract
A corner cube retroreflector (CCR) consists of three perpendicular flat surfaces and reflects the incident light back to its source. Optical properties of CCR arrays have applications in free space optical communication, low power wireless networks and sensing applications. Conventional top-down CCR array fabrication is complex and requires expensive equipment and limited to broadband reflection only. Here, we utilize laser assisted copying of a CCR array to a light sensitive holography polymer film (∼10 μm) which was placed parallel to the object plane (CCR array) during the recording. Optical characterization of the recorded CCR array hologram was carried out using reflection and color-selective diffraction measurements. Angle dependent optical properties were also simulated computationally followed by their experimental realization, which confirm our experimental findings. In a broadband illumination setting, a broadband white light reflection and a narrowband color diffraction were observed. A linear relationship between the incidence angle of the broadband light and the diffraction angle of the diffracted color light was observed. Bright and well-defined 2nd order far-field diffraction patterns were observed using an image-screen experiment. Maximum diffraction efficiency (DE) of ∼50% was observed for the monochromatic green light at normal illumination setting. The far-field diffraction interspacing/intensity exhibits increasing/decreasing trend with illumination tilt angles, measured between 10 to 50 degrees. The recorded CCR array holograms offer potential applications in color selective diffraction optics and customized optical devices.
Introduction
A corner cube retroreflector (CCR) is an optical device that reflects the light back to the source.1,2 Directional properties of the CCR are due to the total internal reflection (TIR) from its three orthogonally placed mirror surfaces,3,4 and have found applications in various fields, such as navigation, displays, image processing, free-space communication, and sensors etc.4–11 It is not always desirable to make perfect CCRs. Imperfect retroreflectors are also important because of their use in practical applications, such as in traffic signals/car lights etc.7,12 Due to the inability of a perfect CCR to show quasi-retroreflection properties, it is not very useful for traffic signaling. Therefore, quasi-retroreflection is ensured by intentionally introduced artifacts or structural imperfections during their fabrication process.12 Range of different techniques are used to fabricate CCRs including microelectromechanical, lithography, and direct laser writing.13–15 Diamond micro-maching was also used to directly cut 120° CCR faces for high retroreflection.16 CCRs have also been fabricated by direct etching using different masks obtained by photolithography.14,17 Direct laser ablation technique has also been used for the same purpose.18 However, these reported techniques have limitations due to relatively expensive equipment, time-consuming processing and high expertise–dependence.14,19,20 Therefore, fast, low cost, and accurate techniques are desired for CCRs manufacturing. Holography technique with desired surface functionalities have been recently reported to produce CCRs and other optical device (lens, diffuser, 1D/2D patterns, and diffraction grating, etc.), which is a simple, fast, and cost-effective process.21–23Holography is mainly classified into two types, surface or two-dimensional (2D) holography and volume or three-dimensional (3D) holography.24 Both technique are based on optical recoding of phase and amplitude information of reflected light from a recorded object.25 An optical recording medium (ORM) is a photosensitive material, usually a polymer, that retains the optical information it has been exposed to. Recording on ORM for a 3D hologram is realized by illuminating it with two interfering beams coming from the same source but different pathways, that is, a reflection beam from the object, and a guided reference beam from the source. After the recording process, image reconstruction is achieved through light reflection/diffraction from the recorded information on the ORM. In 2D-holography, light information from both reference and recording medium comes from the same side and creates perpendicular planar interference fringes on the ORM.24 However, in 3D-holography, light information coming from different sides of the reference and recoding of medium make multilayer fringes on the ORM photo-polymers. With the variation of input light intensity, wavelength, phase and physical arrangements, micro and nano scale 2D/3D optical devices can be recoded thorough reflection holography.22 Holographic recording through a light sensitive medium has applications in displays, optical devices, sensing, interferometry, nano-antennas and data storage.26,27
Here, a CCR array hologram is recorded on a light sensitive ORM through Denisyuk reflection holography method. Optical properties of the recorded hologram were studied using reflection, diffraction, rational, and far-field experiments, as well as, by computational modelling. Far-field experiments showed bright and well-resolved 2nd order diffraction patterns with monochromatic light (red, green, and blue) illuminations. As the incident wavelength increased, the interspacing between diffraction spots and non-diffracted zero order also increased. The diffraction intensity decreased as the incident light wavelength decreased, in the same way as expected from a diffraction grating. The DE measurement exhibited a maximum of ∼50% (minimum of ∼18%) light diffraction for the green (blue) illuminations. The CCR array hologram showed angular dependence of white light reflection and exhibited a color resolved diffraction when subject to a broadband illumination. Angle dependent behavior of the recorded hologram was also confirmed by computational simulations for triangular array structures. Image projection experiments were also carried out to study the rotational property of the CCR array hologram.
Result and discussion
Fabrication and sample preparation
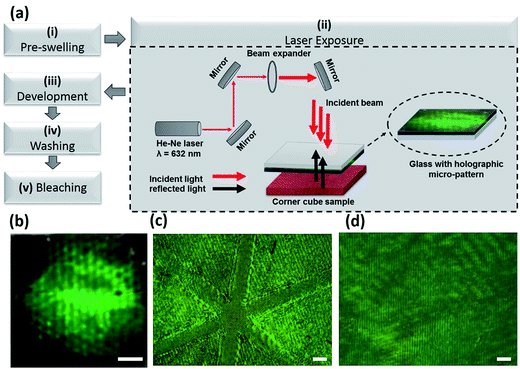
Silver-halide chemistry was used for the preparation of the holographic plate samples, see Fig. 2. An aqueous solution of 30 mL triethanolamine (TEA) (1![[thin space (1/6-em)]](https://www.rsc.org/images/entities/char_2009.gif) :
:![[thin space (1/6-em)]](https://www.rsc.org/images/entities/char_2009.gif) 300, v/v) was used as wetting agent (mixed and stirring for 2 to 3 min). Holographic plates of 20 × 20 cm2 (BB-640, Colour Holographic, London) were soaked into this solution (2 to 3 min) for pre-swilling to achieve higher light-sensitivity and color shifting property of the recorded hologram. The holographic emulsion medium was based on thin (∼10 μm) gelatin layers which contains AgBr nano-crystals (NCs) that act as the light sensitive medium. Subsequently, the pre-swelled plates were dried under laminar air flow. These plates (one at a time) were then placed on a laser exposure stage for the recoding. We used a Denisyuk reflection holography sachem, as this is the simplest technique, yet, powerful enough to produce highest quality holograms. An expanded continuous red laser (632.13 nm, 4 mW) was use to expose (at normal angle) the holographic plate (sample) and the CCR array (object) (SL150-18, JunAN, China) was placed – at distance of 40 cm in a top-bottom configuration, respectively.
300, v/v) was used as wetting agent (mixed and stirring for 2 to 3 min). Holographic plates of 20 × 20 cm2 (BB-640, Colour Holographic, London) were soaked into this solution (2 to 3 min) for pre-swilling to achieve higher light-sensitivity and color shifting property of the recorded hologram. The holographic emulsion medium was based on thin (∼10 μm) gelatin layers which contains AgBr nano-crystals (NCs) that act as the light sensitive medium. Subsequently, the pre-swelled plates were dried under laminar air flow. These plates (one at a time) were then placed on a laser exposure stage for the recoding. We used a Denisyuk reflection holography sachem, as this is the simplest technique, yet, powerful enough to produce highest quality holograms. An expanded continuous red laser (632.13 nm, 4 mW) was use to expose (at normal angle) the holographic plate (sample) and the CCR array (object) (SL150-18, JunAN, China) was placed – at distance of 40 cm in a top-bottom configuration, respectively.
After passing through the optical components, the directed light passes through the ORM and reflects back from the object to the ORM where it leaves interference imprints – thus, the information is recorded. The recoding process required only few seconds to record the CCR hologram array. The latent image was formed through redistribution of AgBr NCs in two steps, namely,28 ionization: AgBr + hν → Ag+ + Br− + e−, and metallic Ag0 formation: Ag+ + e− → Ag0. The recorded hologram was immersed (5 to 6 min) in a developer based on equal amounts of solution-A (ascorbic acid (40 gm), 4-methylaminophenol (6 gm) in 1 L DI-water), and solution-B (sodium carbonate (100 gm), sodium hydroxide (30 gm) in 1 L DI-water. Formation of Ag0 nanoparticles was favored at points of bright fringes, and appear as dark image in the holographic plate. The recorded holographic plate was removed from the developer bath and immersed (1 to 2 min) in the bleach containing potassium bromide (KBr) (60 g) and CuSO4 (30 mL) solution. During the bleaching process, the dark image converted to the bright image. Finally, the recorded hologram was washed (1–2 min) in a water bath and the dried (1–2 min) using hot laminar flow – hologram was ready for optical characterization. The whole process was performed in safety green light and completed in 20–30 minutes.
Optical property of a retroreflector
The CCR retroreflector consists of three trianglular mirror surfaces at right angles with two possible configurations, hollow, and solid CCR.3 A light beam incident to the CCR undergoes three mirror reflections before returning back to the source. However, not all the light entering from the front face of CCR experiences a complete reflection from all mirror surfaces – some of it becomes part of the retro-reflection.29 Notice that it is only the middle part of the triangular sections that plays active role in the retroreflection.4,30 Optical properties of the CCR are displayed through reflection and phase-conjugation rotational properties.Suppose an incident plane wave under paraxial approximation, propagating along x-direction,
| Ei(x,y,z) = A(x,y)exp(iφ(x,y))exp(−ikz) | (1) |
From normal mirror (NM), the reflected light wave,
| Em(x,y,z) = A(x,y)exp(iφ(x,y))exp(+ikz) | (2) |
For ideal phase conjugation mirror (PCM) case,
| EPC(x,y,z) = A(x,y)exp(−iφ(x,y))exp(+ikz) | (3) |
In a large CCR array,
 | (4) |
ECCR_array can be realized as an ideal EPC phase conjugation using eqn (3) and (4) considering,
(a) a constant amplitude approximation, that is, the amplitude variation should very small in each corner cube as if constant, therefore,
As a result eqn (4) can be written as,
 | (5) |
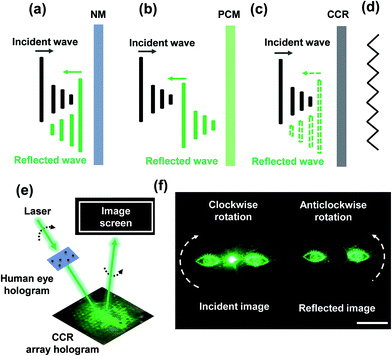
In terms of amplitude and phase reversal of the reflected wave, NM, PCM, and CCR hold different properties, see Fig. 2a–c. The incident wave reflected from a NM is oriented normal to the direction of propagation. The reflected wavefront from PCM shows the phase reversal property in contrast with that reflected from a CCR or NM. CCR faces are triangular, projection (side view), which can be visualized as 2D triangular grating structures, see Fig. 2d. The wavefront reflected from these triangular grating structures is completely disrupted and each section of the wavefront is parallel to the PCM. Therefore, the CCR acts as a pseudophase phase conjugator compared with PCM by reversing all segments of the reflected wavefront.3 The recorded CCR hologram also showed similar pseudophase phase conjugation properties as probed by image projection and rotational experiments. A pair of human eye image was illuminated on the recorded CCR hologram and far-field image was captured using an imaging setup, see Fig. 2e. The far-field projected image from the CCR hologram surface rotates in the opposite direction to the incident image (‘human eye’) for a monochromatic (green) light source, see Fig. 2f. Phase-conjugated rotational properties are also valid for other monochromatic (red, blue) and broadband light illuminations.
Optical computational modelling
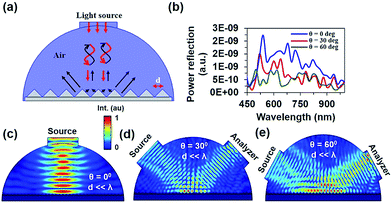
Optical reflection modelling of the CCR array was performed using finite element method (FEM).31,32 2D simulation was performed in order to reduce the computational complexity and runtime. The triangular grating surface (n = 2.24 at 632 nm) was illuminated with a light source at its normal (90°) and tilted angles (−30° and −60°). The reflected light was measured from the hemispherical surface surrounded by air (n = 1). Continuity and scattering boundary conditions were considered at the triangular grating and hemispherical surface during simulation. Sub-meshing (one tenth of incident light) and convergence tests were performed for the accuracy of our results.33 Computation structure consisted of 14![[thin space (1/6-em)]](https://www.rsc.org/images/entities/char_2009.gif) 031 triangular mesh-elements, 647 boundary elements and 98
031 triangular mesh-elements, 647 boundary elements and 98![[thin space (1/6-em)]](https://www.rsc.org/images/entities/char_2009.gif) 836 degrees of freedom, solution time was ∼30 s. Fig. 3a shows the conceptual block diagram for the computational reflection from the CCR surface. During normal reflection, source and analyzer were considered at the same position. Light reflected at normal possesses the maximum intensity of the reflected green color from the grating surface. The broadband light illumination at −30° and −60° tilt showed reflections at +30° and +60°, respectively, as assessed by a spectrum analyzer computation module at these angles. The reflected light intensities plotted as a function of wavelength at illumination angles of 90°, 30° and 60°, showed peak maxima at 540, 520 and 500 nm, respectively, see Fig. 3b. In the reflection spectra, random peaks also existed apart from the peak shifts. The overall reflected intensity was maximum for the normal illumination and reduced for higher angles. It was difficult to perform the computation for very large angle because of geometrical constraints.
836 degrees of freedom, solution time was ∼30 s. Fig. 3a shows the conceptual block diagram for the computational reflection from the CCR surface. During normal reflection, source and analyzer were considered at the same position. Light reflected at normal possesses the maximum intensity of the reflected green color from the grating surface. The broadband light illumination at −30° and −60° tilt showed reflections at +30° and +60°, respectively, as assessed by a spectrum analyzer computation module at these angles. The reflected light intensities plotted as a function of wavelength at illumination angles of 90°, 30° and 60°, showed peak maxima at 540, 520 and 500 nm, respectively, see Fig. 3b. In the reflection spectra, random peaks also existed apart from the peak shifts. The overall reflected intensity was maximum for the normal illumination and reduced for higher angles. It was difficult to perform the computation for very large angle because of geometrical constraints.
The electric field distribution of the computational results with normal and tilted broadband light illumination exhibited reflection, interference, diffraction/scattering properties as shown in Fig. 3c–e. Interference patterns were observed from the periodic intensity variation along the vertical axis. For the normal illumination, maximum light was reflected back toward the source and minimum diffraction/scattering was observed. Inference occurs between the incident (red arrow) and reflected (black arrow) light waves. Light inference for 60° tilted angle was higher as compared with the 30° tilted angle. Interference intensity for the tilted illumination is also dependent on the number of side walls. For larger tilt angles, more light is reflected from the side walls and has more chance to interfere with the incident waves. Therefore the amount of light diffraction/scattering increased for the large tilt illumination (θ = 60°) compared with lower tilt angle (θ = 30°) and minimum for the normal illumination (θ = 0°).
Optical characterization
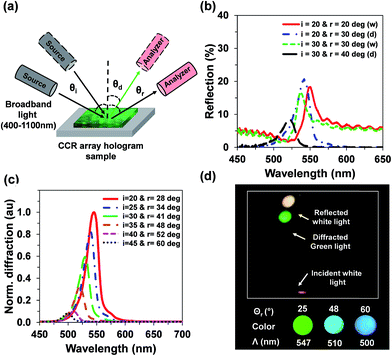
Experimental studies for optical properties of the CCR array hologram were carried out in reflection mode using a reflection/diffraction measurement setup, see Fig. 4a for the details. The CCR array hologram surface was illuminated with a broadband light (400–1100 nm) at an incident angles, θi. Reflection and diffraction intensities were measured at angles θr, and θd, respectively, using a photospectrometer (Ocean Optics, Δλ = 450–1100 nm, resolution = 0.2 nm). The light source and spectrometer were carefully mounted on a precision motorized rotation stages for angular measurements. The setup can be said to consist on two main halves, one for incident light and other for reflection/diffraction measurements. For the incidence angles, θi = 20 and 30°, the emerging light was recorded at θr, reflected white light was measured at θr = θi = 20 and 30°, respectively (Fig. 4b). With increasing θi, reflection spectra showed a blue shift, accompanied by lowering of the optical intensity as recorded at θ0.Diffraction behavior was recorded for θi = 20° to 45°, with an increment of 5° and recorded at θr = θd, between 28 to 60°, see Fig. 4c. We observed a color resolved diffraction from the CCR array hologram surface following the Bragg's law, as well as, differentiates the behavior from simple reflection law (θi = θr). Diffracted color peaks also showed a blue shift from 541 to 500 nm as the incidence angle was moved from its minimum of 20° to the maximum value of 45° – optical intensity of the diffracted color light decreased as the incident angle increased. Consistent with reflection measurements, maximum peak intensity was observed at small incidence angles which systematically decreased with increasing θi. Incident broadband light and far-field diffracted color light with incidence angles are shown in Fig. 4d. A white-square box in this figure shows one example of incident broadband light, reflected white light and diffracted color (green) light at certain angle, θi = 25°. For θr = 25, 48, and 60°, the far-field diffracted light showed green (547 nm), light-blue (510 nm), and dark-blue (500 nm) colors, respectively. We can exploit this angle resolved behavior of the CCR array hologram as a visible colorimetric based measurement systems for many practical applications.
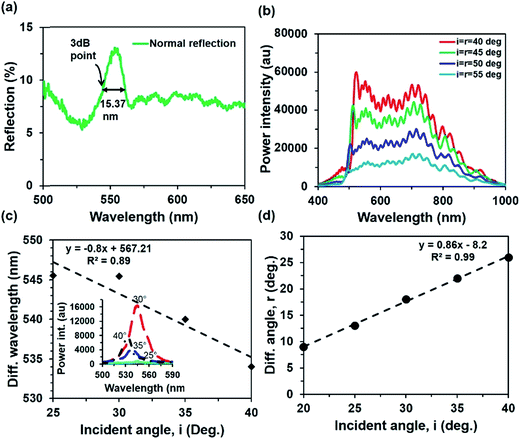
For normal illumination of broadband light, a broadband green peak (λ = 554 nm, Δλ = 15.37 nm at 3 dB of max) was reflected back from the CCR array holographic surface, see Fig. 5a. Normal reflection measurement was based on optical microscopic setup. Reflection spectra for normal incidence of the broadband light at CCR hologram surface was picked up by an object lens (×20) in reflection mode. Further reflection measurements were carried out for θi = θ0 = 40 to 55° with an increment of 5° using the same light source (Fig. 5b). The peak wavelength of the reflected light blue-shifted as predicted by our computational modelling, as shown earlier in Fig. 3b. The peak-wavelength was plotted for diffracted color light at measurement angle, θd = 20° for the different θi = 25 to 45° with increment of 5°, see Fig. 5c. The diffracted peak wavelength shifted to lower values with increasing angle, due to reduced spacing parameter of multi-layer grating at the large viewing/illumination angles. Spectral recording for the diffracted color light, plotted at certain illumination angles, θi is shown in inset to Fig. 5c. Angular dependence of emerging diffracted light, on different illumination angles was also studied at different spectrometer positions, confirming a linear relationship between θi and θd, as also expected from previous results, Fig. 5d.
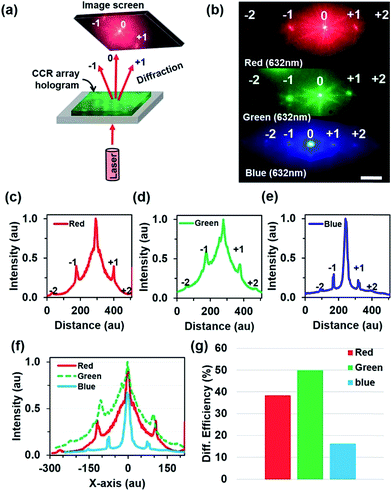
An image-screen setup was also used for far-field diffraction experiments, see Fig. 6a for setup schematics. Monochromatic light sources, red (635 nm, 4.5 mW, Ø11 mm), green (532 nm, 4.5 mW, Ø11 mm) and blue (492 nm, 2.6 mW, Ø11 mm) (Thorlabs Elliptec GmbH Dortmund, Germany), were used for diffraction experiment at normal illumination, Fig. 6b–g. The diffraction distance for the 1st and 2nd orders from zero order increased as we moved from blue to red wavelengths in accordance with Bragg's law, (Λ = λ/2![[thin space (1/6-em)]](https://www.rsc.org/images/entities/char_2009.gif) sin
sin![[thin space (1/6-em)]](https://www.rsc.org/images/entities/char_2009.gif) θi, Λ is grating spacing, λ is incident wavelength, and θi is the incidence/tilt angle). However, green light exhibited maximum diffraction intensity; minimum value was observed in the case of blue light. We also computed the diffraction behavior according to the experimental conditions, which confirm the experimentally recorded diffraction behavior to be consistent, Fig. 6f. Therefore, it is suggested that the diffraction properties of the CCR array hologram exhibit similar optical behavior to that of a diffraction grating. This may be due to the fact that the recorded CCR surface consisted of multi-grating structures (Fig. 1d). Furthermore, diffraction efficiencies (a ratio between intensities of diffracted and incident lights) for the 1st order for CCR array hologram were found to be maximum for green and minimum for the blue lasers, 49.8 and 16.2%, respectively.
θi, Λ is grating spacing, λ is incident wavelength, and θi is the incidence/tilt angle). However, green light exhibited maximum diffraction intensity; minimum value was observed in the case of blue light. We also computed the diffraction behavior according to the experimental conditions, which confirm the experimentally recorded diffraction behavior to be consistent, Fig. 6f. Therefore, it is suggested that the diffraction properties of the CCR array hologram exhibit similar optical behavior to that of a diffraction grating. This may be due to the fact that the recorded CCR surface consisted of multi-grating structures (Fig. 1d). Furthermore, diffraction efficiencies (a ratio between intensities of diffracted and incident lights) for the 1st order for CCR array hologram were found to be maximum for green and minimum for the blue lasers, 49.8 and 16.2%, respectively.
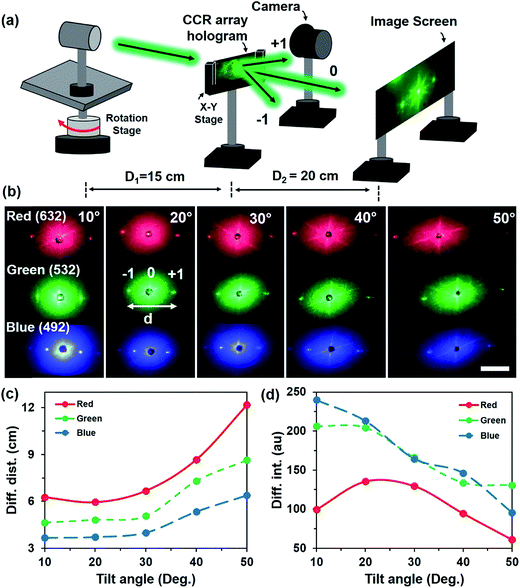
Holographic CCR array sample was also illuminated in transmission mode with three monochromatic lights (red, green, and blue) at tilt angles of 10° < θi < 50°, with increment of 10°, Fig. 7. An optical powermeter and image screen setups were used to record the information for far-field diffraction patterns at different illumination angles. Motorized precision rotation stages were used for incidence and emerging sides. The sample was positioned at a height adjustable 2D x–y stage. With increasing illumination angle, the distance between diffraction spots also increases in accordance with the Bragg's law. By the same token, the red light shows maximum diffraction distance as compared with other two wavelengths. As a general trend, the diffraction intensity decreased with tilted illumination angles. However, a maximum diffraction intensity was obtained in case of green illumination, consistent with our previous results. We suggest that the diffraction intensity variation was due to the response of internal multi-grating structure (AgBr NCs) of the hologram and their interaction with respect to monochromatic light.
Conclusion
The Denisyuk reflection holography technique was used to record a flat CCR hologram on a holographic polymeric film. Optical properties of the recoded hologram were characterized through reflection and diffraction experiments. Computational modeling was performed to predict angle dependent reflection, diffraction and interference behavior of the CCR array holographic surface. Image projection experiments as well simulation reveal phase-conjugated rotational properties of as made holographic devices. Under a broadband illumination, an angle dependent broadband reflection was found at the same mirror angle in the reflection plane, and narrowband color resolved diffraction at certain diffraction angles. Green light (554 nm) was observed to have the maximum reflection intensity in the normal reflection measurement. Diffraction angle for the color light showed a linear relationship with the incident angle of the broadband light. Second order diffraction patterns were also studied through monochromatic (red, green, and blue) light illumination – diffraction properties from the CCR array holographic surface had similarities to a diffraction grating. Monochromatic illumination also confirm the maximum DE (∼50%) for the green light. Oblique illumination in the far-field directional-diffraction setting showed an increasing diffraction distance behavior with increasing illumination angle. However, the diffraction intensity generally decreased at higher tilt angles.Acknowledgements
The authors thank Jeff Blyth for help and discussions toward this project. HB acknowledge the Leverhulme Trust for the research funding.References
- J. P. Hansen and S. Madhu, Appl. Opt., 1972, 11, 233–238 CrossRef CAS PubMed.
- B. Park, T. Eom and M. Chung, Appl. Opt., 1996, 35, 4372–4380 CrossRef CAS PubMed.
- R. A. Chipman, J. Shamir, H. J. Caulfield and Q.-B. Zhou, Appl. Opt., 1988, 27, 3203–3209 CrossRef CAS PubMed.
- H. Kim and B. Lee, Opt. Eng., 2007, 46, 094002–094014 CrossRef.
- L. Zhou, J. M. Kahn and K. S. Pister, J. Microelectromech. Syst., 2003, 12, 233–242 CrossRef.
- J. Hou, JOSA A, 2004, 21, 223–230 CrossRef PubMed.
- H. Kim, S.-W. Min and B. Lee, Appl. Opt., 2008, 47, 6453–6469 CrossRef PubMed.
- M. H. Bergen, J. Nichols, C. M. Collier, X. Jin, B. Raja, D. J. Roberts, P. Ruchhoeft, R. C. Willson and J. F. Holzman, Appl. Opt., 2014, 53, 3647–3655 CrossRef PubMed.
- S. Wang, T. Sherlock, B. Salazar, N. Sudheendran, R. K. Manapuram, K. Kourentzi, P. Ruchhoeft, R. C. Willson and K. V. Larin, IEEE Sens. J., 2013, 13, 4534–4541 CrossRef PubMed.
- W. Xingtao, H. Ping'an, L. Song and W. Jiyao, Geo Spatial. Inform. Sci., 2000, 3, 73–75 CrossRef.
- M. S. Scholl, JOSA A, 1995, 12, 1589–1592 CrossRef.
- S.-W. Park, E. Moon, H. Chung, J.-Y. Lee, C. Bae, J.-W. Kim and H. Kim, Appl. Opt., 2014, 53, 6605–6611 CrossRef PubMed.
- N. S. Shaar, G. Barbastathis and C. Livermore, J. Microelectromech. Syst., 2015, 24, 1043–1051 CrossRef CAS.
- Y. Lou, H. Wang, Q. Liu, Y. Shi and S. He, Appl. Opt., 2010, 49, 5567–5574 CrossRef PubMed.
- T. Sherlock, A. Nasrullah, J. Litvinov, E. Cacao, J. Knoop, S. Kemper, K. Kourentzi, A. Kar, P. Ruchhoeft and R. Willson, J. Vac. Sci. Technol., B: Nanotechnol. Microelectron.: Mater., Process., Meas., Phenom., 2011, 29, 06FA01 Search PubMed.
- E. Brinksmeier, R. Gläbe and C. Flucke, Prod. Eng., 2008, 2, 33–38 CrossRef.
- J. Yuan, S. Chang, S. Li and Y. Zhang, Opt. Commun., 2002, 209, 75–83 CrossRef CAS.
- K. Jolic, M. Ghantasala and E. C. Harvey, J. Microelectromech. Syst., 2003, 14, 388 Search PubMed.
- T. Alqurashi, A. Sabouri, A. K. Yetisen and H. Butt, AIP Adv., 2017, 7, 025313 CrossRef.
- T. Alqurashi, P. Penchev, A. K. Yetisen, A. Sabouri, R. M. Ameen, S. Dimov and H. Butt, RSC Adv., 2017, 7, 18019–18023 RSC.
- R. Ahmed, A. K. Yetisen, S. H. Yun and H. Butt, Light: Sci. Appl., 2017, 6, e16214 CrossRef CAS.
- R. Ahmed, A. K. Yetisen, A. El Khoury and H. Butt, Nanoscale, 2017, 9, 266–276 RSC.
- B. AlQattan, H. Butt, A. Sabouri, A. K. Yetisen, R. Ahmed and N. Mahmoodi, RSC Adv., 2016, 6, 111269–111275 RSC.
- J. J. Cowan, JOSA A, 1990, 7, 1529–1544 CrossRef.
- R. Ahmed, A. K. Yetisen and H. Butt, ACS Nano, 2017, 11, 3155–3165 CrossRef CAS PubMed.
- H. Butt, P. R. Kidambi, B. Dlubak, Y. Montelongo, A. Palani, G. A. Amaratunga, S. Hofmann and T. D. Wilkinson, Adv. Opt. Mater., 2013, 1, 869–874 CrossRef.
- A. K. Yetisen, H. Butt, T. Mikulchyk, R. Ahmed, Y. Montelongo, M. Humar, N. Jiang, S. Martin, I. Naydenova and S. H. Yun, Adv. Opt. Mater., 2016, 4, 1589–1600 CrossRef CAS.
- R. Gurney and N. Mott, Proc. R. Soc. London, Ser. A, 1938, 151–167 CrossRef CAS.
- J. D. Black and R. J. Parker, Opt. Commun., 1991, 81, 85–88 CrossRef CAS.
- D. C. O'Brien, G. E. Faulkner and D. J. Edwards, Appl. Opt., 1999, 38, 4137–4144 CrossRef.
- R. Ahmed, A. A. Rifat, A. K. Yetisen, Q. Dai, S. H. Yun and H. Butt, J. Appl. Phys., 2016, 119, 113105 CrossRef.
- H. Butt, A. K. Yetisen, R. Ahmed, S. H. Yun and Q. Dai, Appl. Phys. Lett., 2015, 106, 121108 CrossRef.
- R. Ahmed, A. A. Rifat, A. K. Yetisen, M. S. Salem, S.-H. Yun and H. Butt, RSC Adv., 2016, 6, 56127–56133 RSC.
| This journal is © The Royal Society of Chemistry 2017 |

