 Open Access Article
The significance of a new parameter – plasma protein binding – in therapeutic drug monitoring and its application to carbamazepine in epileptic patients
Jing-lin Gaoa,
Xin-yu Wanga,
Jing Anb,
Chao-hui Dua,
Meng-jiao Lia,
Hai-yan Maa,
Li-na Zhanga,
Jing Biana and
Ye Jiang *a
*a
aDepartment of Pharmaceutical Analysis, School of Pharmacy, Hebei Medical University, Shijiazhuang, Hebei Province 050017, China. E-mail: jiangye@hebmu.edu.cn; jiangye1@126.com; Tel: +86-0311-86266069
bDepartment of Pharmacy, Hebei General Hospital, Shijiazhuang, Hebei Province 050051, China
First published on 26th May 2017
Abstract
Free drug concentration (Cf) is instantaneous and susceptible to sampling time, which can confuse clinicians and cause them to adjust the dosage regimen. In the present work, we indicated a new parameter, the plasma protein binding (PPB) of clinical plasma samples, and discussed its application in TDM (Therapeutic Drug Monitoring). Furthermore, carbamazepine was selected as a model drug to develop a simple pretreatment method for the determination of PPB, in which Cf and Ct can be simultaneously analyzed in one plasma sample using a single device. Our results demonstrated that this proposed method exhibited some advantages, including perfect recovery (approximately 100%) and high precision (CV% < 3.0%). Furthermore, it achieved successful application in real plasma samples. Individual differences in PPB (from 10.1–68.9%) were among patients, and in additon, between the patients and healthy people (p < 0.05). Moreover, there was a weak correlation between Ct and Cf (r2 = 0.470 and p < 0.05), so the Cf of CBZ cannot be estimated from Ct. However, the primary cause of the variability of Cf is the change in PPB. As a consequence, applying PPB to guide individual dose adjustment is more accurate and more scientific than using Cf or Ct.
1 Introduction
It is well known that only free drugs can pass through membranes to an active site in order to exert pharmacological activity.1 In addition, a good correlation between toxicity and free concentration (Cf) has been found in clinical patients.2 Therefore, the monitoring of Cf of a target drug is more valuable for TDM compared to the total concentration (Ct).2,3 However, Cf or Ct determined in vitro just reflects the drug concentration at a specific time, which cannot reflect the overall level of free fraction during drug disposition. They are susceptible to the sampling time. Likewise, typical peak-valley profiles of Cf or Ct are usually observed after drug administration.4,5 Cf or Ct obtained at the time to peak concentration (Cmax) or valley concentration (Cmin) could deviate from the true concentration due to an inaccurate sampling time, as well as individual variations. J. J. Marty et al. have demonstrated that the great percentage fluctuation of Cf was in the range of 192–412% during the 6 h dosing interval for four patients receiving valproate (400–800 mg) as usual, compared to Ct (range 153–374%).6 The variation in Cf or Ct can result in the incorrect estimation of the effective dose available for each patient in clinical practice. Hence, a more accurate parameter contributing to the clinician’s optimised drug dosage regimen is a demand for TDM.In fact, with protein-bound compounds, the primary cause of the variability of Cf in pharmacology is the change in plasma protein binding (PPB).7 The binding of a drug to plasma proteins could be in a steady-state equilibrium under stable disease conditions and constant during a relatively long time, which can reflect the whole process of drug disposition. However, the co-administration of other drugs, pathological conditions and gender of patients can markedly change PPB and directly result in a variation in Cf, further influencing the efficacy and toxicity of the drug.8,9 Recently, Levy R. H. et al. indicated that an increase in Cf in plasma was associated with hypoalbuminemia (hepatic and renal disease, burns and pregnancy) and competitive binding, as antiepileptic drugs are predominantly bound to albumin.10 For this reason, the monitoring of PPB in clinical treatments can highlight changes in Cf, but also the variability of the individual physiological condition of patients. As PPB is a reliable index in pharmacology and physiology, PPB should be applied for better individualization of a drug dosage regimen in TDM, rather than Cf or Ct, to ensure the rationality and safety of drug administration in clinical patients.
However, in recent years, drug–protein binding studies for TDM have rarely been reported in clinical practice. Restricting the development of PPB monitoring in clinics is mainly due to some undesired drawbacks of analytical methods used in the laboratory. Traditional methods generally include two parts: the determination of Cf and Ct. In other words, two different pre-treatment methods and the corresponding devices were required, such as equilibrium dialysis (ED) or centrifugal ultrafiltration (CF-UF) for Cf, but also liquid–liquid extraction (LLE) or protein precipitation (PPT) for Ct preparation. ED is time-consuming and also has a possible dilution effect on drug levels as a result of a volume shift.1,9 This would lead to decreased sensitivity, which would be difficult for the analysis of clinical samples with low concentrations. In contrast, CF-UF is characterised as a simple and rapid separation. However, the volume of the ultrafiltrate (Vu) was not accurately controlled and the concentration polarization phenomenon could easily occur in the process. Furthermore, the results of analysis showed deviation from the true values. So, controlling the ratio of the ultrafiltrate to the sample solution in CF-UF is a challenge for operators, especially for different plasma conditions, such as blood viscosity, protein levels, osmotic pressure and so on.11–13 Meanwhile, more errors can be also introduced from using Ct monitoring procedures with another disparate device, such as LLE, PPT.14,15 These methods are unsuitable for Ct monitoring due to unsatisfactory recovery and poor reproducibility obtained from multi-step manipulation procedures, phase change processes and plasma conditions, thus the accuracy of the results needs to be examined as they could mislead the physician in clinical treatment. In addition, two plasma samples collected from each patient are required for Cf and Ct measurement, the collection of which is subject to the compliance of patients. The paired plasma needed is variable due to different collection times and storage conditions, which distorts the analysis result of the PPB and thus it is difficult to faithfully reflect the PPB level in patients in a clinical setting. As a consequence, the above problems assuredly impose restrictions on the application of PPB monitoring in the clinic.
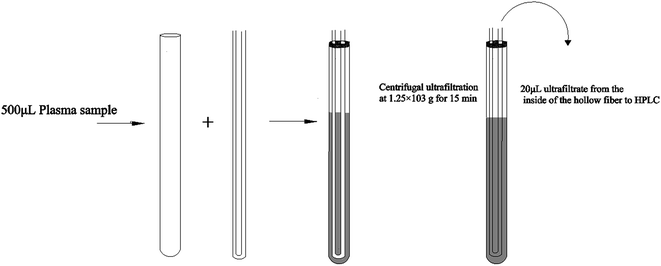
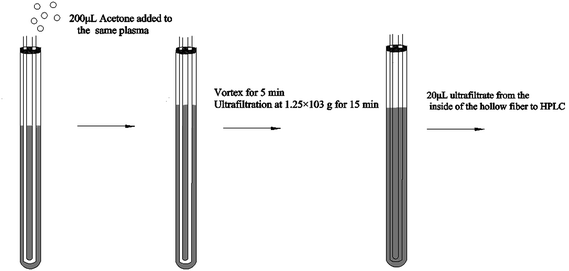
Hollow fiber centrifugal ultrafiltration (HFCF-UF) has been validated as a more accurate means of plasma pre-treatment and has been successfully applied to quantify free CBZ in clinical samples in our previous studies, which has improved on the problems of ED and CF-UF, as described above.16 Furthermore, the value of Vu/Vs was correlated to the inside radii of both the glass tube and the hollow fiber. With this smaller and well-controlled value, the recovery and precision of the HFCF-UF method were greatly improved and could not be affected by the plasma condition.16,17 To make this simple and accurate direct injection technology applicable to routine PPB measurement, by adding an appropriate protein-binding releasing agent into the same plasma following the determination of Cf, accurate analysis of Ct in the same system can also be carried out. Therefore, a simplified operation procedure and satisfactory recovery could make the HFCF-UF method feasible and practical to analyze a large number of clinical samples in PPB monitoring.
Carbamazepine (CBZ) is one of most prescribed anti-epileptic drugs (AEDs) internationally and is used in the treatment of psychomotor seizures and trigeminal neuralgia.18,19 Widespread individual variations of CBZ as well as a narrow therapeutic index range (4–12 μg mL−1) have been observed among epilepsy patients, resulting in the occurrence of side and toxic reactions in the clinical response.18 Therefore, routine TDM is common and essential for epilepsy patients treated with CBZ in the clinic.
In the present work, we used CBZ as a representative drug to study the importance of PPB monitoring in routine TDM. To ensure the accuracy of the results and the convenience of the clinical application, a simple pre-treatment method based on hollow fiber centrifugal ultrafiltration (HFCF-UF) for simultaneous Cf and Ct determination in the same plasma samples in a single device was developed and was successfully employed to monitor the PPB of CBZ in clinical plasma samples.
2 Experimental and methods
2.1 Materials and apparatus
The standard CBZ was purchased from the National Institute for Control of Pharmaceutical and Biological Products (Beijing, China). The hollow fibers (20 μm wall thickness, 10 kDa molecular weight cut-off) were obtained from the Motian Membrane Technology Corporation (Tianjin, China). Methanol (HPLC grade) was from Sigma-Aldrich (Steinheim, Germany). Ultrapure water was prepared by the Milli-Q50 water purification system. All other reagents were of analytical grade. The slim glass tubes (4.5 mm outside diameter, 0.5 mm wall thickness, 7 cm height) were provided by the Yongda Instrument and Chemical Company (Tianjin, China). Drug-free human plasma was obtained from patients who were not treated with CBZ in the Hebei General Hospital.2.2 Chromatographic conditions
Analysis was performed using an Ultimate 3000 HPLC system consisting of a LPG 3400SD quaternary pump and a VWD-3100 UV detector (Dionex, USA). All of the separations of CBZ were conducted on a Diamonsil C18 column (150 mm × 4.6 mm, 10 μm, Dikma), preceded by a pre-column frit (4.0 mm × 2.0 μm) at 30 °C. Chromatography was accomplished using an isocratic elution with methanol and 0.01 mol L−1 potassium dihydrogen phosphate buffer solution at 48/52 (v/v) at a flow rate of 1.0 ml min−1. The detection wavelength was 285 nm and the injection volume was 20 μL.2.3 Standard solutions and QC sample preparation
The stock solution (535 μg mL−1) of CBZ was prepared by dissolving the drug in methanol and was used for the preparation of working calibrator samples and working quality control samples (QC). A series of CBZ stock solutions were diluted with pure methanol to achieve final concentrations of 21.4, 10.7, 5.35, 2.14, 1.07 and 0.535 μg mL−1. The QC samples were obtained from a mixture of 450 μL of drug-free human plasma and 50 μL of three stock solutions to achieve final concentrations of 21.4, 5.35 and 0.535 μg mL−1 of total CBZ. The working calibrator samples and QC samples were stored at 4 °C until use.2.4 Sample preparation
 | (1) |
 | (2) |
2.5 Clinical samples
The study was performed in accordance with the Declaration of Helsinki and the International Conference on the Harmonization Guideline for Good Clinical Practice. The Ethic Review Committee of Hebei Medical University approved all of the procedures (approval no. 2016032). All of the participating patients provided written informed consent. In this study, a total of 20 clinical plasma samples were collected from Hebei General Hospital and were obtained from inpatients (2 male and 4 female; aged 14 months to 79 years) and outpatients (10 male and 4 female; aged 7 months to 63 years) taking CBZ. The subjects were treated with CBZ therapy for more than 1 month, of which the CBZ has reached steady-state plasma concentration. After at least one week of continuous treatment with CBZ, 2–3 mL of peripheral blood was collected in a centrifuge tube containing heparin just before the morning dose from each patient, and centrifuged at room temperature. Then the obtained plasma samples were stored at −80 °C until further analysis.2.6 Statistical analysis
Statistical analysis was performed using SPSS Statistics 21.0. The Wilcoxon signed-rank test was used to compare the mean PPB in epileptic patients with the values from healthy subjects. Linear regression analysis was used to assess the relationship between the total CBZ concentration and the free CBZ concentration, as well as the total CBZ concentrations determined by HFCF-UF and PPT or HFCF-UF and EMIT. A comparison among total CBZ concentration determined by HFCF-UF, PPT and EMIT was done by using two-way classification ANOVA. All statistical tests were two-sided and p < 0.05 was considered statistically significant.3 Results and discussions
3.1 Method validation
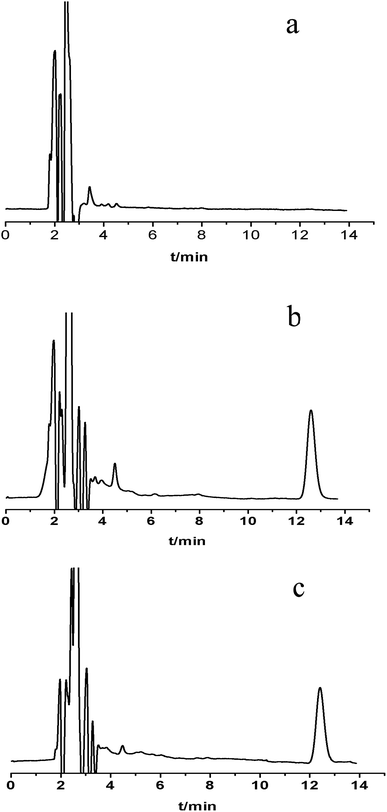
Method validation was carried out according to the “guidance of the Food and Drug Administration (FDA) for bioanalytical method validation”.20 Specificity, linearity, limit of detection, limit of quantification, precision and accuracy, absolute recovery and stability were specifically evaluated.The LOD and LOQ were determined by signal-to-noise (S/N) ratios of 3 and 10, respectively. The LOD and LOQ were 0.214 and 0.535 μg mL−1, respectively.
The HFCF-UF method was considered a mature approach for the determination of Cf in a previous study because the corresponding absolute recovery was approximately 100%, therefore, only the recovery of the analysis of Ct by HFCF-UF was examined in this study.16 Absolute recovery was assayed by comparing the Ct calculated by eqn (1) with the CBZ standard solution at the same concentrations. Then the PPB was calculated by eqn (2) based on Cf and Ct as described above. Table 1 summarizes the intra-day and inter-day precision as well as the accuracy. The absolute recovery was in the range of 100.2–100.8% (CV% < 2.0%) for Ct, showing that this method can satisfy the target drug monitoring of Ct measurements.
| Amount added (μg mL−1) | Intra-day (n = 5) | Inter-day (n = 5) | ||||
|---|---|---|---|---|---|---|
| Mean amount (μg mL−1) | Accuracya (% bias) | Imprecision (% CV) | Mean amount (μg mL−1) | Accuracya (% bias) | Imprecision (% CV) | |
| a Accuracy = [(mean amount − added amount)/added amount] × 100. | ||||||
| 0.535 | 0.530 | −1.0 | 2.2 | 0.533 | −0.4 | 2.9 |
| 5.35 | 5.31 | −0.8 | 1.7 | 5.33 | −0.4 | 1.8 |
| 21.4 | 21.6 | 1.0 | 1.2 | 21.5 | 0.5 | 1.5 |
3.2 Comparison of Ct from clinical samples by HFCF-UF, PPT and EMIT (Enzyme-Multiplied Immunoassay Technique)
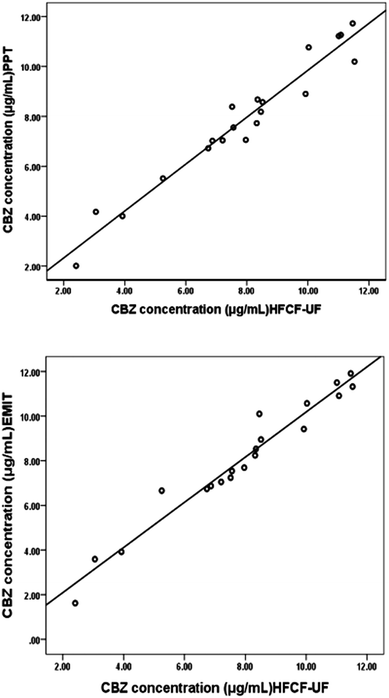
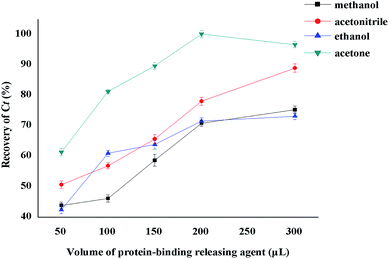
The Ct of CBZ measured by HFCF-UF, PPT and EMIT were analysed in all of the clinical samples from the 20 patients. As shown in Fig. 4, comparison of the proposed HFCF-UF method with either PPT or EMIT showed good agreement which confirmed the accuracy of the HFCF-UF method. In addition, there were no significant differences among the results determined by the three methods (p > 0.05). Thus, the HFCF-UF method for measuring Ct could be comparable with the widely accepted methods – PPT and EMIT – but the proposed HFCF-UF method was the simplest and most accurate among the three methods.For the PPT method, a relative ratio of 300 μL of methanol to 100 μL of plasma sample was required to precipitate proteins, which led to the effects of dilution and low detection sensitivity. Furthermore, the target drug was prone to be adsorbed and embedded by the precipitated protein, which resulted in a loss of the drug and a reduction in recovery. Moreover, there was variation among recoveries in the phase transition process due to the differences in operation processes (vortex time, centrifugal speed and so on) and the condition of plasma in epileptics (blood viscosity, protein level and so on). Thus, the measured Ct often deviated from the true values, which misled the physician who was optimizing epileptic patients’ drug regime, and further affected clinical treatment. Therefore, a simple and accurate assay for Ct analysis is desired to make it feasible and practical to analyze a large number of clinical samples. In the present work, the validated HFCF-UF method only required 200 μL of acetone as the protein-binding releasing agent into 500 μL of the plasma. The volume of organic solvent in HFCF-UF was significantly lower than that in PPT, making the sensitivity of HFCF-UF higher than that of PPT. Also, acetone could almost completely release CBZ from the protein into the plasma without a phase transition process and all small drug molecules could pass though membrane freely without any concentration polarization phenomenon by ultrafiltration, as the direction of centrifugal force is completely parallel to the membrane. As a consequence, higher recovery and reproducibility were obtained by this simple method, meeting the need of monitoring the total CBZ in clinical plasma samples in routine TDM.
As for EMIT, the data for Ct in this work was determined by the experienced clinical pharmacist from Hebei General Hospital. The operation process was carried out according to the corresponding Emit CBZ assay instruction on a Syva Autolab System. Meanwhile, determination of CBZ in plasma or serum has been developed by Jens Martens (1993) and B. Rambeck et al. (1994).21,22 This method has been a traditional and simple one for in vitro diagnostic use in the quantitative analysis of CBZ in a hospital. However, the process of EMIT suffered from many influencing factors (temperature, reaction time and so on). Julia Grandke et al. reported that incubation temperature, as a factor in immunoassays, greatly influenced the assay sensitivity of CBZ, especially in the case of concomitant medication.23 Therefore, rigorous operation as well as controlling the impact is key to achieve the high performance of the immunoassay in routine CBZ monitoring. In addition, the overestimation of the target drug concentration using EMIT has been presented in the literature and is due to not only unspecific cross-reactivity but also plasma condition.24 In contrast, the pre-treatment in the HFCF-UF method was simple as it just involves the centrifugal operation, which is not susceptible to environmental factors, so this method has excellent reproducibility, is easier to perform and consumes less time, especially for a large number of biological samples.
In addition, this method had a conspicuous predominance on the simultaneous analysis of Cf and Ct in one plasma sample without other pretreatment for Cf. The errors resulting from multi-step manipulation procedures, as well as the use of two plasma samples, were largely reduced, which could sufficiently meet the needs of TDM in patient management.
3.3 Data analysis of clinical samples
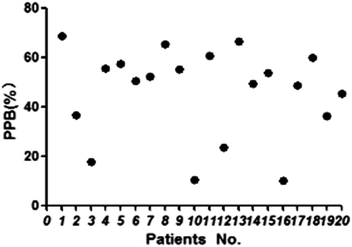
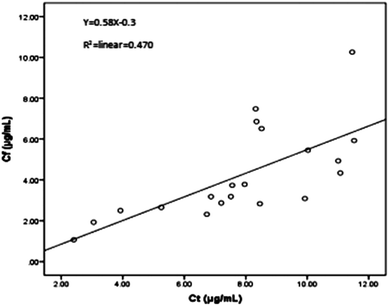
The proposed HFCF-UF method was successfully applied to determine the PPB in 20 patients undergoing treatment with CBZ. The ranges of Ct and Cf were 2.41–11.5 μg mL−1 and 1.07–10.3 μg mL−1. The PPB data of each patient is shown in Fig. 5 and the mean (range) of PPB was 46.3% (10.1–68.9%). Out of all of the observations, 17 of the Ct measurements were within the therapeutic range of 4–12 μg mL−1. There was a statistical difference in the data of PPB among the patients and in addition, between the patients and healthy people (p < 0.05). The results indicated that in clinical practice, using the PPB (approximately 76%) from healthy people to calculate Cf on the basis of determined Ct to guide dose adjustments is irrational.As shown in Fig. 6, there was a weak correlation between Ct and Cf. The increase in Cf was not associated with an increase in Ct. One patient’s Ct of CBZ was in the therapeutic range at 8.32 μg mL−1, while their Cf was high at 7.48 μg mL−1. Another patient’s Ct of CBZ was lower than the therapeutic range at 3.92 μg mL−1, whereas their free fraction was high at 64%. Thus, the Cf of CBZ cannot be estimated from Ct. Due to the difference in sampling time, the Cf measured at one time was not capable of predicting the CBZ concentration at another time, and also the extent of increasing or decreasing the drug dose could not be deduced from the single Cf measurement. So it is essential to choose a correct dose metric in TDM for individual drug delivery.
A drug binding to plasma protein (PPB) is a reversible process, which may be in a steady-state equilibrium with plasma under stable physiological conditions. In addition, an individual variation of PPB directly results in a change of Cf, which further influences the therapeutic effects of CBZ. For this reason, the optimisation of dosing regimens to avoid side effects could be based on PPB in TDM. In the present work, we have successfully applied PPB monitoring into TDM.
3.4 Assessment of non-specific binding (NSB) in ultrafiltration
The major disadvantage of the UF method is the non-specific binding of drugs to the filter membrane, leading to the ultrafiltrate concentration deviating from the true drug concentration. Therefore, an evaluation of NSB was needed before obtaining PPB measurements by HFCF-UF devices. Five replicates of CBZ standard solution were prepared at three concentrations (21.4, 5.35 and 0.535 μg mL−1), then 500 μL was placed into the HFCF-UF devices and centrifuged at 1.25 × 10³g for 15 min. Finally, intra- and extra- solutions of three types of hollow fiber (polyvinylidene fluoride, polysulfone and polyamide) were injected into the HPLC system. The NSB in ultrafiltration was assessed by comparing the obtained concentrations of the extra-solution, as well as the intra-solutions, of the hollow fiber to the corresponding concentration of the standard solutions. The results were all around 100% (CV% < 3.0%), indicating that there was no significant NSB in this study. Considering the flexibility and purchasing convenience of the three kinds of hollow fibers, we chose the polyvinylidene fluoride hollow fiber to be used for further study.3.5 Selection of the protein-binding releasing agent
The key to determining PPB using the HFCF-UF method is to select a stable protein-binding releasing agent to completely release CBZ from the drug-bound fraction and dissolve the small drug molecules across the membranes freely. Thus, both Cf and Ct could be obtained from the same plasma. As the target drug (CBZ) is a kind of liposoluble protein-binding drug, several organic solvents, such as methanol, acetonitrile, ethanol and acetone were discussed in the present study. The results are shown in Fig. 7. The recovery of Ct made it clear that acetone was the most appropriate protein-binding releasing agent out of the above solutions, with the highest recovery of CBZ. Thus, acetone was used in the following experiments.The effect of different protein-binding releasing agent volumes on the extent of CBZ released from the drug-bound fraction was also investigated (Fig. 7). The volume of organic solvents used was also associated with the sensitivity. The best recovery of Ct was obtained when the volume of acetone reached 200 μL. Additionally, the volume of acetone increased with decreasing sensitivity. In contrast, unsatisfactory recovery was a result of decreasing the releasing agent volume. So, the best volume of acetone was 200 μL and this volume was used in the experiments.
4 Conclusion
In the present study, the significance of a new parameter – PPB – in TDM was presented and successfully applied to epileptics taking CBZ. Compared Cf or Ct, using PPB to guide the individual dose adjustment was more rational. Meanwhile, we developed a simple and accurate method based on HFCF-UF coupled with HPLC for monitoring the PPB of CBZ and found that Ct and Cf could both be obtained from one clinical plasma sample in a single HFCF-UF device. This method had a conspicuous predominance on the analysis of Ct and Cf with excellent accuracy and precision. In addition, the developed method achieved successful application in the TDM of 20 Chinese epilepsy patients undergoing CBZ therapy. Therefore, it would be a simple and reliable alternative to PPB analysis of biological samples in routine TDM.Acknowledgements
The authors gratefully acknowledge financial support from the Key Research Project of Hebei Province in China 2017 (project no. 17277740D).References
- S. M. Illamola, D. Hirt, J. M. Treluyer, S. Urien and S. Benaboud, Challenges regarding analysis of unbound fraction of highly bound protein antiretroviral drugs in several biologica matrices: lack of harmonisation and guidelines, Drug Discovery Today, 2014, 1–9 Search PubMed.
- A. Dasgupta, Usefulness of monitoring free (unbound) concentrations of therapeutic drugs in patient management, Clin. Chim. Acta, 2007, 377, 1–13 CrossRef CAS PubMed.
- K. A. Mortier and W. E. Lambert, Determination of unbound docetaxel and paclitaxel in plasma by ultrafiltration and liquid chromatography-tandem mass spectrometry, J. Chromatogr. A, 2006, 1108, 195–201 CrossRef CAS PubMed.
- Y. Dou, J.-W. Guo, Y. Chen, S.-L. Han, X.-Q. Xu, Q. Shi, Y. Jia, Y. Liu, Y.-C. Deng, R.-B. Wang, X.-H. Li and J.-X. Zhang, Sustained delivery by a cyclodextrin material-based nanocarrier Potentiates antiatherosclerotic activity of rapamycin via selectively inhibiting mTORC1 in Mice, J. Controlled Release, 2016, 235, 48–62 CrossRef CAS PubMed.
- J. Goole, B. V. Gansbeke, G. Pilcer, P. Deleuze, D. Blocklet, S. Goldman, M. Pandolfo, F. Vanderbist and K. Amighi, Pharmacoscintigraphic and pharmacokinetic evaluation on Healthy human volunteers of sustained-release floating minitablets containing levodopa and carbidopa, Int. J. Pharm., 2008, 364, 54–63 CrossRef CAS PubMed.
- J. J. Marty, C. J. Kilpatrick and R. F. W. Moulds, Intra-dose variation in plasma protein binding of sodium valproate in epileptic patients, Br. J. Clin. Pharmacol., 1982, 14, 399–404 CrossRef CAS PubMed.
- R. T. Heine, E. M. V. Maarseveen, M. L. Monique, K. P. J. Braun, S. M. Koudijs, M. J. Berg and M. M. Malingre, The Quantitative Effect of Serum Albumin, Serum Urea, and Valproic Acid on Unbound Phenytoin Concentrations in Children, J. Child Neurology, 2013, 6, 803–810 Search PubMed.
- F.-L. Zhang, J.-P. Xue, J.-W. Shao and L. Jia, Compilation of 222 drugs’ plasma protein binding data and guidance for study designs, Drug Discovery Today, 2012, 17, 475–485 CrossRef CAS PubMed.
- P. Ascenzi, G. Fanali, M. Fasano, V. Pallottini and V. Trezza, Clinical relevance of drug binding to plasma proteins, J. Mol. Struct., 2014, 1077, 4–13 CrossRef CAS.
- R. H. Levy and M. S. Yerby, Effects of Pregnancy on Antiepileptic Drug Utilization, Epilepsia, 1985, 26, 52–57 CrossRef.
- W.-C. Dong, J.-F. Zhang, Z.-L. Hou, X.-H. Jiang, C.-F. Zhang, F.-H. Zhang and Y. Jiang, The influence of volume ratio of ultrafiltrate of sample on the analysis of non-protein binding drugs in human plasma, Analyst, 2013, 138, 7368–7375 Search PubMed.
- L. Zhang, Z.-Q. Zhang, W.-C. Dong, S.-J. Jing, J.-F. Zhang and Y. Jiang, Accuracy assessment on the analysis of unbound drug in plasma by comparing traditional centrifugal ultrafiltration with hollow fiber centrifugal ultrafiltration and application in pharmacokinetic study, J. Chromatogr. A, 2013, 1318, 265–269 CrossRef CAS PubMed.
- J.-M. Li, Y. Jiang, T. Sun and L.-J. Kang, Hollow-fiber ultrafiltration then centrifugation for LC analysis of water-soluble sucrose in a water-soluble high-molecular-mass gel matrix, J. Chromatogr., 2009, 70, 1023–1030 CrossRef CAS.
- H. A. Mowafy, F. K. Alanazi and G. M. Maghraby, Development and validation of an HPLC-UV method for the quantification of carbamazepine in rabbit plasma, Saudi Pharm. J., 2012, 20, 29–34 CrossRef PubMed.
- M. Behbahani, F. Najafi, S. Bagheri, M. K. Bojdi, M. Salarian and A. Bagheri, Application of surfactant assisted dispersive liquid–liquid microextraction as an efficient sample treatment technique for preconcentration and trace detection of zonisamide and carbamazepine in urine and plasma samples, J. Chromatogr. A, 2013, 1308, 25–31 CrossRef CAS PubMed.
- W.-C. Dong, Z.-Q. Zhang, X.-H. Jiang, Y.-G. Sun and Y. Jiang, Effect of volumeratio of ultrafiltrate to sample solution on the analysis of free drug and measurement of free carbamazepine in clinical drug monitoring, Eur. J. Pharm. Sci., 2013, 48, 332–338 CrossRef CAS PubMed.
- J.-F. Zhang, X.-L. Yang, Z.-Q. Zhang, W.-C. Dong and Y. Jiang, Accuracy of the analysis of free vancomycin concentration by ultrafiltration in various disease states, RSC Adv., 2014, 4, 40214–40222 RSC.
- E. Shokry, F. Villanelli, S. Malvagia, A. Rosati, G. Forni, S. Funghini, D. Ombrone, M. D. Bona, R. Guerrini and G. L. Marca, Therapeutic drug monitoring of carbamazepine and its metabolite in children from dried blood spots using liquid chromatography and tandem mass spectrometry, J. Pharm. Biomed. Anal., 2015, 109, 164–170 CrossRef CAS PubMed.
- A. J. Ajura, S. H. Lau and S. Nur-Suffia, An observational study of trigeminal neuralgia patients taking carbamazepine during the fasting month of ramadan, Med. J. Malays., 2016, 6, 305–307 Search PubMed.
- U.S. Department of Health and Human Services, Food and Drug Administration, Center for Drug Evaluation and Research (CDER), Center for Veterinary Medicine (CVM), Guidance for Industry, Bioanalytical Method Validation, 2001 Search PubMed.
- B. Rambeck, T. W. May, M. U. Jurgens, V. Blankenhorn, U. Jurges, E. Korn-Merker and A. Salke-Kellermann, Comparison of phenytoin and carbamazepine serum concentrations measured by high-performance liquid chromatography, the standard TDx assay, the enzyme multiplied immunoassay technique, and a new patient-side immunoassay cartridge system, Ther. Drug Monit., 1994, 16, 608–612 CrossRef CAS PubMed.
- J. Martens and P. Banditt, Validation of the analysis of carbamazepine and its 10,11-epoxide metabolite by high-performance liquid chromatography from plasma: comparison with gas chromatography and the enzyme-multiplied immunoassay technique, J. Chromatogr., 1993, 620, 169–173 CrossRef CAS PubMed.
- J. Grandke, U. Resch-Genger, W. Bremser, L. A. Garbeb and R. J. Schneider, Quality assurance in immunoassay performance-temperature effects, Anal. Methods, 2012, 4, 901–905 RSC.
- I. R. Dubbelboer, A. Pohanka, R. Said, S. Rosenborg and O. Beck, Quantification of Tacrolimus and Three Demethylated Metabolites in Human Whole Blood Using LC-ESI-MS/MS, Ther. Drug. Monit, 2012, 34, 134–142 CrossRef CAS PubMed.
| This journal is © The Royal Society of Chemistry 2017 |

