 Open Access Article
Creative Commons Attribution 3.0 Unported Licence
Exploring the origin of phosphodiesterase inhibition via proteochemometric modeling
Behnam Rasti *a,
Nalini Schaduangrat
 b,
S. Shirin Shahangian
 c and
Chanin Nantasenamat
 *b
*b
aDepartment of Microbiology, Faculty of Basic Sciences, Lahijan Branch, Islamic Azad University (IAU), Lahijan, Guilan, Iran. E-mail: rasti@liau.ac.ir
bCenter of Data Mining and Biomedical Informatics, Faculty of Medical Technology, Mahidol University, Bangkok 10700, Thailand. E-mail: chanin.nan@mahidol.edu
cDepartment of Biology, Faculty of Sciences, University of Guilan, Rasht 41938-33697, Iran
First published on 26th May 2017
Abstract
The phosphodiesterase (PDE) superfamily, including all PDE families and subfamilies, are often implicated in diverse physiological disorders thereby making their selective inhibition of great necessity. Of the PDE4 family, the subfamilies of PDE4B and PDE4D have attracted attention due to their role in highly critical disorders such as asthma, acrodysostosis, cognition disorder and schizophrenia. Owing to their different levels of involvement in related disorders and within different subcellular compartments, the development of specific subfamily-selective compounds seems pertinent. Since achieving selectivity can be facilitated by considering the information of both compound and protein, thereby calling for proteochemometrics (PCM) to investigate the interaction space and selectivity of different chemical compounds towards different PDE4 isoforms. Several internal and external data sets were applied to validate the predictivity of the PCM model for interpolating on internal compounds as well as extrapolating on newly designed compounds. The Y-scrambling approach was applied to evaluate the possibility of chance correlation. Excellent values of 0.9973, 0.9037 and 0.9742 were observed for the training (R2), internal cross-validation (Q2) and external validation set (Qext2), respectively. Practical utilization of this information was demonstrated via the design of a few novel compounds whereby structural changes to the compound can exert effects on the selectivity against both PDE4B and PDE4D. Our model provided knowledge on the structural features of compounds in order to discriminate the binding of PDE4B and PDE4D, which is valuable for the promising design of selective inhibitors.
Introduction
Phosphodiesterases (PDEs) (EC 3.1.4.17) catalyze the production of 5′-AMP and 5′-GMP via the degradation of cyclic adenosine monophosphate (cAMP) and cyclic guanosine monophosphate (cGMP), respectively.1 These secondary messengers are crucial in physiological processes such as cell growth, apoptosis, immune responses, reproduction, inflammatory responses, etc.2,3 Consequently, a lot of major disorders like obesity, diabetes, heart failure, arthritis, chronic obstructive pulmonary disease (COPD) and cancer can be engaged with PDE deficiency.4–6 The PDE superfamily is comprised of eleven families. Among them, the PDE families are divided into cAMP-specific families (PDE4, PDE7, and PDE8), cGMP-specific families (PDE5, PDE6, and PDE9) as well as PDEs families with dual specificity (PDE1, PDE2, PDE3, PDE10, and PDE11).5,6 Since each family posses unique tissue distribution, substrate specificity and functional properties, their inhibition can result in different biological outcomes.7–14 In addition, PDE4 isoforms are mainly expressed in inflammatory and immune cells and are known to be involved in disorders such as asthma and COPD. Therefore, developing PDE4-selective inhibitors for such disorders has been of great interest to pharmaceutical companies. Two advanced inhibitors named cilomilast and roflumilast are in their phase III clinical trials.5,15–18 Furthermore, due to promising clinical advancements in developing PDE4 inhibitors, there is also a great appeal growing towards developing specific inhibitors against PDE4 subfamilies including PDE4B and PDE4D.Previous investigations have shown that selective inhibition of PDE4D is associated with a reduction of inflammation and improvement of cognition, while PDE4B-selective inhibitors seem to be potent therapeutics for allergic inflammation and asthma.19–27 It has also been shown that people with mutations or single-nucleotide polymorphisms (SNPs) in their PDE4D are engaged with acrodysostosis25 and ischaemic stroke26 whereas PDE4B SNPs coupled with low levels of PDE4B expression are associated with schizophrenia.27 Other studies with knockout mice proposed that the development of PDE4B-selective inhibitors for use in asthma and other inflammation-related diseases can cause fewer side effects as compared to classical PDE4 inhibitors.28 To sum up, since the PDE4 subfamily are involved in different signalosomes within different subcellular compartments, the development of specific therapeutics and the design of novel isoform-selective inhibitors seem highly necessary. Therefore, in order to investigate the selectivity, the interaction space of multiple compounds across multiple proteins should be analyzed.
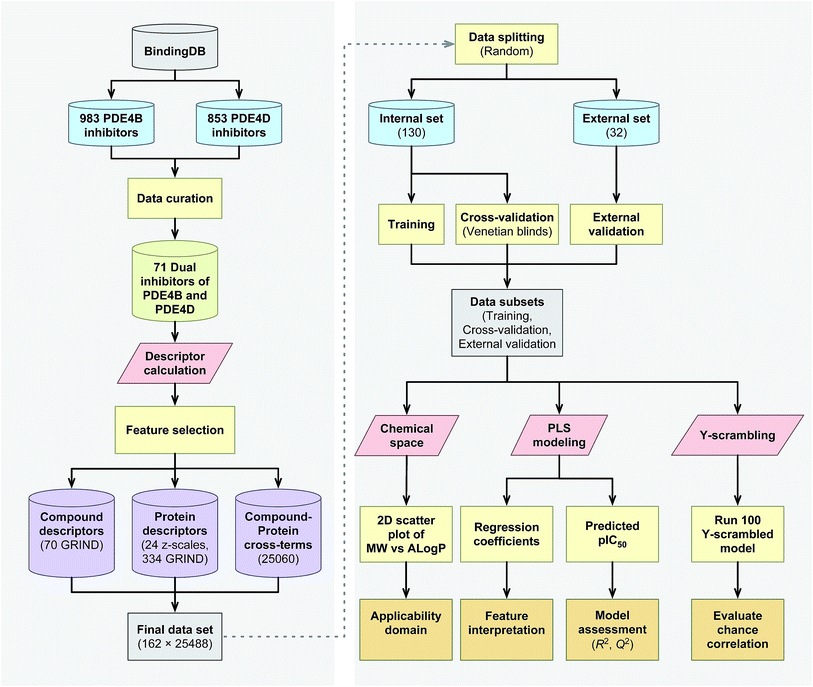
The proteochemometrics (PCM) approach fulfills this goal by correlating both compound and protein descriptions with biological activities.29 Due to the crucial physiological impact resulted upon selective inhibition of different PDE4 subclasses, as well as owing to the fact that there have been no PCM studies regarding the PDE family as yet, therefore, here for the first time we applied the PCM approach to study the interaction space of PDE4 subfamilies and their inhibitors. In addition, thus far PCM have been successfully applied to investigate protein families such as G protein-coupled receptors,30,31 proteases,32,33 kinases,34–36 antibodies,37 cytochrome P450![[thin space (1/6-em)]](https://www.rsc.org/images/entities/char_2009.gif) 38,39 and carbonic anhydrase.40,41 While the majority of these researches have used sequence based descriptors for describing proteins, whereby the latter has shown a positive impact on molecular interaction field (MIF) based descriptors called GRid-INdependent Descriptors (GRIND) on modeling and on the significance of using z scales-GRINDs combinatorial descriptors.41 Hence, in the present study, we developed a unified PCM model with the combination of z scales and MIF-based GRIND to investigate the interaction space and the selectivity between two subfamilies of PDE4 (PDE4B and PDE4D) and a series of their inhibitors. This approach provides the ability to find differential structural features that can be taken into consideration for designing compounds with better selectivity towards PDE4B and PDE4D. The flowchart for PCM modeling of the compound–protein interaction space is represented in Fig. 1.
38,39 and carbonic anhydrase.40,41 While the majority of these researches have used sequence based descriptors for describing proteins, whereby the latter has shown a positive impact on molecular interaction field (MIF) based descriptors called GRid-INdependent Descriptors (GRIND) on modeling and on the significance of using z scales-GRINDs combinatorial descriptors.41 Hence, in the present study, we developed a unified PCM model with the combination of z scales and MIF-based GRIND to investigate the interaction space and the selectivity between two subfamilies of PDE4 (PDE4B and PDE4D) and a series of their inhibitors. This approach provides the ability to find differential structural features that can be taken into consideration for designing compounds with better selectivity towards PDE4B and PDE4D. The flowchart for PCM modeling of the compound–protein interaction space is represented in Fig. 1.
Materials and methods
Data set
The bioactivities of compounds were obtained from the BindingDB,42,43 which is a publicly available database containing nearly 20![[thin space (1/6-em)]](https://www.rsc.org/images/entities/char_2009.gif) 000 experimentally determined bioactivities of compound–protein complexes. There are 983 and 853 biological activities deposited in the BindingDB for PDE4B and PDE4D, respectively. Some of the data belongs to organisms other than humans and some do not have valid compound IDs. In some cases the reported activity has neither the type of interest nor an exact measured value (e.g. IC50 > 1000). There are also some cases in which the activity of an inhibitor is reported for one of the PDE4 isoforms. After initial filtration of the data set according to the points mentioned above, a set of 71 compounds with inhibitory data available for both PDE4B and PDE4D was selected based on the following extra filtration steps: (i) the difference between their inhibitory powers (i.e. IC50 of nanomolar potency) for the two isoforms of PDE was less than or equal to 2-fold. In other words, we made sure that the chosen compounds were not selective inhibitors in the case of isoforms PDE4B and PDE4D, (ii) compounds with more than one value reported for their IC50 were removed from the data set. Inhibitory activities of compounds were converted to pIC50 (−log
000 experimentally determined bioactivities of compound–protein complexes. There are 983 and 853 biological activities deposited in the BindingDB for PDE4B and PDE4D, respectively. Some of the data belongs to organisms other than humans and some do not have valid compound IDs. In some cases the reported activity has neither the type of interest nor an exact measured value (e.g. IC50 > 1000). There are also some cases in which the activity of an inhibitor is reported for one of the PDE4 isoforms. After initial filtration of the data set according to the points mentioned above, a set of 71 compounds with inhibitory data available for both PDE4B and PDE4D was selected based on the following extra filtration steps: (i) the difference between their inhibitory powers (i.e. IC50 of nanomolar potency) for the two isoforms of PDE was less than or equal to 2-fold. In other words, we made sure that the chosen compounds were not selective inhibitors in the case of isoforms PDE4B and PDE4D, (ii) compounds with more than one value reported for their IC50 were removed from the data set. Inhibitory activities of compounds were converted to pIC50 (−log![[thin space (1/6-em)]](https://www.rsc.org/images/entities/char_2009.gif) IC50 × 10−9) and the values are available in a CSV file provided on GitHub at https://github.com/chaninn/PDE4/.
IC50 × 10−9) and the values are available in a CSV file provided on GitHub at https://github.com/chaninn/PDE4/.
Protein descriptors
Structures of human PDE4B (PDB ID: 3O0J) and PDE4D (PDB ID: 2PW3) were obtained from the Protein Data Bank (Fig. 10). Available PDB structures for PDE4B and PDE4D represent the catalytic domain of the proteins. Since GRIND descriptors are extracted from the 3D structures of proteins, the presence of the missing residues in the PDB files can negatively affect the process of descriptor calculation. Therefore, we chose 3O0J and 2PW3 structures as there were no missing residues reported in their PDB files. In addition, since 2PW3 represents the structure of PDE in complex with its native substrate, we used 2PW3 as the reference structure to extract those residues that make up the enzyme's cavity and have the potential to interact with the compounds. From the center of the cAMP, a cutoff of 10 Å was used and those residues falling within the applied cutoff were considered as compound interacting residues. The sequence of 3O0J was then aligned using Clustal Omega web server, version 1.2.4![[thin space (1/6-em)]](https://www.rsc.org/images/entities/char_2009.gif) 44 and cavity amino acids were identified in correspondent positions for the PDE4B isoform (Fig. 2). In accordance with our previous work,41 albeit slight changes, we modified the ALMOND algorithm and introduced an ALMOND-like algorithm with the ability to calculate the GRIND descriptors for complex structures such as protein cavity. Briefly, our algorithm works by following 3 steps: (i) calculating MIFs using the program GRID45 and finding the points with favorable interaction energies, (ii) reducing the points to those showing the best interaction energies, using the genetic algorithm.46,47 Both the intensity of a point and the mutual node–node distances between the selected points are considered in the filtering process, (iii) for each MIF pairs of interaction, energies are multiplied and the greatest product is kept for each internode distance. This way a set of the chosen node is converted to a set of descriptors.
44 and cavity amino acids were identified in correspondent positions for the PDE4B isoform (Fig. 2). In accordance with our previous work,41 albeit slight changes, we modified the ALMOND algorithm and introduced an ALMOND-like algorithm with the ability to calculate the GRIND descriptors for complex structures such as protein cavity. Briefly, our algorithm works by following 3 steps: (i) calculating MIFs using the program GRID45 and finding the points with favorable interaction energies, (ii) reducing the points to those showing the best interaction energies, using the genetic algorithm.46,47 Both the intensity of a point and the mutual node–node distances between the selected points are considered in the filtering process, (iii) for each MIF pairs of interaction, energies are multiplied and the greatest product is kept for each internode distance. This way a set of the chosen node is converted to a set of descriptors.
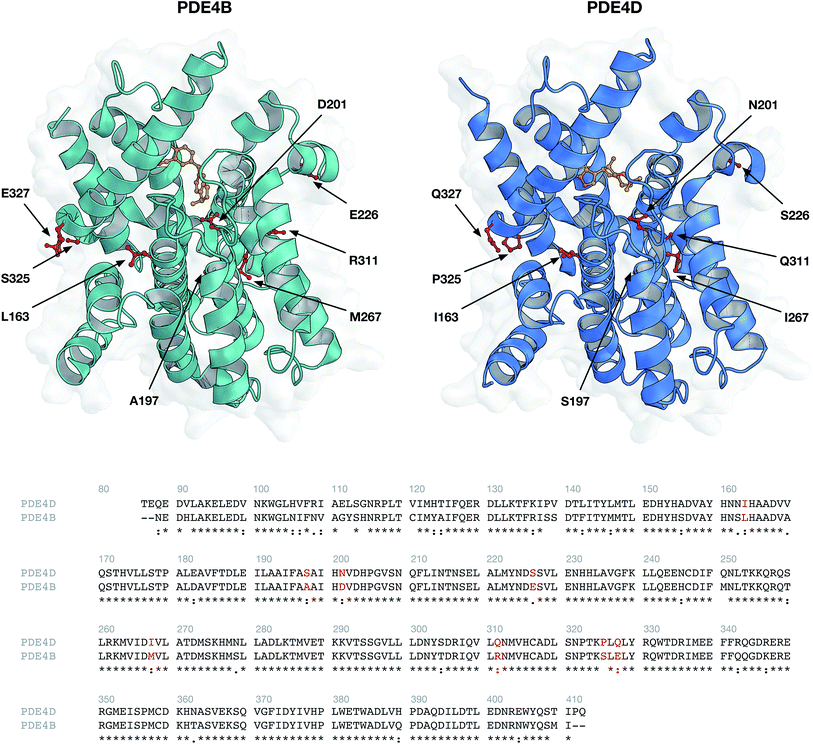 | ||
| Fig. 2 Protein structures (top panel) and sequence alignment (bottom panel) of investigated phosphodiesterase isoforms PDE4B (PDB ID: 3O0J) and PDE4D (PDB ID: 2PW3). Environmental residues (indicated by red colored residues in the top panel and red text in the bottom panel) surrounding the cAMP substrate (colored orange) were selected for further descriptor generation. | ||
DRY (–CH3), O (carbonyl oxygen), N1 (amide nitrogen) and TIP probes were used for computing the MIFs. These probes are representatives for hydrophobic interactions, hydrogen bond acceptors, hydrogen bond donors and molecular shape, respectively. A grid spacing of 0.5 Å was applied while the center and size of the GRID box were adjusted to cover all compound interacting residues. The following parameters were applied in the case of the genetic algorithm: (i) population size of 200, (ii) maximum generation of 200, (iii) two-point crossovers with the rate of 0.8, and (iv) mutations with the rate of 0.01. Regarding each MIF, 2000 nodes were extracted and the smoothing window of 0.2 Å was used, resulting in 224 descriptors for each auto/cross MIF–MIF multiplication. Since we applied four types of probes (resulting in a final number of 10 auto/cross MIF–MIF combinations), the total number of 2240 descriptors for each protein isoform were calculated. Descriptors showing the same value for PDE4B and PDE4D were removed, resulting in the final number of 2200 descriptors for each protein isoform.
z-Scales were calculated for non-conserved compound interacting residues (8 residues). These residues were encoded by three z-scale descriptors (z1, z2 and z3), as derived by Sandberg et al.,48 representing hydrophobicity, size/polarizability and polarity, respectively. Using these three z-scale descriptors we reached a total number of 8 × 3 = 24 descriptors for each protein.
Compound descriptors
Structures were obtained from ZINC website.49,50 All geometries were optimized using SYBYL version 7.3![[thin space (1/6-em)]](https://www.rsc.org/images/entities/char_2009.gif) 51 and the Tripos force field was applied with a distance-dependent dielectric and the Powell conjugate gradient algorithm convergence criterion of 0.01 kcal mol−1 Å−1. To calculate the partial atomic charges, the Gasteiger–Huckel method was used. GRIND 3D descriptors were calculated using the same algorithm as the one applied for calculating the descriptors of PDEs. The following modifications were considered when compared to proteins, (i) the GRID box was adjusted in a way that the whole compound was placed within, (ii) since the structure of compounds are less complex when compared to that of proteins, the number of extracted nodes and smoothing window were 100 and 0.4 Å for each MIF, respectively. As there are ten descriptor types (i.e. DRY–DRY, O–O, N1–N1, etc.) and each descriptor type has 62 distance iterations (starting from 0.4 and ending at 0.4 × 62 = 24.8), therefore upon applying the mentioned parameters, a final set of 620 descriptors was obtained for compounds. Descriptors showing the same value for all compounds were removed thereby resulting in a final number of 495 descriptors for each inhibitor.
51 and the Tripos force field was applied with a distance-dependent dielectric and the Powell conjugate gradient algorithm convergence criterion of 0.01 kcal mol−1 Å−1. To calculate the partial atomic charges, the Gasteiger–Huckel method was used. GRIND 3D descriptors were calculated using the same algorithm as the one applied for calculating the descriptors of PDEs. The following modifications were considered when compared to proteins, (i) the GRID box was adjusted in a way that the whole compound was placed within, (ii) since the structure of compounds are less complex when compared to that of proteins, the number of extracted nodes and smoothing window were 100 and 0.4 Å for each MIF, respectively. As there are ten descriptor types (i.e. DRY–DRY, O–O, N1–N1, etc.) and each descriptor type has 62 distance iterations (starting from 0.4 and ending at 0.4 × 62 = 24.8), therefore upon applying the mentioned parameters, a final set of 620 descriptors was obtained for compounds. Descriptors showing the same value for all compounds were removed thereby resulting in a final number of 495 descriptors for each inhibitor.
Feature selection
Feature selection was applied to select the best fitted GRIND descriptors. GA-PLS consists of three basic steps: (i) generation of the initial chromosomes. Each chromosome contains different genes representing the presence/absence of a variable, (ii) calculation of Q2 parameter to evaluate the fitness of each chromosome, (iii) reproduction in which processes such as crossing-over and mutation were carried out. Steps (ii) and (iii) continues until the designated number of generations was achieved.47,52 PLS Toolbox 3.5![[thin space (1/6-em)]](https://www.rsc.org/images/entities/char_2009.gif) 53 was used and the genetic algorithm with default parameters was applied on both the compound and protein descriptors. The final numbers of 70 and 334 GRINDs were selected by the genetic algorithm for compounds and proteins, respectively.
53 was used and the genetic algorithm with default parameters was applied on both the compound and protein descriptors. The final numbers of 70 and 334 GRINDs were selected by the genetic algorithm for compounds and proteins, respectively.
Compound–protein cross-terms
In the present study, cross-terms are simply mathematical products of the compound descriptors with those of the proteins, representing the interaction space between compounds and proteins. Since compound and protein descriptors are 70 and 358 (24 z-scales + 334 GRINDs) respectively, the total number of cross-terms for each compound–protein complex is 25![[thin space (1/6-em)]](https://www.rsc.org/images/entities/char_2009.gif) 060 (70 × 358). All descriptors were mean-centered and scaled to unit variance before cross-terms calculation. To prevent small blocks of descriptors being masked by large ones, we used block-scaling.
060 (70 × 358). All descriptors were mean-centered and scaled to unit variance before cross-terms calculation. To prevent small blocks of descriptors being masked by large ones, we used block-scaling.
Multivariate modeling
Descriptors of the compounds, protein cavity residues and their cross-terms were correlated to the pIC50s using partial least squares (PLS) regression. Briefly, PLS correlates the X matrix of predictors with the Y response variables by simultaneously projecting them to the PLS components and finding linear relationships between them. PLS modeling was performed using PLS Toolbox 3.5. The optimal number of latent variables to use for the construction of the PCM model was selected according to the method of Haaland and Thomas,54 which resulted in the use of 14 latent variables.For a PCM model consisting of P protein descriptors, L compound descriptors and C × P cross-terms, the regression equation is expressed as follows:
 | (1) |
 represents the average pIC50; Dc and Dp represent compound descriptors and protein descriptors, respectively; Cc, Cp and Ccp are regression coefficients of compound descriptors, protein descriptors and compound–protein cross-terms, respectively.
Model validation
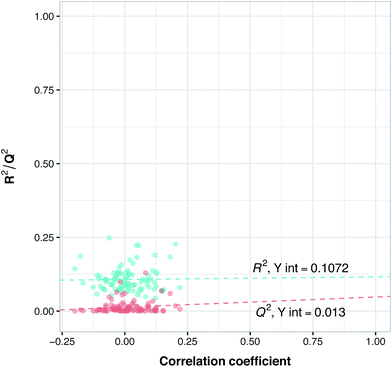
To assess the ability of the model for predicting the IC50 of a new compound, data splitting was applied to select 20% as an external set while using 80% as the internal set. This study makes use of two types of external set that are termed as follows: (i) external-compounds and (ii) external-complexes. In the former, 12 compound–protein complexes were randomly excluded from the modeling process while in the latter 10 compounds (and its associated bioactivity against the two isoforms, which results in 20 bioactivity data points or compound–protein complexes) were excluded as the external set. Since information related to these complexes has not been seen in the PLS model, it is assumed that they could not have had an influence on the PLS model. Thus, we applied these two external sets consisting of 32 compound–protein complexes (making up the 20% subset) to evaluate the extrapolation capability of the model whereas the internal set consisting of 130 compound–protein complexes (constituting the 80% subset) was evaluated for its intrapolation capability. Thus, the internal set was used as both a training set as well as subjected to Venetian blinds cross-validation (VB-CV). Furthermore, the predictive model trained using the internal set was applied on the external sets as to evaluate the general assessment of the model's predictive power in regards to its bioactivity and selectivity toward new compounds.Y-Scrambling was applied to test the robustness of the models. In this approach the variable Y is randomly shuffled, and a new model with scrambled data is generated to ensure the robustness of the PCM models and to rule out the possibility of chance correlations. Therefore, we built 100 new models using randomly shuffled variable Y. The R2 and Q2 values of scrambled and unscrambled models were plotted versus correlation coefficients between original and scrambled Y values. Regression line was conducted and the intercepts for R2 and Q2 (R2 intercept and Q2 intercept) were calculated.
Previous studies have revealed that in order to ensure the robustness of the models and to rule out the possibility of chance correlations, the R2 intercept and the Q2 intercept should not exceed 0.3 and 0.05, respectively.55 Along with these validations, we randomly selected from BindingDB 10 new compounds with different selectivity for PDE4B and PDE4D and used this set as an external set to validate the power of the model for selectivity prediction of new inhibitors. Since information related to these compounds have not been used in the PLS model, this way we could make sure of the reliability of our model for predicting the selectivity of newly designed inhibitors, which we term the external-compound set.
Applicability domain analysis
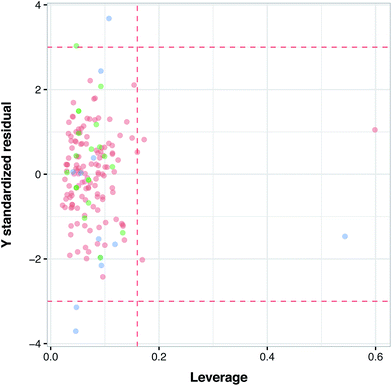
Applicability domain (AD) was applied to estimate the likelihood of reliable prediction for the investigated compounds. The uncertainty of predictions refers to the number of compounds falling outside the AD. The most popular method for determining AD was described by Gramatica et al.56 and Tropsha et al.,57 which encompasses the computation of leverage values for each investigated compound. Using the leverage value we can identify whether a new compound falls within or outside the domain. Leverage values are calculated via adjustment of X as to yield the hat matrix H:| H = X(XTX)−1XT | (2) |
| hi = xTi(XTX)−1xi | (3) |
| h* = 3(p + 1)/n | (4) |
The leverage value along with the William's plot is usually applied to assess the AD of QSAR models. The William's plot is built by depicting the standardized residuals versus the leverage value for each compound's hi. If the ith compound has hi > h* then it means that the ith compound applies a great impact on the QSAR model and may be excluded from the AD.
Contribution of compound properties to protein selectivity
Since the significance of a compound descriptor to protein selectivity can be obtained from coefficients of cross-terms involving descriptors of interest, we applied the following equation to assess the contribution of a GRIND descriptor to the selectivity for a particular protein isoform.
 | (5) |
Results and discussion
Non-specific inhibitors may inhibit several isoforms of phosphodiesterase, resulting in toxic side effects. Regarding the inhibition of PDE4D isoform in particular, with available developed inhibitors of PDE4, there are findings which suggest that inhibition of PDE4D is associated with the dose-limiting gastrointestinal side effects, while PDE4B seems to play major roles in activation of the T-cell receptor.5,28,58–60 These investigations and studies similar to them, can justify the rational for the development of selective inhibitors for PDE4B and PDE4D. While the former can act as potential therapeutics for allergic inflammation and asthma,20 the latter can reduce inflammation and improve cognition.61 Since PDE4B and PDE4D are subclasses of PDE isoform 4, the sequences of their catalytic domains are substantially conserved and indeed their structures are highly similar. Therefore, designing compounds with the ability of discriminating one subclass from the other is a significantly challenging task. Considering that the properties of proteins are exploited in addition to the features of compounds in PCM modeling, PCM models would be able to catch differences in patterns of chemical interactions with regard to different compound–protein complexes. Furthermore, in the case of isoforms and their subclasses (e.g. PDE4) which show high sequence/structural similarities, PCM can catch chemical space differences, even those raised by the slightest sequence/structural dissimilarities. Therefore, using the PCM approach, we could capture some structural features that can be considered while designing compounds with higher selective tendencies towards a specific subclass of PDE4.PCM modeling and assessment of the model validity
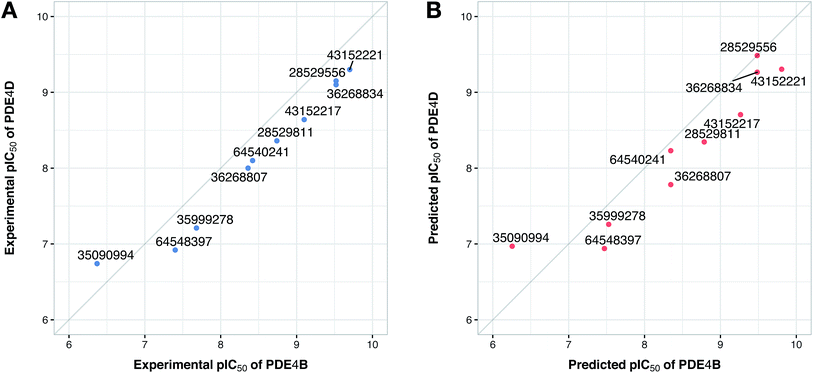
Since the positive impact of GRIND descriptors on modeling and the significance of using z-scale-GRIND combinatorial descriptors have been already confirmed,41 we applied a combination of z-scale descriptors and GRIND descriptors in our modeling. Prior to modeling, feature selection was carried out with regard to GRIND descriptors using genetic algorithm in order to find the best fitted structural descriptors. Subsequently, 70 and 334 features were selected for compounds and proteins, respectively. In addition to GRIND descriptors, 3 z-scale descriptors were calculated in the case of proteins, resulting in a total number of 358 descriptors per protein isoform. z-Scale are the result of principal component analysis (PCA) performed on physicochemical properties of 87 natural/artificial amino acids. The first three PCs, called z1, z2 and z3, are the representatives of the largest variations of physicochemical properties. Correlation between the descriptor matrix (consisting of compound descriptors, protein descriptors and their cross-terms) and biological activities (pIC50s) were made using PLS.Prior to modeling, a set of 12 randomly selected complexes were left out. We used this set in addition to 10 new compounds as an external set to validate the predictivity power of the model for activity and selectivity of new compounds. The resulting PCM model passed all the internal and external validation tests. Excellent values were observed for R2 (0.99), Q2 (0.92) and Q2 pred (0.97), which are the indices for training, cross-validation and external cross-validation, respectively. Fig. 3 shows the experimental pIC50 values for the 32 complexes plotted versus their predicted values, revealing the highly effective predictivity power of the model. Moreover, 10 new compounds with activity against both isoforms were also randomly selected from the structure IDs deposited in the BindingDB (chemical structures along with their pIC50 values for PDE4B and PDE4D are provided as Data S4, Data S5 and Data S6, respectively). Prior to descriptor calculation, compounds geometries were optimized using SYBYL 7.3 (see the Methods for details). Comparing Fig. 4A with Fig. 4B reveals that not only is our model excellently able to predict the most active (43152221, 28529556 and 36268834) and the least active (35090994, 64548397 and 35999278) compounds, but is also capable of predicting the selectivity trend of new compounds towards PDE4B and PDE4D (with the exception of compound 28529556) most marvelously. Finally, the results of the Y-scrambling test (R2 intercept of 0.05 and Q2 intercept of −0.04) was able to confirm the robustness of the model (Fig. 5).
 | ||
| Fig. 3 Plots of experimental versus predicted pIC50 values for the training, cross-validation and external (external-compound and external-complex) sets. | ||
Applicability domain
Fig. 6 illustrates the applicability domain (AD) of the PCM model as defined by the Williams plot. The entire data set was split into two sets consisting of internal (80%) and external (20%) subsets, as described earlier in the Materials and methods section. As can be seen in the Williams plot, nearly all compounds are located within the boundaries of the applicability domain thereby suggesting a well-defined AD for the proposed PCM model.Model interpretation and analyzing the contribution of compound properties for protein isoform selectivity
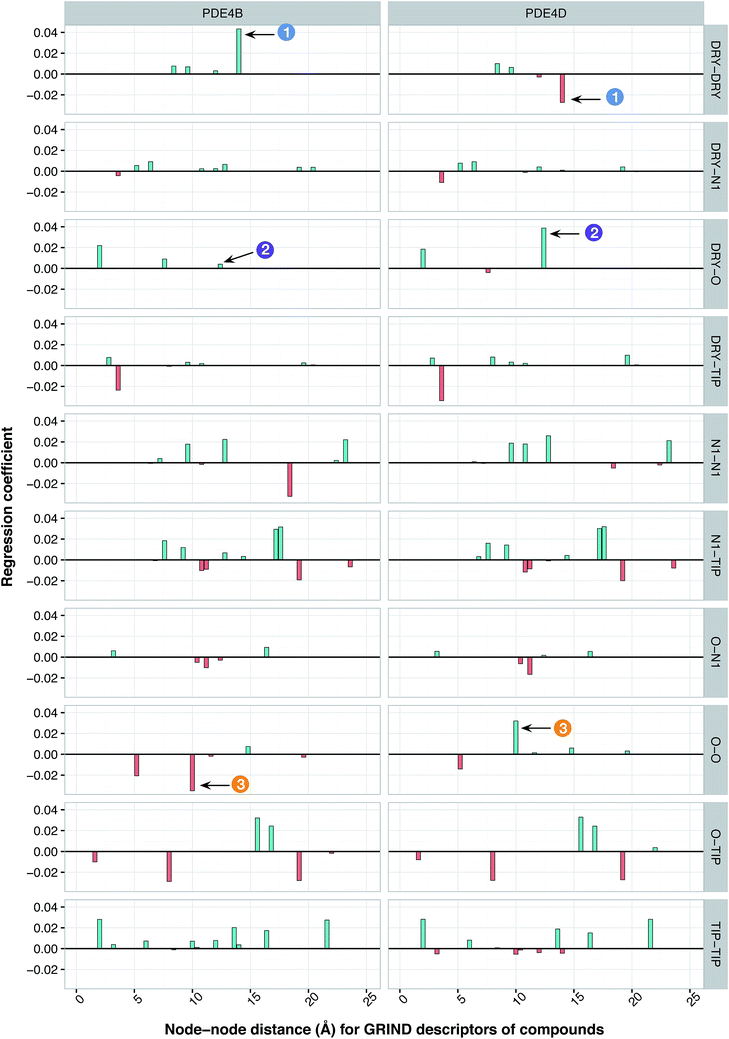
It has been shown by several X-ray crystallography investigations5,14,62 that aromatic–aromatic interaction plays a major role in the average affinity of compounds toward the PDE4 isoforms. This is to be expected since nearly all available inhibitors are engaged in interacting with more than one aromatic ring and there is a considerable distribution of residues with aromatic side chains (e.g. Phe, Tyr and Trp) inside the protein cavity as well. Contribution of compound descriptors to the protein selectivity was assessed based on the measurements. Since Δycp can be considered as a regression coefficient of a GRIND descriptors for a specific protein isoform, comparing values for different protein isoforms can assess the impact of that specific compound property to their selectivity for a specific protein isoform. Fig. 7 illustrates the values for structural descriptors of compounds (selected by genetic algorithm) with regards to PDE4B and PDE4D. The X-axis tick labels represent a distance range from 0 Å to 24.8 Å. Some structural descriptors, showing highly discriminative behavior towards different isoforms of PDE4, are indicated in the figure and will be discussed in details.DRY–DRY descriptor at distance of 14 Å
According to the unified PLS model, the DRY–DRY descriptor shows a significantly positive coefficient at the distance of 14 Å with regard to isoform PDE4B, in particular (Fig. 7, arrow 1). Comparing the chemical space of the enzymes cavities revealed the position where A197 in PDE4B is substituted by Ser in PDE4D. A closer look further revealed the presence of a hydrophobic residue (position 163) in the distance of almost 14 Å from position 197 of both cavities (Fig. 8A). Seeing that, Ser cannot be involved in hydrophobic interactions, this finding is highly compatible with the PLS coefficient of the DRY–DRY descriptor which is only positive for isoform PDE4B. Based on the PLS coefficient for the DRY–DRY descriptor and the structural evidence, our finding suggests that compounds having dual hydrophobic moieties with a distance of nearly 14 Å in their structures might show higher selectivity towards PDE4B. Fig. 8A clearly highlights the important role of hydrophobic–hydrophobic interactions toward selectivity.O–O descriptor at distance of 10 Å
It seems that mutations in positions 197 and 201 are significantly critical for compound–protein selectivity, as they are captured twice by our PLS model. As clearly shown in Fig. 7 (arrow 3), a highly positive coefficient for the O–O descriptor exists at a distance of 10 Å with regard to PDE4D, while the correspondent descriptor is significantly negative for PDE4B. In addition, structural inspection of the enzymes cavities revealed that there is a spatial distance of 10 Å between the side chains of positions 197 and 201 (Fig. 8B). While these positions are occupied by Ser and Asn (both having side chains capable of accepting hydrogen bond) in PDE4D, the S197A substitution renders the O–O descriptor unfavorable in the case of PDE4B. This finding suggests that compounds with dual hydrogen donor moieties, located at a distance of 10 Å from each other, can possibly fit better in the cavity of PDE4D rather than in the cavity of PDE4B. Out of the plenty amino acids involved in the cavities of PDE4B and PDE4D, only 8 positions are not conserved. This definitely strengthens the necessity of applying these differences for the modeling process, as a few of them captured by our model has given a rise to valuable information.DRY–O descriptor at distance of 12.4 Å
Inspecting the PLS coefficients revealed the presence of a significantly positive coefficient for DRY–O descriptor at a distance of 12.4 Å with regard to PDE4D, while the correspondent descriptor is hardly considerable for PDE4B (Fig. 7, arrow 2). The structural analysis showed that the spatial distance between positions 201 and 267 of the enzyme cavity (12.7 Å) is very close to that of the highly positive DRY–O descriptor (Fig. 8C). Based on the positive PLS coefficient and the similar distance between positions 201 and 267, it seems that the I267M substitution (i.e. Ile is much more hydrophobic than Met) in PDE4B causes the inefficiency of the mentioned DRY–O descriptor in this isoform. Therefore, it is expected that inhibitors with dual hydrophobic/hydrogen donor moieties, placed in a distance close to that of the DRY–O descriptor, show better selectivity for isoform PDE4D.Applicability of the model and the design of new inhibitors
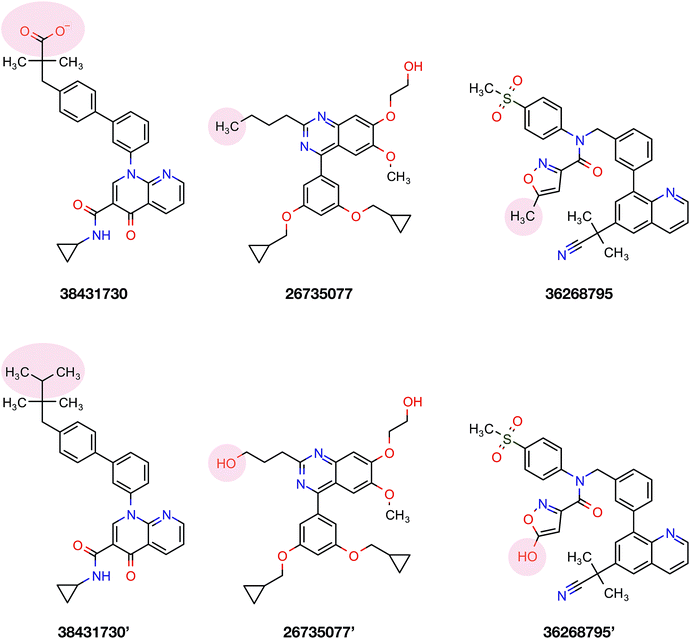
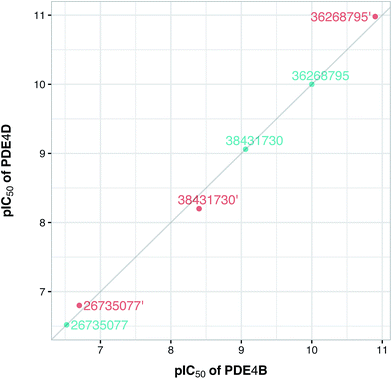
To confirm the applicability of the PLS model and to show the impact of the differential descriptors on the selectivity, a few compounds were designed by modifying the studied inhibitors. The following criteria were considered for the selection of template compounds: (i) the selected compounds have exactly the same values of IC50 for PDE4B and PDE4D. This would make it easier to compare the changes in the predicted pIC50 values. (ii) The selected compounds lack the structural descriptor whose role is being studied. In this respect, the impact of a descriptor on the change of the pIC50 could be easily investigated by producing the desired descriptor values via modification of the compound structure. According to the mentioned criteria, inhibitors with ZINC IDs of 38431730, 26735077 and 36268795 were selected as template structures for applying structural modifications, which corresponded to DRY–DRY, DRY–O and O–O descriptors, respectively. As is illustrated in Fig. 9, the following structural modifications were applied on each compound in order to create the descriptors being investigated here: (i) in order to make a DRY–DRY descriptor at a distance of 14 Å for 38431730, we substituted the carboxyl group by two methyl moieties (38431730′), (ii) the DRY–O descriptor at a distance of 12.4 Å was created for 26735077 by converting the methyl group of the hydrocarbon chain to hydroxyl moiety (26735077′), (iii) the final modification was performed on 36268795 in order to provide this compound with the O–O descriptor at a distance of 10 Å. To do so, the methyl group linked to the five-membered ring was replaced by a hydroxyl group (36268795′). The designed compounds were subsequently put in the test set in order to predict their new biological activity.Fig. 10 shows the predicted pIC50 for each compound against PDE4B and PDE4D. Comparing the predicted pIC50 values with the experimental ones reveals that the selectivity ratios of modified inhibitors have been altered according to our expectations. As shown, the selectivity ratio of 38431730, whose carboxylate moiety was substituted by two methyl groups as to generate the DRY–DRY descriptor of 38431730′, has been changed in favor of the PDE4B. In the case of 26735077 and 36268795 however, the derivatives 26735077′ and 36268795′ were in favor of increasing the selectivity ratios towards the PDE4D, as expected. Taken together, the results obtained by the compound design are indicative of the reliability of the proposed PCM model. Moreover, all three descriptors appears to be critical for the selective inhibition of PDE4B over PDE4D and vice versa.
Conformational difference of PDE4B and PDE4D
According to data collected from the crystal structure of PDE4B, it has been suggested that regions of the enzyme corresponding to the cavity's residues are highly flexible.63,64 Particularly, results provided by crystallographic studies of PDE4 isoforms in complex with their inhibitors have revealed that despite the same observed pattern of compound–residue interactions, there exists a significant conformational difference. Interestingly, the average B-factor of the PDE4B structure was found to be higher than that of the PDE4D structure. Particularly, it can be seen that there exists a higher degree of conformational flexibility in the cavity of PDE4B when compared to that of PDE4D as shown in Fig. 11. Conformational variations reported for PDE4B and PDE4D can be attributed to available mutations in their sequences. For instance, it is known that T436 (PDE4B)/N362 (PDE4D) mutation causes variation in conformational properties of cavity residues followed by changes in the pattern of H-bonding interactions.62 It has also been shown that the active site of PDE4B is more hydrophobic in nature than that of PDE4D thereby suggesting that attention to the hydrophobic pocket can lead to effective subtype selective inhibitors.62 This coincides with the results presented herein, which also suggests the crucial roles played by hydrophobic interactions along with some characteristic H-bond patterns in attaining the subtype selectivity. A close look at designed compounds proposed herein revealed that the substitution of a polar group with a hydrophobic one (e.g. hydroxyl/methyl) can alter the subtype selectivity in favor of PDE4B and vice versa when a hydrophobic moiety is replaced by a polar one (e.g. methyl/hydroxyl) (Fig. 9 and 10).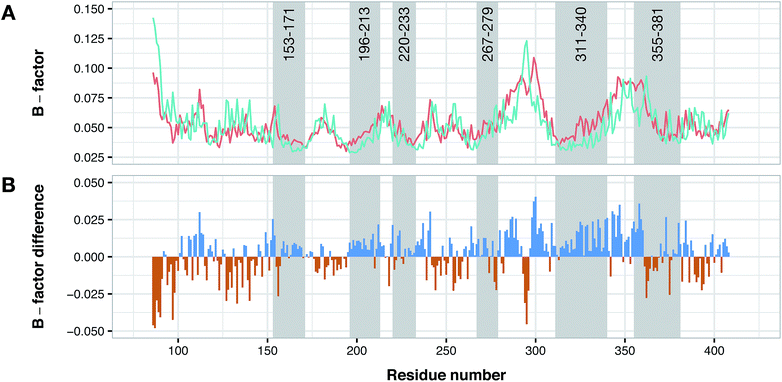 | ||
| Fig. 11 Conformational analysis of PDE4B and PDE4D as assessed by B-factor values derived from their X-ray crystallographic structure. Panel (A) shows the normalized B-factor values of each residues of PDE4B and PDE4D while panel (B) shows the difference in the B-factor values in which blue and red bars correspond to flexible residues in PDE4B and PDE4D, respectively. Residue numbers are based on PDE4D (PDB ID: 2PW3) while gray shaded areas correspond to cavity residues. | ||
Conclusion
Due to the involvement of PDE4 subfamilies in major clinical disorders such as asthma, acrodysostosis, cognition disorder and schizophrenia, the necessity for the discovery of novel compounds with strong inhibitory properties towards these subfamilies is substantially growing. However, since the engagement of these subfamilies differs with regard to different disorders and subcellular compartments, developing new inhibitors without considering their selectivity properties can lead to undesirable side effects. Particularly, in cases similar to what is being presented here, when structural and sequence similarities of proteins are significant, the discovery of new selective inhibitors could be much more challenging. One way to overcome this issue is by applying the PCM approach in which the model takes in to account protein-based information, which in turn provides the opportunity of investigating the compound–protein interaction space in greater detail and thereby supporting the discovery of new selective inhibitors. Therefore, we investigated the interaction space and the selectivity properties that govern the inhibition of PDE4B and PDE4D by applying the PCM approach. Furthermore, utilizing the combination of z-scales and MIF-based GRIND descriptors, we found that specific structural features such as the presence of dual hydrophobic moieties at certain distances are crucial for selectivity properties. Aside from the critical role of hydrophobic–hydrophobic interactions in selectivity, other types of interactions such as hydrogen bonds with characteristic patterns were also found to be play an important role in governing the selectivity of compounds towards a specific receptor. The ability of the presented PCM model for capturing all of these discriminative structural details can be attributed to the consideration of the protein's structural/sequence differences in the model. In this manner, we were able to discover that substitutions such as A197S and I267M can influence the interaction space of investigated PDE4 and compounds. Finally, we believe that our findings can be taken into consideration for designing compounds with better selectivity towards either PDE4B or PDE4D.Acknowledgements
This research is supported by a Research Career Development Grant (No. RSA5780031) and the Swedish Research Links program (No. C0610701) from the Swedish Research Council to CN.References
- V. C. Manganiello, F. Ahmad, Y. H. Choi, Y. Tang, R. Lindh, E. Zmuda-Trezbiatowska, H. Walz, H. Liu, H. L. Stenson and E. Degerman, in Phosphodiesterase and Intracellular Signaling, Mie University Press, Mie, Japan, 2007, pp. 101–125 Search PubMed.
- E. J. Tsai and D. A. Kass, Pharmacol. Ther., 2009, 122, 216–238 CrossRef CAS PubMed.
- S. H. Francis, M. A. Blount and J. D. Corbin, Physiol. Rev., 2011, 91, 651–690 CrossRef CAS PubMed.
- A. T. Bender and J. A. Beavo, Pharmacol. Rev., 2006, 58, 488–520 CrossRef CAS PubMed.
- D. H. Maurice, H. Ke, F. Ahmad, Y. Wang, J. Chung and V. C. Manganiello, Nat. Rev. Drug Discovery, 2014, 13, 290–314 CrossRef CAS PubMed.
- F. Ahmad, T. Murata, K. Shimizu, E. Degerman, D. Maurice and V. Manganiello, Oral Dis., 2015, 21, 25–50 CrossRef PubMed.
- Y. H. Jeon, Y. S. Heo, C. M. Kim, Y. L. Hyun, T. G. Lee, S. Ro and J. M. Cho, Cell. Mol. Life Sci., 2005, 62, 1198–1220 CrossRef CAS PubMed.
- K. Omori and J. Kotera, Circ. Res., 2007, 100, 309–327 CrossRef CAS PubMed.
- M. Zaccolo and M. A. Movsesian, Circ. Res., 2007, 100, 1569–1578 CrossRef CAS PubMed.
- H. Ke and H. Wang, Curr. Top. Med. Chem., 2007, 7, 391–403 CrossRef CAS PubMed.
- J. Hou, J. Xu, M. Liu, R. Zhao, H. B. Luo and H. Ke, PLoS One, 2011, 6, e18092 CAS.
- F. Meng, J. Hou, Y. X. Shao, P. Y. Wu, M. Huang, X. Zhu, Y. Cai, Z. Li, J. Xu, P. Liu, H. B. Luo, Y. Wan and H. Ke, J. Med. Chem., 2012, 55, 8549–8558 CrossRef CAS PubMed.
- S. K. Chen, P. Zhao, Y. X. Shao, Z. Li, C. Zhang, P. Liu, X. He, H. B. Luo and X. Hu, Bioorg. Med. Chem. Lett., 2012, 22, 3261–3264 CrossRef PubMed.
- Z. Li, Y. H. Cai, Y. K. Cheng, X. Lu, Y. X. Shao, X. Li, M. Liu, P. Liu and H. B. Luo, J. Chem. Inf. Model., 2013, 53, 972–981 CrossRef CAS PubMed.
- T. J. Torphy, Am. J. Respir. Crit. Care Med., 1998, 157, 351–370 CrossRef CAS PubMed.
- K. F. Rabe, Br. J. Pharmacol., 2011, 163, 53–67 CrossRef CAS PubMed.
- H. Tenor, A. Hatzelmann, R. Beume, G. Lahu, K. Zech and T. D. Bethke, Handb. Exp. Pharmacol., 2011, 85–119 CAS.
- L. M. Fabbri, P. M. Calverley, J. L. Izquierdo-Alonso, D. S. Bundschuh, M. Brose, F. J. Martinez, K. F. Rabe and M2-127 M2-128 study groups, Lancet, 2009, 374, 695–703 CrossRef CAS.
- H. Wachtel, Neuropharmacology, 1983, 22, 267–272 CrossRef CAS PubMed.
- M. D. Houslay, P. Schafer and K. Y. Zhang, Drug Discovery Today, 2005, 10, 1503–1519 CrossRef CAS PubMed.
- M. P. Kelly and N. J. Brandon, Prog. Brain Res., 2009, 179, 67–73 CAS.
- S. J. Clapcote, T. V. Lipina, J. K. Millar, S. Mackie, S. Christie, F. Ogawa, J. P. Lerch, K. Trimble, M. Uchiyama, Y. Sakuraba, H. Kaneda, T. Shiroishi, M. D. Houslay, R. M. Henkelman, J. G. Sled, Y. Gondo, D. J. Porteous and J. C. Roder, Neuron, 2007, 54, 387–402 CrossRef CAS PubMed.
- J. K. Millar, S. Mackie, S. J. Clapcote, H. Murdoch, B. S. Pickard, S. Christie, W. J. Muir, D. H. Blackwood, J. C. Roder, M. D. Houslay and D. J. Porteous, J. Physiol., 2007, 584, 401–405 CrossRef CAS PubMed.
- Z. DeMarch, C. Giampa, S. Patassini, G. Bernardi and F. R. Fusco, Neurobiol. Dis., 2008, 30, 375–387 CrossRef CAS PubMed.
- H. Lee, J. M. Graham, D. L. Rimoin, R. S. Lachman, P. Krejci, S. W. Tompson, S. F. Nelson, D. Krakow and D. H. Cohn, Am. J. Hum. Genet., 2012, 90, 746–751 CrossRef CAS PubMed.
- S. Gretarsdottir, G. Thorleifsson, S. T. Reynisdottir, A. Manolescu, S. Jonsdottir, T. Jonsdottir, T. Gudmundsdottir, S. M. Bjarnadottir, O. B. Einarsson, H. M. Gudjonsdottir, M. Hawkins, G. Gudmundsson, H. Gudmundsdottir, H. Andrason, A. S. Gudmundsdottir, M. Sigurdardottir, T. T. Chou, J. Nahmias, S. Goss, S. Sveinbjornsdottir, E. M. Valdimarsson, F. Jakobsson, U. Agnarsson, V. Gudnason, G. Thorgeirsson, J. Fingerle, M. Gurney, D. Gudbjartsson, M. L. Frigge, A. Kong, K. Stefansson and J. R. Gulcher, Nat. Genet., 2003, 35, 131–138 CrossRef CAS PubMed.
- S. H. Fatemi, D. P. King, T. J. Reutiman, T. D. Folsom, J. A. Laurence, S. Lee, Y. T. Fan, S. A. Paciga, M. Conti and F. S. Menniti, Schizophr. Res., 2008, 101, 36–49 CrossRef PubMed.
- A. Robichaud, P. B. Stamatiou, S. L. Jin, N. Lachance, D. MacDonald, F. Laliberté, S. Liu, Z. Huang, M. Conti and C. C. Chan, J. Clin. Invest., 2002, 110, 1045–1052 CrossRef CAS PubMed.
- P. Prusis, R. Muceniece, P. Andersson, C. Post, T. Lundstedt and J. E. S. Wikberg, Biochim. Biophys. Acta, 2001, 1544, 350–357 CrossRef CAS.
- M. Lapinsh, P. Prusis, T. Lundstedt and J. E. S. Wikberg, Mol. Pharmacol., 2002, 61, 1465–1475 CrossRef CAS PubMed.
- M. Lapinsh, P. Prusis, S. Uhlen and J. E. S. Wikberg, Bioinformatics, 2005, 21, 4289–4296 CrossRef CAS PubMed.
- P. Prusis, M. Lapins, S. Yahorava, R. Petrovska, P. Niyomrattanakit, G. Katzenmeier and J. E. S. Wikberg, Bioorg. Med. Chem., 2008, 16, 9369–9377 CrossRef CAS PubMed.
- M. Lapins, M. Eklund, O. Spjuth, P. Prusis and J. E. Wikberg, BMC Bioinf., 2008, 9, 181 CrossRef PubMed.
- M. Lapins and J. E. Wikberg, BMC Bioinf., 2010, 11, 339 CrossRef PubMed.
- M. Fernandez, S. Ahmad and A. Sarai, J. Chem. Inf. Model., 2010, 50, 1179–1188 CrossRef CAS PubMed.
- V. Subramanian, P. Prusis, L. O. Pietilä, H. Xhaard and G. Wohlfahrt, J. Chem. Inf. Model., 2013, 53, 3021–3030 CrossRef CAS PubMed.
- I. Mandrika, P. Prusis, S. Yahorava, M. Shikhagaie and J. E. Wikberg, Protein Eng., Des. Sel., 2007, 20, 301–307 CrossRef CAS PubMed.
- A. Kontijevskis, J. Komorowski and J. E. Wikberg, J. Chem. Inf. Model., 2008, 48, 1840–1850 CrossRef CAS PubMed.
- S. Simeon, O. Spjuth, M. Lapins, S. Nabu, N. Anuwongcharoen, V. Prachayasittikul, J. E. S. Wikberg and C. Nantasenamat, PeerJ, 2016, 4, e1979 Search PubMed.
- B. Rasti, M. H. Karimi-Jafari and J. B. Ghasemi, Chem. Biol. Drug Des., 2016, 88, 341–353 CAS.
- B. Rasti, M. Namazi, M. H. Karimi-Jafari and J. B. Ghasemi, Mol. Inf., 2017, 36, 1600102 CrossRef PubMed.
- X. Chen, M. Liu and M. K. Gilson, Comb. Chem. High Throughput Screening, 2001, 4, 719–725 CrossRef CAS PubMed.
- T. Liu, Y. Lin, X. Wen, R. N. Jorissen and M. K. Gilson, Nucleic Acids Res., 2007, 35, 198–201 CrossRef PubMed.
- M. A. Larkin, G. Blackshields, N. P. Brown, R. Chenna, P. A. McGettigan, H. McWilliam, F. Valentin, I. M. Wallace, A. Wilm, R. Lopez, J. D. Thompson, T. J. Gibson and D. G. Higgins, Bioinformatics, 2007, 23, 2947–2948 CrossRef CAS PubMed.
- Molecular Discovery Ltd., GRID, 1999, Oxford, UK.
- D. Beasley, D. R. Bull and R. R. Martin, Univ. Comput., 1993, 15, 58–69 Search PubMed.
- D. Rogers and A. J. Hopfinger, J. Chem. Inf. Comput. Sci., 1994, 34, 854–866 CrossRef CAS.
- M. Sandberg, L. Eriksson, J. Jonsson, M. Sjostrom and S. Wold, J. Med. Chem., 1998, 41, 2481–2491 CrossRef CAS PubMed.
- J. Irwin and B. K. Shoichet, J. Chem. Inf. Model., 2005, 45, 177–182 CrossRef CAS PubMed.
- J. J. Irwin, T. Sterling, M. M. Mysinger, E. S. Bolstad and R. G. Coleman, J. Chem. Inf. Model., 2012, 52, 1757–1768 CrossRef CAS PubMed.
- Tripos Associates, SYBYL Molecular Modeling Software, version 7.3, St. Louis, MO, 2006 Search PubMed.
- T. J. Hou, J. M. Wang, N. Liao and X. J. Xu, J. Chem. Inf. Comput. Sci., 1999, 39, 775–781 CrossRef CAS PubMed.
- PLS Toolbox, version 3.5, Eigenvector Research, Inc., Manson, WA, 2005 Search PubMed.
- D. M. Haaland and E. V. Thomas, Anal. Chem., 1988, 60, 1193–1202 CrossRef CAS.
- L. Eriksson, J. Jaworska, A. P. Worth, M. T. Cronin, R. M. McDowell and P. Gramatica, Environ. Health Perspect., 2003, 111, 1361–1375 CrossRef CAS PubMed.
- P. Gramatica, QSAR Comb. Sci., 2007, 26, 694–701 CAS.
- A. Tropsha, P. Gramatica and V. K. Gombar, QSAR Comb. Sci., 2003, 22, 69–77 CAS.
- S. L. Jin and M. Conti, Proc. Natl. Acad. Sci. U. S. A., 2002, 99, 7628–7633 CrossRef CAS PubMed.
- M. Ariga, B. Neitzert, S. Nakae, G. Mottin, C. Bertrand, M. P. Pruniaux, S. L. Jin and M. Conti, J. Immunol., 2004, 173, 7531–7538 CrossRef CAS.
- G. Hansen, S. Jin, D. T. Umetsu and M. Conti, Proc. Natl. Acad. Sci. U. S. A., 2000, 97, 6751–6756 CrossRef CAS.
- A. B. Burgin, O. T. Magnusson, J. Singh, P. Witte, B. L. Staker, J. M. Bjornsson, M. Thorsteinsdottir, S. Hrafnsdottir, T. Hagen, A. S. Kiselyov, L. J. Stewart and M. E. Gurney, Nat. Biotechnol., 2010, 28, 63–70 CrossRef CAS PubMed.
- P. Srivani, D. Usharani, E. D. Jemmis and G. N. Sastry, Curr. Pharm. Des., 2008, 14, 3854–3872 CrossRef CAS PubMed.
- H. Wang, M. S. Peng, Y. Chen, J. Geng, H. Robinson, M. D. Houslay, J. Cai and H. Ke, Biochem. J., 2007, 408, 193–201 CrossRef CAS PubMed.
- P. Cedervall, A. Aulabaugh, K. F. Geoghegan, T. J. McLellan and J. Pandit, Proc. Natl. Acad. Sci. U. S. A., 2015, 112, E1414–E1422 CAS.
| This journal is © The Royal Society of Chemistry 2017 |

