 Open Access Article
Creative Commons Attribution 3.0 Unported Licence
Advanced anodes composed of graphene encapsulated nano-silicon in a carbon nanotube network†
Xuli Ding*a,
Haifeng Wanga,
Xiaoxiao Liub,
Zhonghui Gaoa,
Yangyang Huangb,
Danhui Lvc,
Pengfei Hed and
Yunhui Huang *ab
*ab
aCollaborative Innovation Center of Intelligent New Energy Vehicle, School of Materials Science and Engineering, Tongji University, Shanghai 201804, China. E-mail: xuliding@tongji.edu.cn
bSchool of Materials Science and Engineering, Huazhong University of Science and Technology, Wuhan, Hubei 430074, China. E-mail: huangyh@hust.edu.cn
cState Key Laboratory of Silicon Materials, School of Materials Science and Engineering, Zhejiang University, Hangzhou, Zhejiang 310027, P. R. China
dSchool of Aerospace Engineering and Applied Mechanics, Tongji University, Shanghai, 200092, P. R. China
First published on 9th March 2017
Abstract
High-capacity silicon-based anode materials with high conductivity to promote electron/ion transfer and excellent elasticity to alleviate volume expansion during repeated lithiation/delithiation process are highly desirable for next-generation lithium-ion batteries. Herein, we developed a facile in situ synthesis method based on chemical vapor deposition to fabricate Si-based nanocomposites integrated with interlinked graphene (Gra) and carbon nanotube (CNT). With melt-assembly nanosized Cu as the catalyst, hierarchical three-dimensional conductive Gra/CNT networks were in situ grown onto Si nanoparticles (SNPs) to achieve the Si@Gra@CNT composite. Such a hierarchical structure combines multiple advantages from SNPs with a super high capacity, Gra/CNT framework with continuous electrical conductivity, and void space for tolerance of Si volume expansion. Moreover, the SNPs were conformally encapsulated by few-layer Gra (fGra), which can protect the SNPs from direct exposure to electrolyte, resulting in a stable solid–electrolyte interface. As an anode material for Li-ion battery, the as-prepared Si@Gra@CNT composite exhibited a high initial specific capacity of 1197 mA h g−1 at a current density 2.0 A g−1 and ∼82% capacity retention over 1200 cycles, which was much better than those of Si@Gra and Si@CNT composites. The mechanism for the improved electrochemical performance was further analysed from the aspect of the synergetic effect arising from the construction components.
Introduction
The rapidly increasing global energy demand calls for new energy sources and high-performance energy storage devices. Among various advanced energy storage devices, rechargeable Li-ion batteries (LIBs) have dominated the electronic market over the past decades.1,2 To meet the constant incremental desire for portable electronics, electric vehicles, and large-scale energy storage, next-generation LIBs require considerable improvement in energy density, cycling stability and rate capability.2 Developing cathode and anode materials with high capacity and long cycle life is crucial for LIBs competitiveness. Among numerous candidates, silicon (Si) is regarded as a competitive anode material for next-generation LIBs, which shows high specific capacity (∼4200 mA h g−1), low work potential (∼0.2 V), abundance of resource (∼27%, earth element storage), nontoxicity and low cost.3–5 Nevertheless, some electrochemical performance areas including cycle life, rate capability and coulombic efficiency (CE), still need to be improved for practical application. In this regard, a big challenge is faced because Si has severe volume expansion (∼400%),6–8 low electrical conductivity (∼1.56 × 10⁻³ S m−1),7–9 and an unstable solid–electrolyte interphase (SEI) during repeated lithiation and delithiation.6–10 To tackle these issues, various strategies have been developed to better promote the electrons and ion transfer, shorten the charge transport length, and consolidate the construction integrity. For example, employing binders with high binding ability,11–13 making nanostructured materials,14–20 fabricating functional composites,21–28 and designing novel microstructure,21,23,29–32 have been proven effective to improve the performance of Si-based anode materials.Nanocrystallization of Si is an effective strategy. However, the main challenges for nanoscaled Si are still the large volume expansion during lithiation, redundant SEI and excessive side reaction caused by large surface area, and invalid electric connection among nanoparticles, which may eventually lead to rapid capacity decay and low CE. To overcome these issues and improve the overall electrochemical performance, one effective strategy is carbon encapsulation, which can not only buffer the large volume change but also enhance the electrical conductivity of Si. Among the diversified C materials, graphene (Gra) and carbon nanotube (CNT) are commonly used in storage energy devices due to their unique electronic and mechanical properties coupled with physical flexibility and chemical stability.33–37 In particular, hierarchical Gra/CNT composites, have stimulated much interest in a variety of fields due to their unexceptionable contact interface, excellent mechanical elasticity, and high thermal conductivity.33,37 However, how to utilize the advantages of varied layers of Gra and how to in situ fabricate hierarchical Gra/CNT composite for the Si-based anodes are still challenges. Developing a facile and inexpensive synthesis method available for mass production is highly desirable for practical applications.
Very recently, we developed a novel one-step chemical vapor deposition (CVD) method combined with a melt-self-assembly route to fabricate a Si–C composite consisting of Si nanoparticles (SNPs), monolayer graphene and void spaces, and obtained excellent rate capability and cycle life.38 New design of novel structure construction for Si-based anode materials is still required to achieve longer cycle life and higher rate capability. Herein, we report a hierarchical Si/graphene–carbon nanotube composite (denoted as Si@Gra@CNT), in which Si nanoparticles were conformally encapsulated with few-layer Gra (fGra) dispersed within CNTs. The composite was fabricated via a two-step CVD method with melt-assembly nanosized Cu as the catalyzer. Benefiting from the highly conductive and mechanically strong Gra and CNTs, the fabricated composite exhibited enhanced electrochemical performance as an LIB anode, delivering a reversible capacity of 1200 mA h g−1 with capacity retention of 82% over 1200 cycles at a current density of 2.0 A g−1.
Experimental
Samples
![[thin space (1/6-em)]](https://www.rsc.org/images/entities/char_2009.gif) :
:![[thin space (1/6-em)]](https://www.rsc.org/images/entities/char_2009.gif) 1 with de-ionized water) to finally form Si@Gra@CNT composite. The mass ratio of CNTs in the composite could be adjusted by the experimental parameters such as growth temperature and gas flow rate.
1 with de-ionized water) to finally form Si@Gra@CNT composite. The mass ratio of CNTs in the composite could be adjusted by the experimental parameters such as growth temperature and gas flow rate.Characterization
The morphologies and elemental mappings of SNPs and the SNPs-based composites were observed by field emission SEM (FEI Nova NanoSEM 45). TEM and HRTEM images were obtained on a JEOL JEM-2100 instrument equipped with a CCD camera operating at an acceleration voltage of 200 kV. Raman spectroscopy was detected at an operating power level of 2 mW on a confocal Raman spectrometer (Thermofisher, US) using a 532 nm excitation laser with spot size of 0.7 μm. Aberration corrected scanning transmission electron microscopy (FEI Titan G2 80-200 Chemi STEM) was used to perform the elements mapping by operating at an acceleration voltage of 200 kV with the image resolution of 0.08 nm. The BET (Micromeritics Instrument Corporation) analysis results are shown in the ESI, Fig. S4.† The thermogravimetric analysis (TGA) was performed by the vertical zero friction dilatometer L75VS Linseis (Germany) from room temperature to 900 °C in air.Electrochemical measurements
Electrochemical performance of the composites was investigated in coin cells (CR2032) assembled in an Ar-filled glove box. Metal Li foil was used as the counter electrode and a Celgard 2300 membrane was the separator. The electrolyte was 1 mol L−1 LiPF6 in a mixed solution of ethylene carbonate (EC) and dimethyl carbonate (DMC) (EC![[thin space (1/6-em)]](https://www.rsc.org/images/entities/char_2009.gif) :
:![[thin space (1/6-em)]](https://www.rsc.org/images/entities/char_2009.gif) DMC = 1
DMC = 1![[thin space (1/6-em)]](https://www.rsc.org/images/entities/char_2009.gif) :
:![[thin space (1/6-em)]](https://www.rsc.org/images/entities/char_2009.gif) 1). The electrode was prepared by slurry coating and then dried in oven for 12 h. The ratio of active material
1). The electrode was prepared by slurry coating and then dried in oven for 12 h. The ratio of active material![[thin space (1/6-em)]](https://www.rsc.org/images/entities/char_2009.gif) :
:![[thin space (1/6-em)]](https://www.rsc.org/images/entities/char_2009.gif) binder (alginate) was 8
binder (alginate) was 8![[thin space (1/6-em)]](https://www.rsc.org/images/entities/char_2009.gif) :
:![[thin space (1/6-em)]](https://www.rsc.org/images/entities/char_2009.gif) 2, and super P was not needed. The mass loading of the active material on the current collector was ∼0.3 mg, and the mass loading density per unit area was ∼0.6 mg cm−2. CV curves were measured on a PARSTA 2273 electrochemical workstation at a scanning rate of 0.1 mV s−1 from 0 to 2 V. Electrochemical impedance spectrum (EIS) measurement was performed within a frequency range between 0.1 Hz and 1 MHz. Galvanostatic charge–discharge tests were carried out on a battery measurement system (Land, Wuhan) at various current densities within a voltage range of 1.5–0.005 V vs. Li/Li+ at a constant temperature (25 °C).
2, and super P was not needed. The mass loading of the active material on the current collector was ∼0.3 mg, and the mass loading density per unit area was ∼0.6 mg cm−2. CV curves were measured on a PARSTA 2273 electrochemical workstation at a scanning rate of 0.1 mV s−1 from 0 to 2 V. Electrochemical impedance spectrum (EIS) measurement was performed within a frequency range between 0.1 Hz and 1 MHz. Galvanostatic charge–discharge tests were carried out on a battery measurement system (Land, Wuhan) at various current densities within a voltage range of 1.5–0.005 V vs. Li/Li+ at a constant temperature (25 °C).
Results and discussion
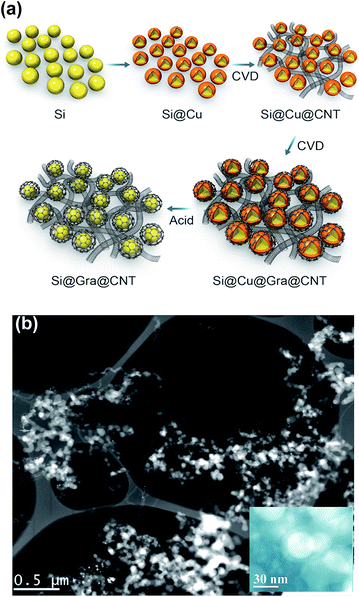
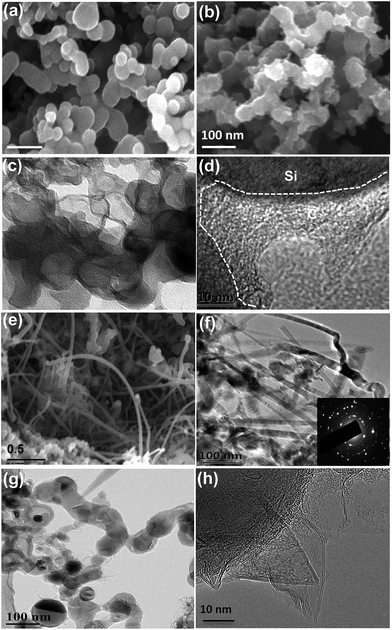
Fig. 1a schematically explains the fabrication steps of the Si@Gra@CNT composite. The fabrication procedure was primarily based on a CVD method that used thermal melt-assembly Cu as the catalyzer for the Gra and CNT growth. A Cu foil with SNPs dispersed on its surface was first put into a tube for heating. Once reaching the melting point temperature, the SNPs were soaked in the liquid melted Cu. With quick cooling, the nanostructured Si@Cu composite was formed, which acted as the catalyzer for the subsequent growth of CNTs and Gra, separately. After etching the sacrificial Cu layer by diluted nitric acid, the Si@Gra@CNT composite was obtained. More information about the experimental process is provided in the ESI Fig. S1† and our previous report.38 Fig. 1b displays the scanning transmission electron microscopy (STEM) image of the obtained Si@Gra@CNT composite. The CNTs with a mean length of ∼5 μm entangled among the Si nanoparticles and acted as conducting bridges. From the inset of Fig. 1b, it was shown that the SNPs (∼30 nm) were conformally encapsulated with fGra, and the fGra was clearly visible at the SNPs edge. It is worth mentioning that the experimental process and fabrication concept for such nanostructured composites were quite different from those of the previous reports.21–28 The use of melted and self-assembly nanosized Cu as catalyzer for CNT and Gra growth through the two-step CVD process resulted in the nano-Si based anode materials incorporated with interlinked Gra and CNT, which is favorable for improvement of the electrochemical performance. The morphology, size and structure of the obtained CNTs and Gra could be clearly observed by scanning electron microscopy (SEM) and transmission electron microscopy (TEM) images, which are shown in Fig. 2. The bare commercial SNPs had a typical size around 30 nm, as seen in Fig. 2a. After Cu melt-assembly onto the SNPs, the Si@Cu composite was formed (Fig. 2b) in which the SNPs were uniformly encapsulated with the assembled Cu (Fig. 2c). From the high-resolution TEM (HR-TEM) images (Fig. 2d), we can see that the thickness of Cu encapsulating layer was 10–20 nm around the edge of SNPs. Fig. 2e shows the SEM image of the obtained CNTs. The CNTs with the length of ∼5 μm were highly packed among the SNPs, making the SNPs tightly entangled. It was deduced that during the second synthesis step, the CNTs preferentially grew along with the nano-Cu catalyst and then entangled with the Si@Cu composite. The TEM image in Fig. 2f indicates that a 3D network of the intercrossed CNTs was formed with a tube diameter of ∼10 nm (Fig. S2c†). Judging by the selected area electrons diffusion (SAED) images in Fig. 2f, the obtained CNTs are found to be mainly polycrystal.Fig. 2h further shows the TEM images of the fGra obtained by CVD process using nano-Cu as the catalyzer. It is evident that the synthesized Gra conformally encapsulated the SNPs (see ESI Fig. S2d–f†). The edge of the obtained Gra clearly showed varied layers from monolayer to multilayer, as seen in the HR-TEM image (Fig. 2h). After etching the nano-Cu layer, the Si@Gra@CNT composite was achieved, accompanied by the formation of voids in the composite (Fig. 2g). Herein, the nanoscale metal catalyzer used in the synthesis was favorable for forming the carbon nanostructure. It should be mentioned that the synthesis temperature played a critical role in determining the microstructure. Low temperature favored CNT formation, while high temperature preferred Gra conformal growth. At high synthesis temperatures, the conformal Gra with a veiling-like morphology was obtained. At low synthesis temperatures, line-like CNTs were obtained with almost no core–shell conformal structure. In our case, tuning the synthesis temperature could control the formation of carbon nanotubes and core–shell conformal growth of fGra around the Si nanoparticles. This can be understood from the fact that at high temperature (1000 °C), the diffusion of carbon atoms on the metal catalyst was very fast, and hence the core–shell conformal Gra was preferentially formed on the surface of Si@Cu nanoparticles.39,40 However, at low temperature (700 to 850 °C), the diffusivity of carbon atoms was relatively slow compared to high temperature (1000 °C), and the tubular structure was preferentially formed.39,40 Illustration for the CNTs growth mechanism is provided in the ESI, Fig. S3.†
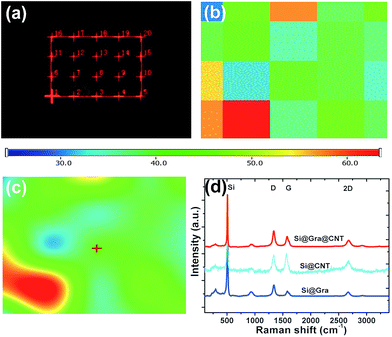
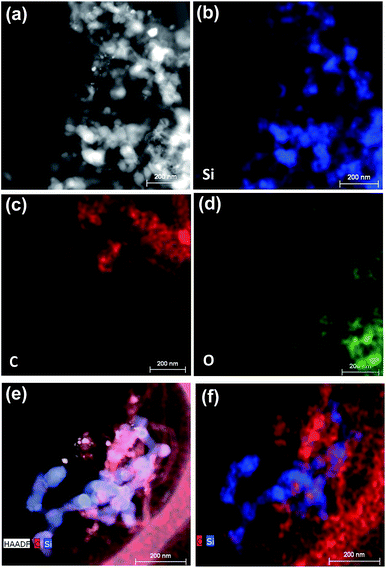
Fig. 3 shows the Raman spectra for the Si@Gra@CNT composite. A randomly selected 20 × 20 μm2 electrode region within the investigated anode is displayed in Fig. 3a, and the corresponding Raman mapping result for the labeled region is shown in Fig. 3b. In Fig. 3b, there are different color blocks that correspond to the labeled region in Fig. 3a, and the color represents the relative Raman scattering intensity; from the mapping result, the color change of the entire region was found to be assuasive, and it can be deduced that the carbon (Gra/CNT) elements distribution was nearly uniform in the detected region. Utilizing the Raman analysis, the corresponding mapping result of the 2D band at ∼2690 cm−1, as shown in Fig. 3c (for the labeled regions in Fig. 3a), indicates that the synthesized Gra/CNTs were uniformly distributed throughout the entire testing region. The color scale bar under Fig. 3a and b represents the relative Raman scattering intensity. Fig. 3d further displays the Raman spectra compare for Si@Gra@CNT, Si@CNT and Si@Gra. Three characteristic peaks centered at 302, 510, 942 cm−1 are assigned to the Si particles,41 while the other characteristic peaks around 1350, 1580 and 2690 cm−1 correspond to the D, G and 2D band of Gra and CNT, respectively. From the Raman measurement, multi-wall carbon nanotubes (MWCNTs, light blue line) were detected, which was consistent with the HR-TEM images in the Fig. 2f and S2c,† as the diameter of the obtained CNT was around ∼10 nm, which is a typical feature for the MWCNTs. For the Gra obtained in the current study, the D peak was stronger than the G peak, which is due to the nano-size effect and Raman scattering enhancement.42,43 For the CNT, the relative intensity of the ID/IG was less than 1, indicating that the D peak intensity was lower than the G peak. This is because there is no Raman scattering enhancement effect since the obtained CNT size was at the ∼5 μm level. In order to further validate the Si, Gra, and CNT in the composites, the corresponding scanning transmission electron microscopy (STEM) elemental mappings were measured, which clearly indicated that they were homogeneously distributed all over the detected region in the Si@Gra@CNT composites, as displayed in Fig. 4. The uniform distribution can be also confirmed by the elemental mapping of Cu, Si, C and void in the SEM energy dispersive spectra (see Fig. S4†).
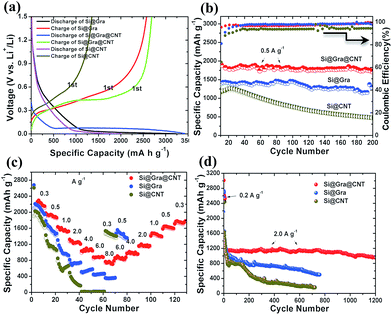
The electrochemical performance of the Si@Gra@CNT composite is shown in Fig. 5. The specific capacities are calculated based on the total mass of Si, Gra and CNT in the composite. The contribution from Gra and CNT to the total specific capacity can be almost neglected in our presented samples as ∼9% mass content of Gra/CNT only contributes a capacity of ∼45 mA h g−1, assuming that the specific capacity of Gra/CNT is ∼500 mA h g−1 at a current of 0.5 A g−1 (the corresponding thermogravimetric analysis (TGA) for the composite is shown in the ESI Fig. S5†). Fig. 5a displays the first discharging/charging process for Si@Gra@CNT, Si@Gra and Si@CNT. It is clear that the Si@Gra@CNT showed a wide discharge (blue) platform at around 0.04 V, while the platform for both Si@Gra and Si@CNT (black and pink, separately), was narrower compared to that of Si@Gra@CNT. This can be explained by the synergetic enhancement effect of Gra and CNT on the electric conductivity in the Si@Gra@CNT composite. At a specific current of 0.5 A g−1, the first-cycle CE was 79% for Si@Gra@CNT, 81% for Si@Gra and 67% for Si@CNT. The slightly lower CE for Si@Gra@CNT than that for Si@Gra was due to the increased specific surface area for Si@Gra@CNT. The Brunauer–Emmett–Teller (BET) surface area analysis was 32.87 m2 g−1 for Si@Gra@CNT, and 17.26 m2 g−1 for Si@Gra (see Fig. S6†). For Si@CNT, the CE was quite low, which can be ascribed to the more irreversible consumption of electrolyte due to the continuous and thick SEI formation owing to the direct contact between active Si and electrolyte without the protection of conformal Gra. From this point, the encapsulation of nanosized Si with conformal Gra was crucial to achieve the high CE and long cycle.
As compared in Fig. 5b, Si@Gra@CNT shows the best cyclability, for which the capacity only undergoes a slight decay in the initial few cycles and then maintains its stability in the following cycles. However, for Si@CNT, the capacity continuously decreases during 200 cycles, although it delivers a high initial discharge capacity of 2200 mA h g−1, but only 500 mA h g−1 is preserved after 200 cycles.
The Si@Gra@CNT also exhibits outstanding rate capability. As seen in Fig. 5c, Si@Gra@CNT displays discharge capacities of 2250, 2000, 1600, 1300, 1050, 950, and 800 mA h g−1 at specific current densities of 0.3, 0.5, 1.0, 2.0, 4.0, 6.0, and 8.0 A g−1, respectively. For Si@Gra, the rate capability was inferior to that of Si@Gra@CNT but superior to that of Si@CNT. Compared with the capacity at 0.3 A g−1, the capacity retention at 4.0 A g−1 was 26% for Si@Gra, 0% for Si@CNT, and 47% for Si@Gra@CNT. Clearly, Si@CNT only shows a high specific capacity at low current densities for tens of cycles and then undergoes subsequent serious capacity fading with increasing current density up to 2.0 A g−1, but Si@Gra@CNT shows the most stable capacity retention at various current densities. The results further demonstrate the effective synergistic effect from Gra and CNT for the improved rate capability. Furthermore, the Si@Gra@CNT composite anode presented a very stable and long cycling performance, as shown in Fig. 5d. It was observed that its capacity had only a small decay during the initial few cycles and then became stable in the following cycles. At a specific current density of 2.0 A g−1, the capacity changed from 1197 mA h g−1 at the 10th cycle to 982 mA h g−1 at the 1200th cycle, indicating an 82% capacity retention, which is superior to that in the previous report.38 Moreover, Si@Gra@CNT exhibited higher specific capacity than Si@Gra and Si@CNT at the same rate. As shown in Fig. 5d, Si@Gra@CNT showed the best cycling stability with the highest capacity retention after 1200 cycles, while Si@CNT showed the fastest capacity fading in the whole cycling process. Although the initial capacities for the three anodes were close at low current density, their rate capabilities and cycle performances were quite different.
The results demonstrated a stable discharge/charge process for the Si@Gra@CNT composite anode. It is believed that the hierarchical structure of CNTs and Gra endowed the SNPs with superior electrochemical performance. Without additional assistance, such as optimizing the electrolyte (for example, adding some additive) or controlling the charge/discharge voltage,44,45 the achieved long cycle life and high capacity in Si@Gra@CNT should be related to the uniquely designed structure and the special features of Gra, CNTs and SNPs. First, the flexible nature of Gra and CNT can release the deformation stress generated during lithiation/delithiation of Si to maintain the overall integrated structure. Second, the wrapping Gra can act as an elastic shield to protect Si nanoparticles from direct exposure to the electrolyte, promoting the formation of stable and thin SEI layer, which is critical for long stability of electrode. Third, and most important, the network formed by Gra and CNT works as an electrical highway to provide more efficient channels for fast charge transfer and improve the kinetics of the electrochemical process, which guarantees a long and stable cycling life for the Si-based anodes.
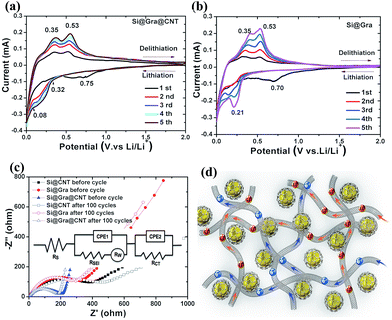
For further insight into the mechanism of enhanced electrochemical performance in Si@Gra@CNT, cyclic voltammetry (CV) and electrochemical impedance spectroscopy (EIS) were measured. The CV curves of the initial five cycles for Si@Gra@CNT (Fig. 6a), Si@Gra (Fig. 6b) and Si@CNT (Fig. S7†) show that all the composite electrodes exhibited typical redox features of Si with lithium insertion occurring at potentials below 0.3 V and extraction at 0.36 and 0.53 V.46–49 The peaks around 0.21 V indicate the structure change of silicon from crystalline to amorphous, and the amorphous levels gradually increased with the cycling numbers as revealed by the raised peak intensity in the subsequent four cycles. Moreover, a sharp reduction peak appeared at 0.1–0 V, indicating that the LixSi multiple phases coexisted during the course of lithiation.48,49 For Si@Gra@CNT, a broad cathodic peak appeared at 0.61 V in the first cycle but disappeared in the following cycles, indicating an irreversible reaction due to the formation of a SEI layer. For Si@Gra and Si@CNT, the cathodic peaks were centered at ∼0.70 V. From the second to fifth cycles, two cathodic peaks around 0.21 V and 0.01 V appeared, corresponding to the formation of LixSi alloy phases, accompanied with an increased peak intensity, which indicated a further degree of alloying with the increasing number of cycles. In the reverse anodic scans, two peaks centered around 0.36 V and 0.53 V are ascribed to the de-alloying phase of LixSi,49,50 and their intensity increased gradually in the initial five cycles, indicating further de-alloying with cycles. It is worth noting that the scan curves were more compacted for Si@Gra@CNT compared with those of the Si@Gra and Si@CNT, which indicated better reversibility for Si@Gra@CNT construction. Fig. 6c compares the EIS curves for the electrodes of Si@Gra@CNT, Si@Gra, and Si@CNT before cycling and after 100 cycles to further understand the electrochemical impedance and interfacial change of the composites. The inset in Fig. 6c shows the equivalent circuit diagram. The Nyquist plot consists of a suppressed semicircle in the high-medium frequencies region and a diagonal straight line in the low frequencies; the former is ascribed to the charge transfer, electron conduction among active materials, etc.41–43,51,52 and the latter is attributed to the transformation of crystal structure and diffusion of ions at the reaction interface of active materials.52–54 It could be seen that the semicircle radius of the Si@Gra@CNT was much smaller than those of Si@Gra and Si@CNT. This is because both Gra and CNT are highly conductive, and at the same time, CNTs act as conductive bridges to connect the Gra-encapsulated SNPs and hence to facilitate the charge transfer among the SNPs. Moreover, Si@Gra@CNT showed little impedance change during lithiation and delithiation even after 100 cycles, which proves that the interface structure and the formed SEI layer were stable.
We schematically illustrated the ion-diffusion pathway and electron-conduction channels for Si@Gra@CNT in Fig. 6d. The electron and ion transfer among the Si nanoparticles through the bridge-like conductive CNTs.
As displayed in Fig. 1, the designed composite integrates the benefits from the three building blocks of SNPs, Gra and CNT, in which SNPs offer high capacity, Gra acts as a mechanically protective layer to avoid the direct contact between Si and electrolyte, and an electrically conductive layer to enhance the Si conductivity, while CNTs further serve like conductive chains or bridges among the SNPs to enhance the charges transfer among the active nanoparticles, ensuring the overall conductivity and integrity of the final constructed electrode. Importantly, compared with the common composite materials, the in situ synthesized composite generally has a better natural cohesion and more stable interface among the active particles to effectively facilitate the electron and ion conduction. Therefore, it is the synergetic effect from SNPs, Gra and CNTs that the in situ developed Si@Gra@CNT composite anode exhibited outstanding integrated electrochemical performance, including large capacity, high rate capability and long cycle life.
Conclusions
In summary, we developed a simple melt-assembly method to in situ synthesize Si@Gra@CNT nanocomposite for LIB anode with high capacity and long cycle life. Using thermally melted Cu as the catalyzer, hierarchical Gra and CNT were in situ grown to encapsulate and connect Si nanoparticles to achieve the Si@Gra@CNT composite. The composite exhibited a high initial specific capacity of ∼1197 mA h g−1 at current 2.0 A g−1, and ∼82% capacity retention was obtained over 1200 cycles. The Gra and CNTs, as well as the void space formed between SNP and Gra could not only effectively accommodate the volume change during the lithiation/delithiation process, but could also provide preferential pathways for charge diffusion. Furthermore, excellent electrical conductivity of crystallized Gra and CNTs facilitated the transport of electrons, and the crystallized Gra served as a flexible protection layer to avoid Si nanoparticles from divulging directly to the electrolyte, which is favorable for the formation of stable and thin SEI film. It is the synergistic effect of Gra, void space and CNTs that effectively solves the problem of large volume expansion, poor conductivity, and redundant SEI formation over continuous cycling for the Si-based anodes. Our present study can provide a new concept and potential strategy for the material synthesis and hierarchical nanostructure design to develop commercial high-performance Si-based anode for the next-generation Li-ion batteries.Acknowledgements
The authors gratefully acknowledge the financial support by NSFC (Grant No. 11604245, 51361130151) and the open project (CKEM131408) from the Key Laboratory of energy conversion, Shanghai Institute of Ceramics, CAS.References
- J. M. Tarascon and M. Armand, Nature, 2011, 414, 359–367 CrossRef PubMed.
- M. Armand and J. M. Tarascon, Nature, 2008, 451, 652–657 CrossRef CAS PubMed.
- M. Winter and J. O. Besenhard, Electrochim. Acta, 1999, 45, 31–50 CrossRef CAS.
- W. H. Li, Z. Z. Yang, M. S. Li, Y. Jiang, X. Wei, X. W. Zhong, L. Gu and Y. Yu, Nano Lett., 2016, 16, 1546–1553 CrossRef CAS PubMed.
- J. Qin, C. N. He, N. Q. Zhao, Z. Y. Wang, C. S. Shi, E. Z. Liu and J. J. Li, ACS Nano, 2014, 8, 1728–1738 CrossRef CAS PubMed.
- H. Wu and Y. Cui, Nano Today, 2012, 7, 414–429 CrossRef CAS.
- C. M. Park, J. H. Kim, H. Kim and H. J. Sohn, Chem. Soc. Rev., 2010, 39, 3115–3141 RSC.
- Z. H. Chen, L. Christensen and J. R. Dahn, Electrochem. Commun., 2003, 5, 919–923 CrossRef CAS.
- J. W. Wang, Y. He, F. Fan, X. H. Liu, S. Xia, Y. Liu, C. T. Harris, H. Li, J. Y. Huang, S. X. Mao and T. Zhu, Nano Lett., 2013, 13, 709–715 CrossRef CAS PubMed.
- M. T. McDowell, S. W. Lee, J. T. Harris, B. A. Korgel, C. Wang, W. D. Nix and Y. Cui, Nano Lett., 2013, 13, 758–764 CrossRef CAS PubMed.
- B. Koo, H. Kim, Y. Cho, K. T. Lee, N. S. Choi and J. Cho, Angew. Chem., Int. Ed. Engl., 2012, 51, 8762–8767 CrossRef CAS PubMed.
- I. Kovalenko, B. Zdyrko, A. Magasinski, B. Hertzberg, Z. Milicev, R. Burtovyy, I. Luzinov and G. Yushin, Science, 2011, 334, 75–79 CrossRef CAS PubMed.
- C. Wang, H. Wu, Z. Chen, M. T. McDowell, Y. Cui and Z. Bao, Nat. Chem., 2013, 5, 1042–1048 CrossRef CAS PubMed.
- C. K. Chan, H. Peng, G. Liu, K. McIlwrath, X. F. Zhang, R. A. Huggins and Y. Cui, Nat. Nanotechnol., 2008, 3, 31–35 CrossRef CAS PubMed.
- H. Wu, G. Chan, J. W. Choi, I. Ryu, Y. Yao, M. T. McDowell, S. W. Lee, A. Jackson, Y. Yang, L. B. Hu and Y. Cui, Nat. Nanotechnol., 2012, 7, 309–314 Search PubMed.
- K. Q. Peng, X. Wang, L. Li, Y. Hu and S. T. Lee, Nano Today, 2013, 8, 75–97 CrossRef CAS.
- C. K. Chan, H. Peng, G. Liu, K. McIlwrath, X. F. Zhang, R. A. Huggins and Y. Cui, Nat. Nanotechnol., 2008, 3, 31–35 CrossRef CAS PubMed.
- T. Song, J. L. Xia, J. H. Lee, D. H. Lee, M. S. Kwon, J. M. Choi, J. Wu, S. K. Doo, H. Chang and W. I. Park, Nano Lett., 2010, 10, 1710–1716 CrossRef CAS PubMed.
- B. Hertzberg, A. Alexeev and G. Yushin, J. Am. Chem. Soc., 2010, 132, 8548–8549 CrossRef CAS PubMed.
- M. H. Park, M. G. Kim, J. Joo, K. Kim, J. Kim, S. Ahn, Y. Cui and J. Cho, Nano Lett., 2009, 9, 3844–3847 CrossRef CAS PubMed.
- N. Liu, H. Wu, M. T. McDowell, Y. Yao, C. M. Wang and Y. Cui, Nano Lett., 2012, 12, 3315–3321 CrossRef CAS PubMed.
- S. H. Ng, J. Z. Wang, D. Wexler, K. Konstantinov, Z. P. Guo and H. K. Liu, Angew. Chem., Int. Ed., 2006, 45, 6896–6899 CrossRef CAS PubMed.
- N. Liu, Z. Lu, J. Zhao, M. T. McDowell, H. W. Lee, W. Zhao and Y. Cui, Nat. Nanotechnol., 2014, 9, 187–192 CrossRef CAS PubMed.
- M. Zhou, X. L. Li, B. Wang, Y. B. Zhang, J. Ning, Z. C. Xiao, X. H. Zhang, Y. H. Chang and L. J. Zhi, Nano Lett., 2015, 15, 6222–6228 CrossRef CAS PubMed.
- W. Wang, R. Epur and P. N. Kumta, Electrochem. Commun., 2011, 13, 429–432 CrossRef CAS.
- R. Yi, J. T. Zai, F. Dai, M. L. Gordin and D. H. Wang, Nano Energy, 2014, 6, 211–218 CrossRef CAS.
- J. Y. Ji, H. X. Ji, L. L. Zhang, X. Zhao, X. Bai, X. B. Fan, F. B. Zhang and R. S. Ruoff, Adv. Mater., 2013, 25, 4673–4677 CrossRef CAS PubMed.
- Y. Li, K. Yan, H. W. Lee, Z. Lu, N. Liu and Y. Cui, Nat. Energy, 2016, 1, 15029 CrossRef CAS.
- Y. Yu, L. Gu, C. B. Zhu, S. Tsukimoto, P. A. Aken and J. Maier, Adv. Mater., 2010, 22, 2247–2250 CrossRef CAS PubMed.
- H. Kim, B. Han, J. Choo and J. Cho, Angew. Chem., Int. Ed., 2008, 47, 10151–10154 CrossRef CAS PubMed.
- S. L. Jing, H. Jiang, Y. J. Hu, J. H. Shen and C. Z. Li, Adv. Funct. Mater., 2015, 25, 5395–5401 CrossRef CAS.
- Y. H. Huang, Q. Bao, B. H. Chen and J. G. Duh, Small, 2015, 19, 2314–2322 CrossRef PubMed.
- B. Wang, X. L. Li, X. F. Zhang, B. Luo, Y. B. Zhang and L. J. Zhi, Adv. Mater., 2013, 25, 3560–3565 CrossRef CAS PubMed.
- M. H. Liang and L. J. Zhi, J. Mater. Chem., 2009, 19, 5871–5878 RSC.
- G. L. Che, B. B. Lakshmi, E. R. Fisher and C. R. Martin, Nature, 1998, 393, 346–349 CrossRef CAS.
- J. P. Tessonnier and D. S. Su, ChemSusChem, 2011, 4, 824–847 CrossRef CAS PubMed.
- F. Bonaccorso, L. G. Colombo, G. H. Yu, M. Stoller, V. Tozzini, A. C. Ferrari, R. S. Ruoff and V. Pellegrini, Science, 2015, 347, 1246501 CrossRef PubMed.
- X. L. Ding, X. X. Liu, Y. Y. Huang, X. F. Zhang, Q. J. Zhao, X. H. Xiang, G. L. Li, P. F. He, Z. Y. Wen, J. Li and Y. H. Huang, Nano Energy, 2016, 27, 647–657 CrossRef CAS.
- M. Kumar and Y. Ando, J. Nanosci. Nanotechnol., 2010, 10, 3739–3758 CrossRef CAS PubMed.
- D. Lopez, I. Y. Abe and I. Pereyra, Diamond Relat. Mater., 2015, 52, 59–65 CrossRef CAS.
- C. Meier, S. Luttjohann, V. G. Kravets, H. Nienhaus, A. Lorke and H. Wiggers, Phys. E, 2006, 32, 155–158 CrossRef CAS.
- W. Z. Li, H. Zhang, C. Y. Wang, Y. Zhang, L. W. Xu, K. Zhu and S. S. Xie, Appl. Phys. Lett., 1997, 70, 2684 CrossRef CAS.
- M. S. Dresselhause, A. Jorio, M. Hofmann, G. Dresselhaus and R. Saito, Nano Lett., 2010, 10, 751–758 CrossRef PubMed.
- J. R. Szczech and S. Jin, Energy Environ. Sci., 2011, 4, 56–72 CAS.
- B. Wang, X. L. Li, X. F. Zhang, B. Luo, Y. B. Zhang and L. J. Zhi, Adv. Mater., 2013, 25, 3560–3565 CrossRef CAS PubMed.
- A. Magasinski, P. Dixon, B. Hertzberg, A. Kvit, J. Ayala and G. Yushin, Nat. Mater., 2010, 9, 353–358 CrossRef CAS PubMed.
- M. Y. Ge, J. P. Rong, X. Fang, X. Zhou and C. W. Zhou, Nano Lett., 2012, 12, 2318–2323 CrossRef CAS PubMed.
- W. Y. Li, Y. B. Tang, W. P. Kang, Z. Y. Zhang, X. Yang, Y. Zhu, W. J. Zhang and C. S. Lee, Small, 2015, 11, 1345–1351 CrossRef CAS PubMed.
- X. S. Zhou, Y. X. Yin, L. J. Wan and Y. G. Guo, Chem. Commun., 2012, 48, 2198–2200 RSC.
- J. Li and J. R. Dahn, J. Electrochem. Soc., 2007, 154, A156–A161 CrossRef CAS.
- J. B. Chang, X. K. Huang, G. H. Zhou, S. M. Cui, P. B. Hallac, J. W. Jiang, P. T. Hurley and J. H. Chen, Adv. Mater., 2014, 26, 758–764 CrossRef CAS PubMed.
- R. Ruffo, S. S. Hong, C. K. Chan, R. A. Huggins and Y. Cui, J. Phys. Chem. C, 2009, 113, 11390–11398 CAS.
- R. Delevie, Electrochim. Acta, 1964, 9, 1231–1245 CrossRef CAS.
- E. Barsoukov and J. R. Macdonald, Impedance Spectroscopy, Wiley Sons. Inc., Hoboken, New York, 2005 Search PubMed.
Footnote |
| † Electronic supplementary information (ESI) available. See DOI: 10.1039/c7ra01877k |
| This journal is © The Royal Society of Chemistry 2017 |

