 Open Access Article
Creative Commons Attribution 3.0 Unported Licence
Effect of applied force and atomic organization of copper on its adhesion to a graphene substrate
Sunil Kumar
Metal Extraction and Forming Division, CSIR, -National Metallurgical Laboratory, Jamshedpur, 831007 India. E-mail: sunil@nmlindia.org
First published on 10th May 2017
Abstract
Copper/graphene composites are lightweight and possess many attractive properties such as improved mechanical, electrical, and thermal properties. The organization of copper atoms at the copper/graphene interface highly influences the abovementioned properties. In this study, the organization of copper atoms and applied force-induced desorption of copper from a graphene substrate were studied via molecular dynamics (MD) simulation. The copper atoms were organized in face-centred cubic (fcc) and hexagonal close-packed (hcp) lattices over the graphene substrate. However, at the copper/graphene interface, copper atoms were organized in the {111} facet of the fcc lattice. The applied force-induced desorption of copper atoms from a graphene substrate was studied at high temperature (T = 1000 K). A critical force was required to be exceeded before the detachment of copper atoms from the substrate. It was found that a higher critical force was required to remove copper atoms from the graphene substrate in the z-direction (perpendicular to the substrate) compared to that in the x-direction. The outcome of this study may provide useful scientific information about the metal/graphene interface properties, which will help enhance the performance of graphene-based metallic nanocomposites.
1. Introduction
Addition of graphene into a metal matrix has been found to improve the properties, including mechanical1,2 and electrical3,4 properties, of the composites. Dispersion of graphene into a metal matrix, which is the most important factor to manage the properties of a metal nanocomposite, depends on the interaction of graphene with the metal under the stagnant condition. However, some studies have also reported that graphene reinforcement in metals decreases its mechanical properties.5–8 The reasons for this behaviour are poor graphene/metal interface bonding and high processing temperatures. In this study, physical bonding of copper atoms with graphene during adsorption and applied force-induced desorption was described. The interaction potentials or physical bonding between graphene and copper atoms may lead to the self-organization of the copper atoms over the graphene substrate. The organization of copper atoms over the graphene substrate has been studied to find a methodology for the modification of the existing characteristics of graphene to further enhance the physical bonding between copper and the graphene substrate. The applied force-induced desorption of copper atoms was investigated to observe the behaviour of atoms at the interface under various physical load conditions. The results of this study will provide a comprehensive understanding to the researchers for the better design of metal/graphene composites.Studies reported to date9–20 suggest that metal atoms make a sheathing arrangement on the graphene surface. The maximum contact area between the metal matrix and graphene during the metal sheathing process enhances the strength of the interface. Hwang et al.9 showed that reduced graphene oxide was uniformly dispersed in the copper matrix and acquired significantly improved mechanical performance by a molecular-level mixing method. Li et al.10 found that the Ni-coated graphene flakes not only prohibited agglomeration but also enhanced the bonding strength between graphene and the copper matrix. Despite a large number of experimental studies, there are only a few studies reported on the atomic molecular dynamic simulations of copper/graphene nanocomposites.21,22 Amal et al.21 investigated the formation of atomic nanoclusters over graphene sheets using molecular dynamics simulations. They considered Cu, Ag, Au, Li, Na, and K atoms for deposition over a graphene substrate. They observed that Ag, Au, and Cu formed aggregates and made nanoclusters of different shapes and sizes, which randomly distributed on the graphene substrate. On the contrary, Li, Na, and K created a monoatomic layer over the graphene substrate. However, they have not shown the organization of metal atoms over the hexagonal arrangement of the carbon atoms of graphene. Duan et al.22 investigated the mechanical properties of copper/graphene nanocomposites using molecular dynamics simulation. They found that Young's modulus, tensile strength, and the fracture strain of graphene nanoribbon/copper nanocomposites increased as the number of graphene layers increased. Despite these studies, the organization of copper atoms over the hexagonal arrangement of carbon atoms at equilibrium and under the application of external loads still needs to be explored. To the best of our knowledge, the organization of copper atoms in the presence of graphene using molecular dynamics simulation has not been studied to date.
In this study, a comprehensive study was performed to address the organization of copper atoms over the graphene substrate at equilibrium adsorption and applied force-induced desorption using molecular dynamic simulation. In the first step, adsorption and organization of copper atoms over a graphene substrate was simulated. In the second step, a constant force was applied on each copper atom to study the organization during the desorption processes. The Steinhardt–Nelson order parameters, adaptive common neighbour analysis, radial distribution function, and potential energy evolution were used to characterize the organization of copper atoms over the graphene substrate.
2. Methodology
Constant-temperature molecular dynamics simulation23 was applied in this study. Molecular dynamics simulation, visualization, and analysis of a copper/graphene composite system was carried out using a large scale atomic/molecular massively parallel simulator (LAMMPS),24 visual molecular dynamics (VMD),25 and open visualization tool (OVITO)26 software packages, respectively. The embedded atom method (EAM) potential was used for the interaction potentials of copper according to Mendelev et al.27 The total interaction potentials for copper atoms ECu were calculated by
 | (1) |
The non-bonded interaction parameters between the copper and carbon atoms of the graphene substrate were calculated through a 12 − 6 Lennard Jones potential given in the eqn (2),
 | (2) |
 | (3) |
2.1. Adaptive common neighbor analysis (a-CNA)
The a-CNA was carried out for the identification of the structural organization of copper atoms. It provides a precise classification of the atomic organizations such as fcc, bcc, hcp, ico, and others using only the position (x, y, and z coordinates) of each copper atom. In the a-CNA analysis, the local crystal structure of copper atoms was identified via calculations of three integers (ncn, nb, and nlcb) for each central copper atom.32–35 The first integer ncn is the number of copper atoms that are neighbors to both atoms in the pair, which are named as common neighbors. The second integer nb is the total number of bonds between ncn common neighbors of copper atoms. The third integer nlcb is the number of bonds in the longest continuous chain formed by the nb bonds between common neighbors of copper atoms. In the perfect fcc atoms, all pairs are of the type (ncn, nb, nlcb) = (4, 2, 1) or simply known as 421. Similarly, for a perfect hcp, 50% of the pairs are of type 422 and other 50% are of type 421. The OVITO package26 was used to compute the a-CNA for each copper atom during the simulations.2.2. Average number distributions of copper atoms over the graphene substrate
The average number distribution of copper atoms was calculated in the z-direction, which is normal to the graphene substrate. Herein, n(z) is the number of copper atoms in a planner shell of thickness Δz at a normal distance z above the graphene substrate; NCu is the total number of copper atoms in the system. We created 100 planner shells with an increasing distance z and normal to the graphene substrate using an OVITO software package, and then, the number of copper atoms n(z) was calculated in each planner shell with the increasing distance z. The average number distribution of copper atoms
  provided a distinct distribution of copper atoms with a multilayer, bilayer, and monolayer distribution over the graphene substrate.
2.3. Bond order parameters (BOP)
The bond order parameters,36–38 such as Q6, Ŵ6, Q4, and Ŵ4, were calculated to characterize the organization of the copper atoms over the graphene substrate. The Qlm(r), associated with the neighboring copper atoms, was calculated using the following equations:| Qlm(r) ≡ Ylm(θ(r),φ(r)) | (4) |
 | (5) |
 | (6) |
 | (7) |
 | (8) |
2.4. Radial distributions function (RDF)
The probability of finding a copper atom at a distance χ from a central copper atom was calculated through the radial distribution function g(χ)39 as given in eqn (9),
 | (9) |
2.5. Simulation system and equilibration process
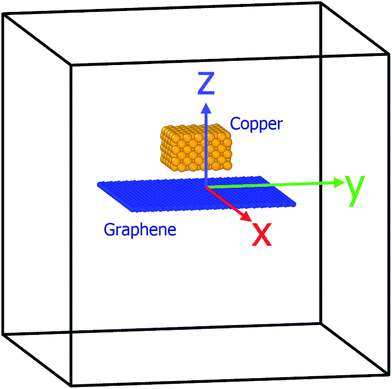
The simulation system used herein was similar to that reported in our previous study.23 The substrate consisted of a square graphene with the edge length = 50 Å, constructed with a network of sp2-hybridized carbon atoms, which were organized into a hexagon.40 The total number of carbon atoms present in the graphene sheet was 1008. Then, 300 copper atoms, as an ideal fcc structure (lattice parameter 3.615 Å), were placed over the graphene substrate, as shown in Fig. 1. After placement, the simulated copper atoms were kept at a temperature of 2500 K for 1000 ps, and graphene substrate was kept at rest. During simulation at 2500 K, copper melted and adsorbed over the graphene substrate, which has been discussed in the next sections.3. Results
The adsorption, organization, and applied force-induced desorption of copper atoms onto the graphene substrate has been discussed in the next three subsections. In the first sub-section, the adsorption of copper atoms over the graphene substrate during solidification/cooling from 2500 K to 10 K has been discussed. Further, in the second sub-section, the organization of copper atoms over the graphene substrate has been discussed. In the third sub-section, the applied force-induced desorption of the copper atoms from graphene substrate has been discussed.3.1. Adsorption of copper atoms over the graphene substrate
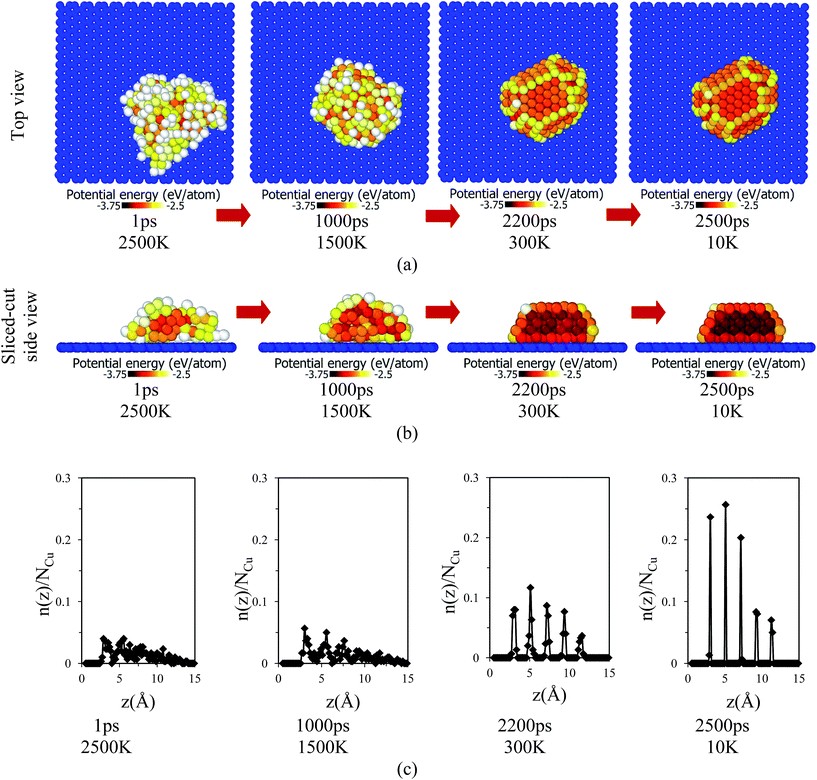
After placement of copper over the graphene substrate, the system equilibrated for 1000 ps at 2500 K, as shown in Fig. 2. Due to high temperature, T = 2500 K, copper melted and formed a globule-like structure over the graphene substrate. The inner region of the copper globule was called a core, while the outer layer of the copper globule was named a shell.45 The non-bonded interaction between the copper atoms and graphene substrate was the driving force for the adsorption of copper atoms. In the solidification/cooling process, the temperature of the copper atoms decreased from 2500 K to 10 K in 2500 ps (cooling rate 1 K ps−1). The temporal evolution of adsorption and organization of copper atoms over the graphene substrate is depicted by a top view and sliced-cut side view of the copper/graphene system in Fig. 3(a) and (b). At high temperature, copper atoms were in a molten state. However, as the temperature decreased, copper solidified over the graphene substrate. The potential energies of copper atoms gradually decreased as the temperature decreased. The dark red- and gray-colored atoms show lower and higher potential energies, respectively, as shown in the color bar in each image. The copper atoms in the shell were at higher potential energies (PE = −3.1 eV to −2.8 eV) compared to the atoms in the core (PE = −3.56 eV). However, the copper atoms at the interface had potential energies of PE = −3.35 eV at the final stage of cooling (i.e. temperature T = 10 K). The potential energy of the copper atoms located at the core was nearly equal to the reported values.41–43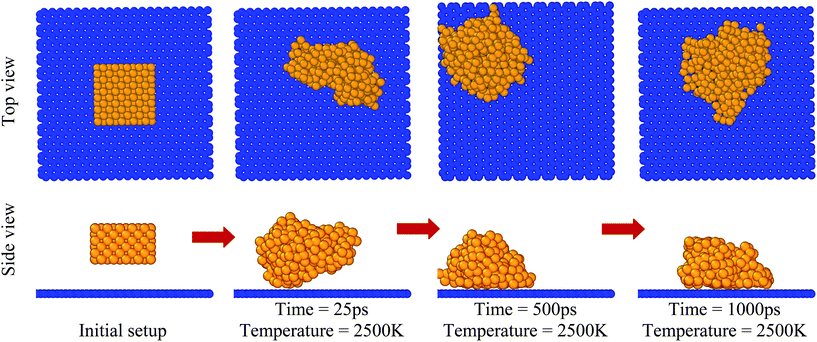 | ||
| Fig. 2 Images of melting and adsorption of copper over the graphene substrate with the progress of simulation at fixed temperature (T = 2500 K). | ||
The average number distribution n(z)/N of copper atoms over the graphene substrate is shown in Fig. 3(c). At high temperatures (T = 2500 and 1500 K), the distribution of copper atoms over the graphene substrate was random, as indicated by fluctuation in the values of n(z)/N. In contrast, as the temperature decreased (T = 300 K and 10 K), the average number distribution of copper atoms showed multiple distinct peaks, which corresponded to layered adsorption of copper atoms over the graphene substrate. At T = 10 K, the first, second, and third layers of copper on the graphene substrate had a z ≈ 3.00 Å, 5.05 Å, and 7.15 Å, respectively.
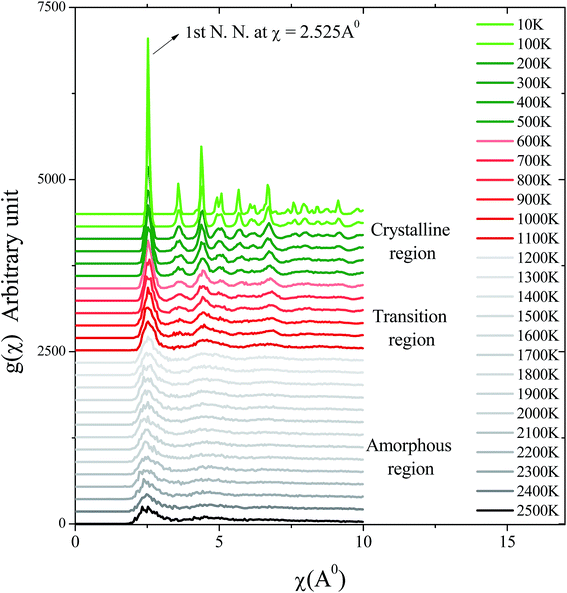
Fig. 4 shows the radial distribution function g(χ) as a function of the radial coordinate χ during the cooling process from T = 2500 K to T = 10 K. Due to the continuously decreasing temperature, amorphous, transition, and crystalline regions were formed. In the amorphous region, a peak of g(χ) evolved at χ ≈ 2.525 Å for the 1st nearest neighbour of copper atoms44,45 (which was found to be nearly equal to  , where a is the lattice parameter of copper, a = 3.615 Å). However, at χ > 2.525 Å, distinct and identifiable peaks were not found at the corresponding temperatures. This signified that the copper atoms were adsorbed with a random organization over the graphene substrate. In the transition region, distinct peaks of g(χ) appeared at χ = 2.525 Å and 4.37 Å for the 1st and 2nd nearest neighbours of copper atoms. The peak of g(χ) for the 2nd nearest neighbour gradually increased as the temperature decreased in the transition region, due to change of phase from the amorphous to the crystalline state of copper over the graphene substrate. In the crystalline region, the peaks of g(χ) for the 1st and 2nd nearest neighbours at r = 2.525 Å and 4.37 Å distinctly evolved with the decreasing temperature.
3.2. Organization of copper atoms over the graphene substrate
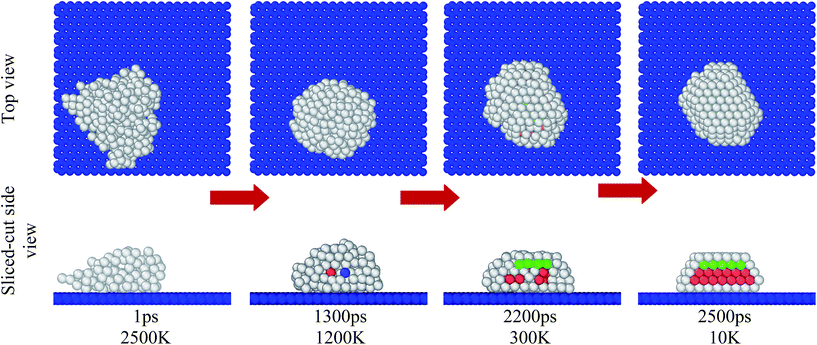
The adaptive common neighbour analysis was used to identify the structural organization of copper atoms over the graphene substrate. Fig. 5 shows the evolution of the fcc, bcc, hcp, and icosahedrons (ico) organization of copper atoms over the graphene substrate as the temperature decreased from 2500 K to 10 K. At elevated temperatures (T > 1200 K), a primarily random or amorphous organization of copper atoms existed. At comparatively lower temperatures (T < 1200 K), copper atoms organized into an fcc and hcp structure. It was observed from the image that hcp, bcc, fcc, and ico atoms started to evolve at the core of the copper globule. In previous studies, the core–shell organization of atoms in the crystalline metal/alloy were observed during the cooling or solidification process.46–49 Fig. 6 depicts the percentage evolution of fcc, hcp, bcc, ico, and other organizations (amorphous or random organization) as a function of the decreasing temperature from 2500 K to 10 K. At high temperatures (T > 1200 K), all the copper atoms were in an amorphous state. However, as the temperature decreased (below T < 1200 K), the copper atoms with the ico, fcc, bcc, and hcp configuration evolved, and subsequently, the number of amorphous atoms decreased. It can be observed from Fig. 6 that the atoms with the ico and bcc configuration evolved for a very short period of time during the early stage of crystal growth and vanished when growth further progressed. On the contrary, atoms with the fcc and hcp configuration continuously evolved to stabilize the crystalline state of copper over the graphene substrate.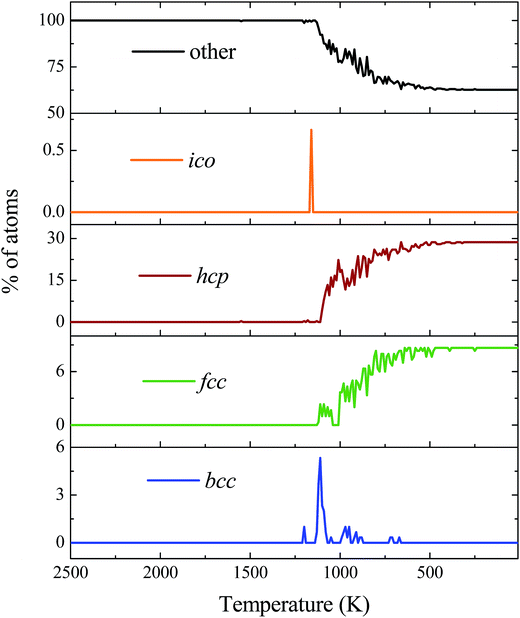 | ||
| Fig. 6 Percentage evolution of ico, fcc, bcc, and hcp copper atoms as a function of decreasing temperature during cooling from 2500 K to 10 K. | ||
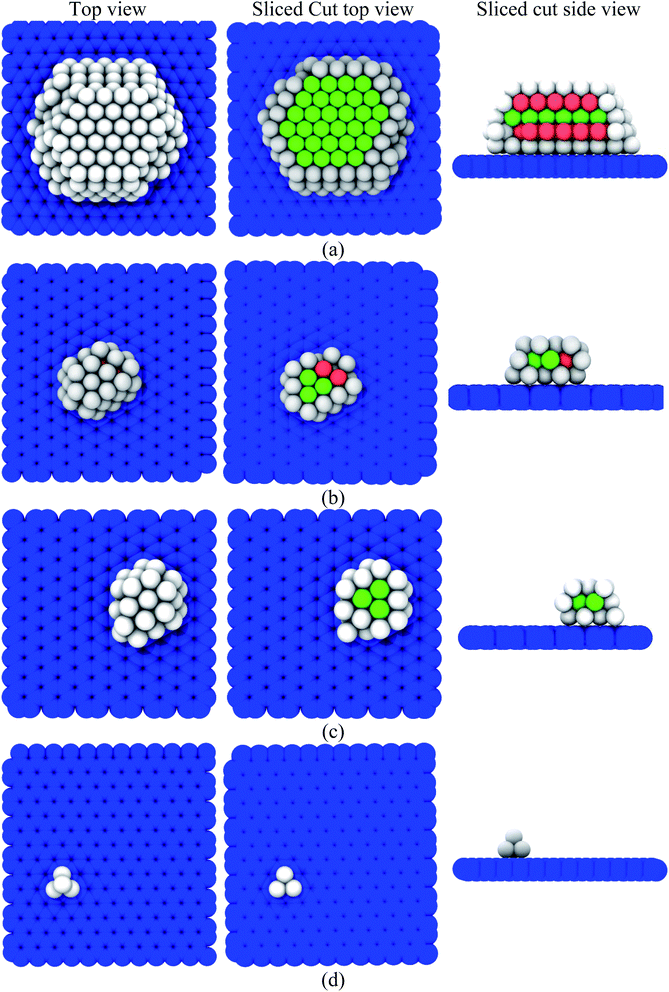
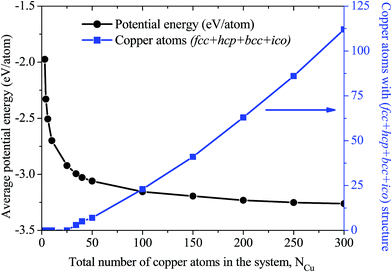
Further, the evolution of the fcc and hcp structure with an increasing number of copper atoms (NCu = 3, 4, 6, 10, 25, 34, 40, 50, 100, 150, 200, 250, and 300 atoms) over the graphene substrate was investigated. Fig. 7(a)–(d) show the top, sliced-cut top, and sliced-cut side views of the organization of the copper atoms over the graphene substrate for NCu = 4, 34, 40, and 250. The evolution of the fcc and hcp structure of copper atoms over the graphene substrate was similar to that of the core–shell arrangements, in which fcc and hcp copper atoms (green and brick red atoms) were positioned at the core and other copper atoms (gray colour) were positioned at the shell, as shown by the sliced-cut top and side views in Fig. 7(a)–(c). The evolution of the structural organization depended on the number of copper atoms or globule size over the graphene substrate, as listed in Table 1. The copper globule, consisting of atoms NCu < 34, showed a metastable solid state and was unable to form the fcc, hcp, and bcc structures over the substrate. On the contrary, a copper cluster (NCu ≥ 34) showed structural organization, in which atoms were organized in fcc and hcp at the core. The similar core–shell arrangement and evolution of structural organization of metal atoms in the bulk (absence of graphene substrate) was studied by Zhang et al.49 Fig. 8 depicts the variation of the average potential energy and evolution of the structural organization of copper atoms over the graphene substrate with an increasing size of the copper globule. A small-sized copper globule (NCu < 34) exhibited a high potential energy compared to the relatively large-sized copper globule ((NCu ≥ 34). Evolution of stable fcc and hcp copper atoms was observed at a lower energy over the graphene substrate. However, as is well-known, the potential energy decreased as the globule size of the metals increased50–52 in bulk (absence of graphene substrate).
| Number of copper atoms in the simulation system | fcc | hcp | bcc | ico | Other |
|---|---|---|---|---|---|
| 3 | 0 | 0 | 0 | 0 | 3 |
| 4 | 0 | 0 | 0 | 0 | 4 |
| 6 | 0 | 0 | 0 | 0 | 6 |
| 10 | 0 | 0 | 0 | 0 | 10 |
| 25 | 0 | 0 | 0 | 0 | 25 |
| 34 | 3 | 0 | 0 | 0 | 31 |
| 40 | 3 | 2 | 0 | 0 | 35 |
| 50 | 5 | 2 | 0 | 0 | 43 |
| 100 | 15 | 8 | 0 | 0 | 77 |
| 150 | 33 | 8 | 0 | 0 | 109 |
| 200 | 63 | 11 | 0 | 0 | 126 |
| 250 | 30 | 56 | 0 | 0 | 164 |
| 300 | 26 | 86 | 0 | 0 | 188 |
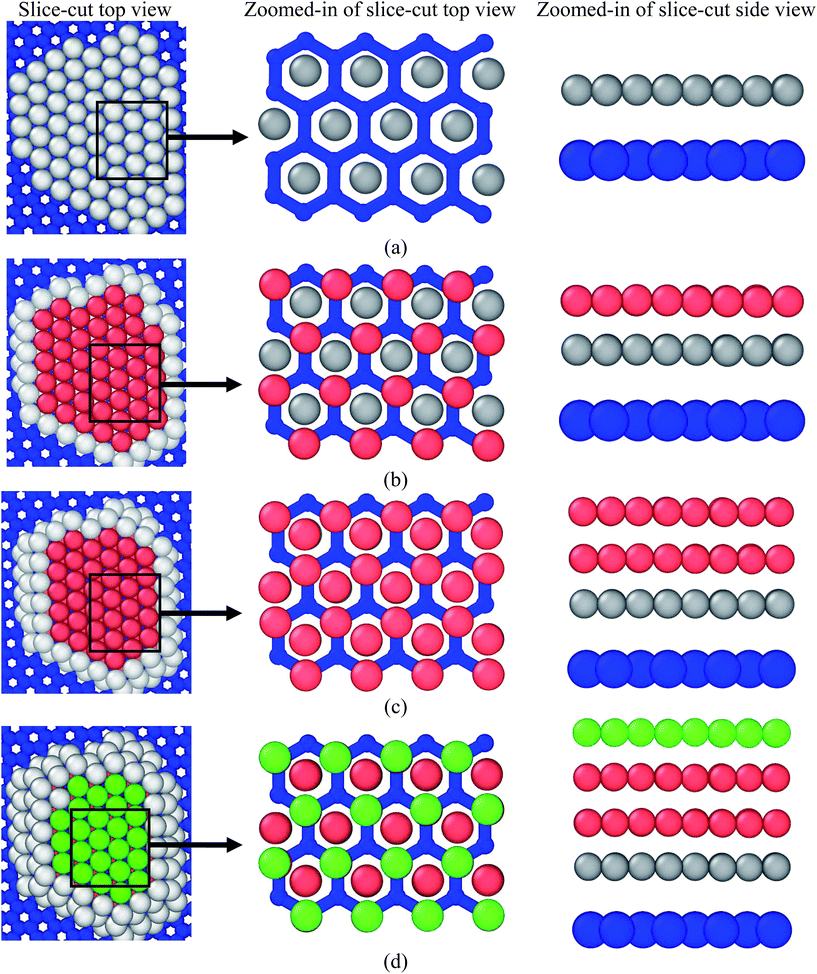
The organization of copper atoms over the graphene substrate is shown in Fig. 9(a)–(d). It can be observed from the image that the copper atoms at the interface (first layer) were organized in the middle of a hexagonal structure on the graphene substrate, as shown in Fig. 9(a). From the bond orientational order parameter, it was observed that the copper atom formed an fcc{111} facet organization, which was confirmed from the values of Q4 = 0.3649, Q6 = 0.7441, W4 = 0.1391, and W6 = −0.0563. The values of Q4, Q6, W4, and W6 were found to be similar to the reported values of an ideal fcc{111} facet as Q4 = 0.375, Q6 = 0.7408, W4 = 0.1340, and W6 = −0.0462.31–33 The organization of copper atoms in the second and third layers or above was found to be hcp and fcc, respectively, as shown in Fig. 9(b)–(d).
3.3. Applied force-induced desorption from the graphene substrate
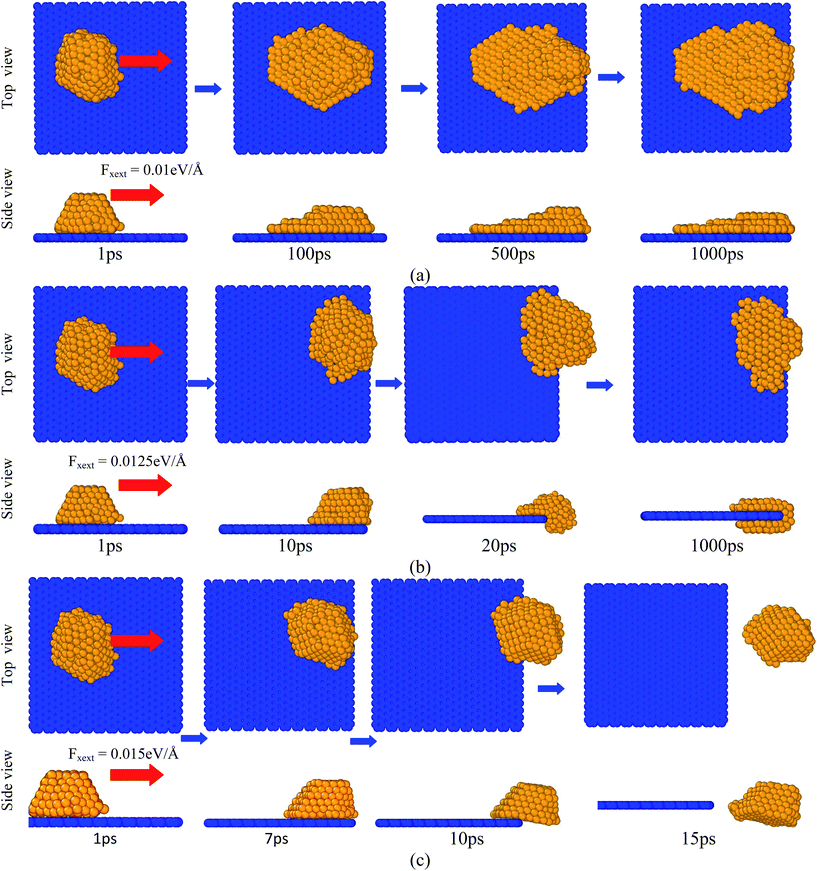
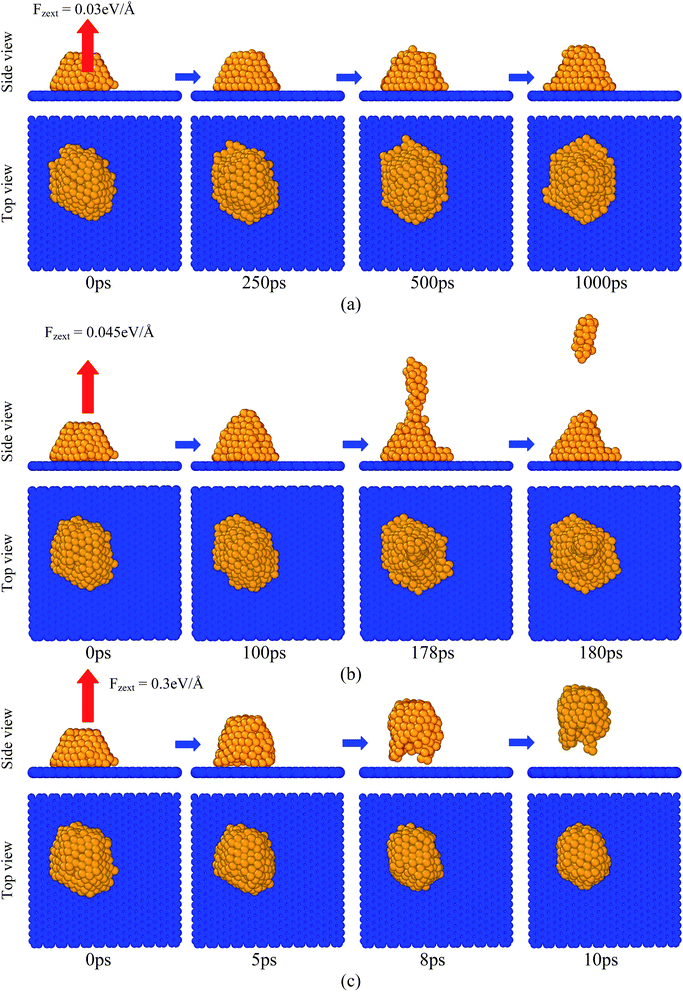
An external force was applied on all the copper atoms to observe the desorption behaviour from the graphene substrate. Herein, two cases were considered for the desorption study. In the first case, an external force (Fxext) was applied on all the copper atoms along the X-axis, as shown in Fig. 10. In the second case, an external force (Fzext) was applied on all the copper atoms perpendicular (z-direction) to the graphene substrate, as shown in Fig. 11. Fig. 10 shows the images of the copper atoms when they were removed from the graphene substrate at various times after application of the force Fxext. The various magnitudes of the used external force were Fxext = 0.01, 0.0125, and 0.015 eV Å−1. Due to the application of a very low Fxext (for example, Fxext = 0.01 and 0.0125 eV Å−1), the copper atoms slid along the graphene substrate, came to the edge, and crawled to the other face of the plane. As observed from the images of the copper atoms near the surfaces at closely spaced time intervals, (i) the copper atoms began to move towards the edge and subsequently accumulated at the edge, leading to a higher number of copper atoms to the copper atom contacts and decreased the number of copper atoms to the surface contacts and (ii) after building up of a sufficient number of copper atoms at the edge, some copper atoms moved to the other face of the plane. The copper atoms did not escape from the graphene substrate when the applied external force was less than or equal to 0.0125 eV Å−1. At a higher applied force (for example, Fxext = 0.015 eV Å−1), the copper atoms escaped from the graphene substrate at a much shorter time, as shown in Fig. 10(c).Fig. 11 shows the images of the copper atoms when they were pulled off perpendicular to the graphene substrate at various times after application of the force Fzext. At very low Fzext (for example, Fzext = 0.03 eV Å−1), the copper atoms remained over the graphene substrate and did not escape from the graphene substrate, as shown in Fig. 11(a). At a moderate applied force (for example, Fzext = 0.045 eV Å−1), a few copper atoms escaped, but atoms closer to the graphene substrate remained adsorbed, as shown in Fig. 11(b). At extremely high external applied force (Fzext = 0.3 eV Å−1), a large number of copper atoms escaped from the graphene substrate in a very short period of time, as shown in Fig. 11(c). Fig. 12(a) and (b) depict the effect of the number of copper atoms on its applied force-induced desorption behaviour from the graphene substrate. It was observed that the system consisted of a comparatively lesser number of copper atoms, unable to escape from the graphene substrate at a moderate value of the external force. For a lesser number of copper atoms, the cluster size was small, and most of the copper atoms adhered to the graphene substrate. In other words, as the cluster size increased, some copper atoms had fewer or zero potential energy benefits (negative non-bonded 12 − 6 LJ potential energy), which were far away from the graphene substrate and very easily desorbed. These observations were valid for both the x- and z-directional desorption from the graphene substrate.
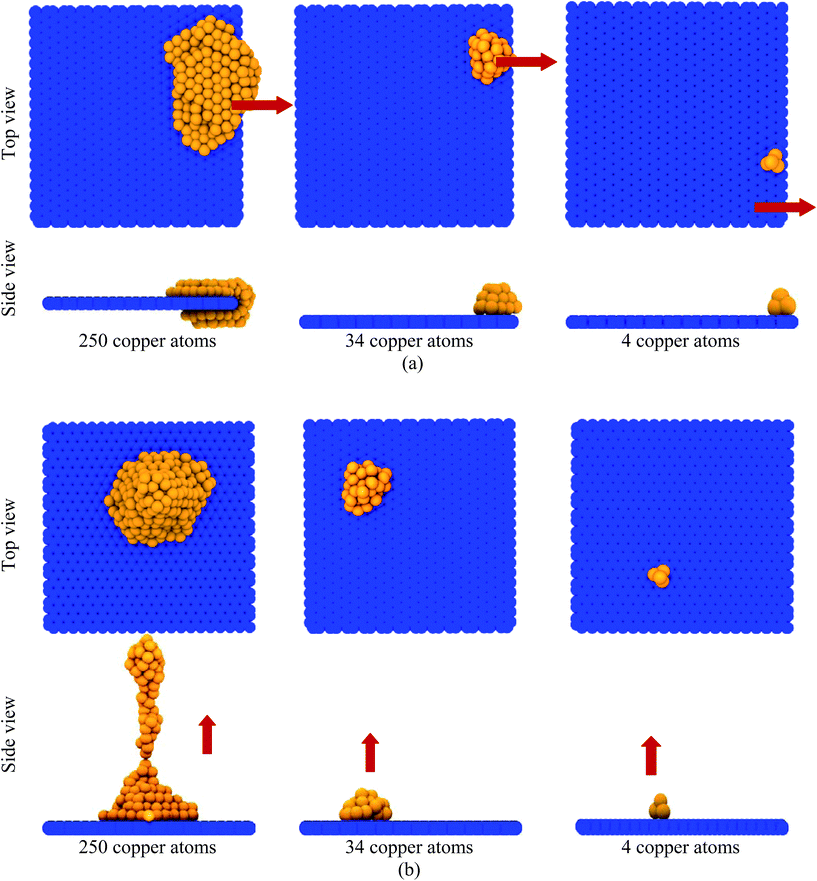 | ||
| Fig. 12 Effect of the number of copper atoms (globule size) on the desorption process from the graphene substrate: (a) pulled along the x-direction by Fxext = 0.0125 eV Å−1 and (b) pulled along the z-direction by Fzext = 0.045 eV Å−1. The red-coloured arrows indicate the direction of the externally applied force. The moderate values of the external force were chosen for both the x- and z-direction based on Fig. 10 and 11. | ||
The critical force was found out to be the minimum force required to remove the copper atoms from the graphene substrate. It was observed that higher critical force was required for the removal of copper atoms from the graphene substrate in the z-direction (perpendicular to the substrate) compared to that in the x-direction. On application of the x-directional force, the copper atoms very easily slid over the substrate because the resistive force was smaller.
4. Conclusions
This study was performed to understand the adhesive capacity of copper atoms to the graphene substrate at the atomic level. To achieve superior adhesion to the graphene substrate, the externally applied force needed to be dissipated through the copper atoms rather than being used to pull atoms from the substrate. It was observed that the applied energy on the copper atoms could be dissipated in two main ways. First, it could be dissipated by the formation of an elongated structure, which produced a new surface area. Second, it could be dissipated by the rearrangement of copper atoms over the hexagonal structure of the graphene substrate. Observations from these simulations led to the following conclusions: The copper atoms organized in the fcc and hcp structure over the graphene substrate at equilibrium.
 At the copper/graphene interface, copper atoms formed an fcc{111} facet organization, as confirmed by the bond orientational order parameter.
 The copper atoms were found to position at just middle of the hexagonal arrangement of the carbon atom of the graphene substrate.
 Higher critical force was required to remove copper atoms from the graphene substrate in the z-direction (perpendicular to the substrate) compared to the x-direction force.
The abovementioned results also implied that the presence of nanosubstrates affected the nature of the response of the metal atoms to stress; thus, this affected the mechanical properties of the metal/nanocomposites. The presence of numerous types of metals further affected the detachment behaviour and the formation of an elongated structure. Moreover, it is envisaged that this study can be extended to more complex systems such as metals, alloys or high entropic alloys. In addition, further analysis of the metal/graphene composite and its impact on its various properties will also help to provide a greater understanding to prevent failures in nanocomposite systems.
References
- C. Lee, X. Wei, J. W. Kysar and J. Hone, Science, 2008, 321, 385–388 CrossRef CAS PubMed.
- J. W. Suk, R. D. Piner, J. An and R. S. Ruoff, ACS Nano, 2010, 4, 6557–6564 CrossRef CAS PubMed.
- K. S. Novoselov, A. K. Geim, S. V. Morozov, D. Jiang, Y. Zhang, S. V. Dubonos, I. V. Grigorieva and A. A. Firsov, Science, 2004, 306, 666–669 CrossRef CAS PubMed.
- X. Du, I. Skachko, A. Barker and E. Y. Andrei, Nat. Nanotechnol., 2008, 3, 491–495 CrossRef CAS PubMed.
- S. F. Bartolucci, J. Paras, M. A. Rafiee, J. Rafiee, S. Lee, D. Kapoor and N. Koratkar, Mater. Sci. Eng., A, 2011, 528, 7933–7937 CrossRef CAS.
- L.-Y. Chen, H. Konishi, A. Fehrenbacher, C. Ma, J. –Q. Xu, H. Choi, H.-F. Xu, F. E. Pfefferkorn and X.-C. Li, Scr. Mater., 2012, 1, 29–32 CrossRef.
- T. S. Koltsova, L. I. Nasibulina, I. V. Anoshkin, V. V. Mishin, E. I. Kauppinen, O. V. Tolochko and A. G. Nasibulin, J. Mater. Sci. Eng. B, 2012, 2, 240–246 CAS.
- J. Wang, Z. Li, G. Fan, H. Pan, Z. Chen and D. Zhang, Scr. Mater., 2012, 66, 594–597 CrossRef CAS.
- J. Hwang, T. Yoon, S. H. Jin, J. Lee, T.-S. Kim and S. H. Hong, Adv. Mater., 2013, 25, 6724–6729 CrossRef CAS PubMed.
- M. Li, H. Che, X. Liu, S. Liang and H. Xie, J. Mater. Sci., 2014, 49, 3725–3731 CrossRef CAS.
- D.-J. Guo, Z.-Y. Wei, B. Shi, S.-W. Wang, L.-Z. Wang, W. Tan and S.-M. Fang, J. Mater. Chem. A, 2016, 4, 8466–8477 CAS.
- K. Chu and C. Jia, Phys. Status Solidi A, 2014, 211, 184–190 CrossRef CAS.
- C. L. P. Pavithra, B. V. Sarada, K. V. Rajulapati, T. N. Rao and G. Sundararajan, Mater. Manuf. Processes, 2016, 31, 1439–1446 CrossRef CAS.
- Y. Chen, X. Zhang, E. Liu, C. He, Y. Han, Q. Li, P. Nash and N. Zhao, J. Alloys Compd., 2016, 688, 69–76 CrossRef CAS.
- D. Zhang and Z. Zhan, J. Alloys Compd., 2016, 658, 663–671 CrossRef CAS.
- R. Jiang, X. Zhou, Q. Fang and Z. Liu, Mater. Sci. Eng., A, 2016, 654, 124–130 CrossRef CAS.
- X. Gao, H. Yue, E. Guo, H. Zhang, X. Lin, L. Yao and B. Wang, Powder Technol., 2016, 301, 601–607 CrossRef CAS.
- G. Song, Z. Wang, Y. Gong, Y. Yang, Q. Fu and C. Pan, RSC Adv., 2017, 7, 1735–1742 RSC.
- R. Jiang, X. Zhou and Z. Liu, Mater. Sci. Eng., A, 2017, 679, 323–328 CrossRef CAS.
- W. J. Kim, T. J. Lee and S. H. Han, Carbon, 2014, 69, 55–65 CrossRef CAS.
- M. N. Amal, R. Asgari and M. R. R. Tabar, Nanotech., 2009, 20, 135602–135610 CrossRef PubMed.
- K. Duan, F. Zhu, K. Tang, L. He, Y. Chen and S. Liu, Comput. Mater. Sci., 2016, 117, 294–299 CrossRef CAS.
- S. Kumar, S. K. Pattanayek, G. G. Pereira and S. Mohanty, Langmuir, 2016, 32, 2750–2760 CrossRef CAS PubMed.
- S. Plimpton, J. Comput. Phys., 1995, 117, 1–19 CrossRef CAS.
- W. Humphrey, A. Dalke and K. Schulten, J. Mol. Graphics, 1996, 14, 33–38 CrossRef CAS PubMed.
- A. Stukowski, Modell. Simul. Mater. Sci. Eng., 2009, 18, 015012–015019 CrossRef.
- M. I. Mendelev, M. J. Kramer, C. A. Becker and M. Asta, Philos. Mag., 2008, 88, 1723–1750 CrossRef CAS.
- Z. Xu and M. J. Buehler, ACS Nano, 2009, 3, 2767–2775 CrossRef CAS PubMed.
- G. J. Martyna, D. J. Tobias and M. L. Klein, J. Chem. Phys., 1994, 101, 4177–4189 CrossRef CAS.
- M. Parrinello and A. Rahman, J. Appl. Phys., 1981, 52, 7182–7190 CrossRef CAS.
- L. Verlet, Phys. Rev., 1967, 159, 98–102 CrossRef CAS.
- H. Tsuzuki, P. S. Branicio and J. P. Rino, Comput. Phys. Commun., 2007, 177, 518–523 CrossRef CAS.
- Z. Y. Hou, K. J. Dong, Z. A. Tian, R. S. Liu, Z. Wang and J. G. Wang, Phys. Chem. Chem. Phys., 2016, 18, 17461–17469 RSC.
- D. Faken and H. Jónsson, Comput. Mater. Sci., 1994, 2, 279–286 CrossRef CAS.
- J. D. Honeycutt and H. C. Andersen, J. Phys. Chem., 1987, 91, 4950–4963 CrossRef CAS.
- Y. Wang, S. Teitel and C. Dellago, Chem. Phys. Lett., 2004, 394, 257–261 CrossRef CAS.
- Y. Wang, S. Teitel and C. Dellago, J. Chem. Phys., 2005, 122, 214722–214738 CrossRef PubMed.
- P. J. Steinhardt, D. R. Nelson and M. Ronchetti, Phys. Rev. B: Condens. Matter Mater. Phys., 1983, 28, 784–805 CrossRef CAS.
- S. Kumar and S. K. Pattanayek, Compos. Sci. Technol., 2016, 134, 242–250 CrossRef CAS.
- M. Al-Haik, M. Y. Hussaini and H. Garmestani, J. Appl. Physiol., 2005, 97, 074306–074309 CrossRef.
- Y. F. Mo, Z. A. Tian, R. S. Liu, Z. Y. Hou and C. C. Wang, J. Non-Cryst. Solids, 2015, 421, 14–19 CrossRef CAS.
- F. E. Prieto and C. Renero, J. Chem. Phys., 1965, 43, 1050–1055 CrossRef CAS.
- M. Böyükata and J. C. Belchior, J. Braz. Chem. Soc., 2008, 19, 884–893 CrossRef.
- M. Isobe and B. J. Alder, J. Chem. Phys., 2012, 137, 194501–194510 CrossRef CAS PubMed.
- W. H. Qi, Mater. Lett., 2006, 60, 1678–1681 CrossRef CAS.
- R. Ferrando, J. Phys.: Condens. Matter, 2014, 27, 013003–013009 CrossRef PubMed.
- E. Panizon and R. Ferrando, Nanoscale, 2016, 8, 15911–15919 RSC.
- G. Rossi and R. Ferrando, Comput. Theor. Chem., 2017, 1107, 66–73 CrossRef CAS.
- N. Zhang, F. Y. Chen and X. Q. Wu, Sci. Rep., 2015, 5, 11984–11992 CrossRef CAS PubMed.
- M. Böyükata and J. C. Belchior, J. Braz. Chem. Soc., 2008, 19, 884–893 CrossRef.
- K. J. Klabunde, J. Stark, O. Koper, C. Mohs, D. G. Park, S. Decker, Y. Jiang, I. Lagadic and D. Zhang, J. Phys. Chem., 1996, 100, 12142–12153 CrossRef CAS.
- M. Kabir, A. Mookerjee and A. K. Bhattacharya, Phys. Rev. A, 2004, 69, 043203–043207 CrossRef.
| This journal is © The Royal Society of Chemistry 2017 |

