DOI:
10.1039/C7RA00958E
(Paper)
RSC Adv., 2017,
7, 17640-17649
Epitaxial crystallization of precisely bromine-substituted polyethylene induced by carbon nanotubes and graphene†
Received
22nd January 2017
, Accepted 8th March 2017
First published on 21st March 2017
Abstract
Precisely substituted polyethylenes have well-defined primary structures and aggregation architecture. Herein, precisely bromine-substituted polyethylene (PE21Br) was chosen as an ideal model to investigate the substituent impact on epitaxial crystallization upon one-dimensional carbon nanotubes (CNT) and two-dimensional reduced graphene oxide (RGO) via solution crystallization. The abilities of different dimensional nanofillers to induce ordered chain packing structures were compared. Transmission electron microscopy (TEM) images showed that kebab-like and rod-like nanofiller-induced crystals were separately observed on the surfaces of CNT and graphene, and selected area electron diffraction (SAED) pattern revealed that the c-axis of the polymer chain was parallel to the surface of RGO. Fast-scan differential scanning calorimetry (Flash DSC) revealed that the melting points of the crystals grown on CNT and graphene were increased by 19 and 99 °C, respectively. More importantly, X-ray diffraction (XRD) suggested that CNT and RGO induced the transition of the crystal structure of PE21Br from the triclinic to orthorhombic form, but with different orderness. More ordered lattice structures and higher melting temperatures of PE21Br/RGO nanocomposites are ascribed to the perfect lattice matching between PE21Br and RGO. This study not only provides a method for fabricating bromine-functionalized polyolefin nanocomposites, but is also anticipated to open up a new opportunity for improving the service temperature of substituted polyethylene by means of epitaxial crystallization.
1. Introduction
Surface-induced polymer crystallization has attracted significant attention from both fundamental and applied aspects of research in the past few years and provides an efficient way to fabricate special structures with desired properties and/or functionality.1–7 The occurrence of the epitaxial crystallization of polymers on foreign surfaces is based on certain crystallographic matches, according to many investigation results: i.e., the mismatching of the contact crystallographic planes between substrate and polymer should not exceed 15%.1,4,7–9 Therefore, one-dimensional or two-dimensional crystallographic matches generate special interactions between the polymer chains and substrate upon contacting the interface, which can alter the crystal structure and morphology of the polymer, as well as the crystallization kinetics.
One-dimensional carbon nanotubes (CNT) and two-dimensional graphene have attracted significant interest in both basic and applied research over the past ten years due to their unique properties.10–13 High surface area is favorable for both of these nanofillers to induce polymer crystallization.14–21 It has been well documented that the topological structure of the substrate has a great impact on the polymer crystallization behavior.22–27 For one-dimensional CNT, the mechanism of CNT inducing polymers to form disk-like crystal lamellae has been described as soft epitaxy.28–30 However, for two-dimensional graphene, lattice matching dominates the surface-induced polymer epitaxial crystallization.17,31,32 Moreover, the morphology and chain packing structure of crystals formed on nanofillers intensively depend on the crystallization mechanism. For instance, CNT can induce the molecular chain of PLLA to form disk-like lamellae and give rise to an ordered conformation during the early period of the overall crystallization.16,33 The crystalline lattice matching of PE and graphene generated thicker edge-on lamellae and a stable monoclinic form.32,34–36 It was also reported that CNT and graphene possess the varied ability to induce polymer crystallization. Li et al.16 found that both one-dimensional CNTs and two-dimensional graphene nanosheets (GNSs) can serve as nucleating agents to accelerate the crystallization kinetics of PLLA, and the nucleation ability of CNTs is stronger than that of GNSs. However, the opposite results have also been reported. Simulation studies again exhibited that graphene has much stronger interactions with polymers and thus displays more important influence on the structures and properties of polymers than CNT as well as other nanoparticles.37,38
In our previous studies,39,40 the precise acyclic diene metathesis polymerization (ADMET) polyethylenes with halogen atoms (F and Cl) placed on each 21st backbone carbon (PE21F and PE21Cl, respectively) were chosen to investigate the effects of structural change upon the epitaxial crystallization of the substituted-polymers. The results showed that CNT had almost no effect on the crystal structure of both PE21F and PE21Cl, whereas reduced graphene oxide (RGO) induced the structural transformation of PE21Cl from the triclinic to orthorhombic form and generated extraordinarily high melting temperatures.39,40 The two distinctively different crystal structures resulting from variant surfaces not only suggest that precisely substituted polyethylenes are an ideal model to study the influence of substituents on epitaxial crystallization, but also indicate the different inducing abilities of CNT and graphene.
The influence of substituents on the chain packing of PE crystals is remarkable and becomes more and more severe with the increasing substituent volume. Taking precision halogen-substituted polyethylene as an example, the orderness of the lattice structure of PE21Br (the precision ADMET polyethylene with bromine placed on each 21st backbone carbon) is much worse compared to those of PE21F and PE21Cl, which hence results in lower melting temperatures.41 In this study, PE21Br was chosen as a model to further investigate the substituent impact on the epitaxial crystallization of a polymer. On the other hand, because of severe interference on the orderness of continuous methylene sequences, a bulkier substituent would be helpful in investigating the capacity of nanofillers with different topological structures to induce substituted polymers to crystallize and generate ordered chain packing structures. The lamellar morphology of polyethylene periodically substituted by bromine, formed on CNT and RGO, is clearly revealed by transmission electron microscopy (TEM); the crystal structures of the nanocomposites have been described on the basis of X-ray diffraction (XRD), and the thermal behaviors were characterized by fast-scan differential scanning calorimetry (Flash DSC 1). We have also discussed the discrepancy between crystal structures and melting temperatures for both nanocomposites. The results obtained are expected to establish a better understanding of the relationship between the structures and properties of the polymer composites enhanced by these two differently structured nanoparticles.
2. Experimental
2.1. Materials
Purified HiPco single-walled CNTs (SWCNTs, with an average diameter of 6 nm) purchased from Times Nanotechnologies Inc. were used as received. RGO was prepared by thermal exfoliation and reduction of graphene oxide (GO).42 The precision ADMET polyethylene with Br atoms placed on each 21st backbone carbon was studied and labeled as PE21Br, where the number corresponds to the precise location of the side group in the PE backbone. The synthesis of PE21Br required the preparation of the α-ω diene monomer, followed by ADMET polymerization41 and subsequent exhaustive hydrogenation, as shown in Scheme 1. The chemical structure was characterized by 1H NMR (see the ESI Fig. S1†). The molecular weight was determined by GPC using an Agilent PL-GPC 220 instrument with HPLC grade chloroform as the mobile phase at the flow rate of 1.0 mL min−1 and calibration with polystyrene standards (Mn = 10![[thin space (1/6-em)]](https://www.rsc.org/images/entities/char_2009.gif) 893 g mol−1, Mw/Mn = 1.79).
893 g mol−1, Mw/Mn = 1.79).
 |
| | Scheme 1 Monomer and polymer synthesis process. | |
2.2. Sample preparation
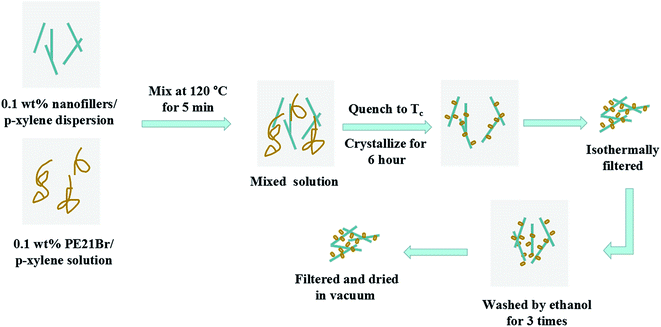
The fabrication process for PE21Br/nanofiller composites is illustrated in Scheme 2. The nanofiller/p-xylene mixed solution with the nanofiller mass concentration of 0.1 wt% was ultrasonicated for 2–3 h at 45 °C to form the nanofiller-p-xylene suspension. The PE21Br/p-xylene mixed solution with PE21Br mass concentration of 0.1 wt% was prepared by dissolving PE21Br in p-xylene at 120 °C for 2 h. Then, 10 g of nanofiller/p-xylene solution was mixed with 10 g of PE21Br/p-xylene solution at 120 °C for 5 min. The mixture was then quenched at the preset crystallization temperature Tc. To avoid SWCNTs from agglomerating and forming small bundles in the solvent, the mixed solution was stirred at 1200 rpm. The sample was isothermally filtered after crystallization for 6 h and after carefully washing 3 times with ethanol, the nanocomposites were dried at 40 °C in vacuum for 36–48 h.
 |
| | Scheme 2 Fabrication process of PE21Br/nanofiller composites. | |
The method used by Xu et al.43–46 for preparing PE nanocomposites, using supercritical CO2 (SC CO2), was employed. The mixture of nanofiller/p-xylene solution and PE21Br/p-xylene solution was prepared by the same procedure as abovementioned. The mixture was then quickly transferred into a stainless steel autoclave at the preset crystallization temperature Tc. SC CO2 was then charged in the autoclave to the desired pressure within a short time. After maintaining the supercritical fluid condition for 3 h, the system was slowly depressurized and the sample was obtained and labelled.
2.3. Characterization
Transmission electron microscopy (TEM) and selected area electron diffraction (SAED) experiments were conducted using a JEOL JEM2100 transmission electron microscope with an accelerating voltage of 200 kV. Nanocomposite suspensions were obtained on a carbon-coated TEM grid. The fast-scan differential scanning calorimetry experiments were performed via the commercialized FSC (Flash DSC1, Mettler-Toledo, Switzerland). Before any analysis, the empty chip-sensor experienced the standard procedure for conditioning and calibration. To achieve a sufficiently good contact between the sample and the chip-sensor, a small trace of silicon oil was dropped onto both cells before the sample and the reference were transferred. The samples were heated from 30 to 240 °C at the scanning rate of 1000 K s−1 and nitrogen gas was used as the protective atmosphere with the constant flow rate of 50 mL min−1. The STARe software (Version 10.0) was employed to perform the data treatment. The X-ray diffraction (XRD) patterns were obtained using a Bruker D8 diffractometer, with Ni-filtered Cu Kα radiation at 40 kV and 30 mA at room temperature at the angles ranging from 5 to 80° at the rate of 3.5° min−1.
3. Results and discussion
3.1. Morphologies of the PE21Br/nanofiller composites
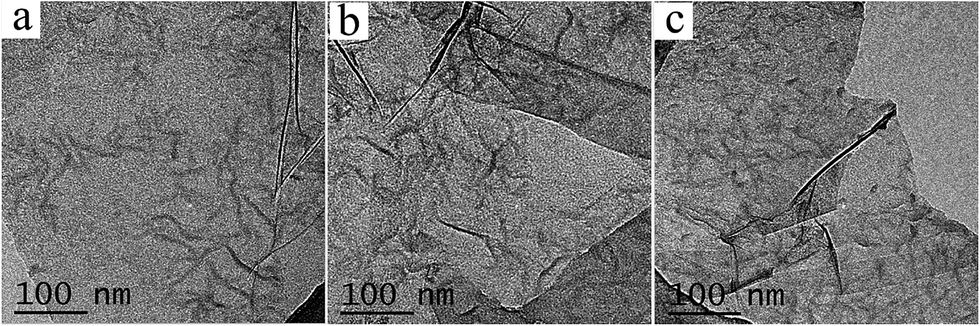
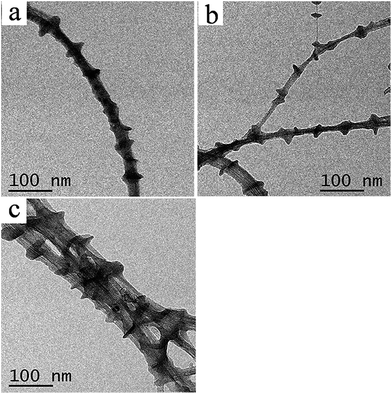
3.1.1. Morphologies of the PE21Br/CNT kebab-like crystals. Fig. 1 shows the PE21Br shish-kebab crystals in which PE21Br lamellae (as the kebab) are periodically decorated on SWCNTs (as shish) at all the selected experimental temperatures. Average sizes of PE21Br lamellae formed on SWCNTs are presented in Table 1 based on the measurement of 200 lamellae. The average diameters of the PE21Br kebab crystals are about 17.2 ± 1.1, 23.2 ± 1.2, and 18.4 ± 0.9 nm for crystallization at 40, 50, and 60 °C, respectively. It is evident that the average diameter of the PE21Br kebab crystals first increases, then decreases with the increase in crystallization temperature, and the kebab crystal with the largest diameter forms at 50 °C. This behavior is consistent with that of PE21F and PE21Cl crystals reported in our previous studies,39,40 which can be attributed to the competition of nucleation and crystal growth on the CNT. Unlike the changes in the diameters, the kebab interval monotonically increases with the increase in the crystallization temperature (Table 1) because the crystal nucleus becomes less and less stable with the decrease in the degree of undercooling. It is well known that lamellae thickness, corresponding to the crystallization of the ethylene sequence, is strongly dependent on the crystallization temperature. Consequently, the thickness of kebab crystals increases with the increasing crystallization temperature: from 6.0 ± 0.6 nm at 40 °C to 6.8 ± 0.5 nm at 60 °C (Table 1). From the data analysis shown in Table 1, one can draw the conclusion that the crystallization temperature has great influence on the size and periodicity of the shish-kebab crystals and the most suitable crystallization temperature for PE21Br/SWCNT in p-xylene is 50 °C. In contrast to the previous study, it was found that the diameter of the PE21Br kebab is much smaller than that of HDPE (50–80 nm)30 and PE21F (54–65 nm) (van der Waals radius of F is 1.52 Å)39 and also smaller than that of PE21Cl (26.2 ± 1.0 nm) (the van der Waals radius of Cl (1.75 Å) is smaller than that of Br (1.85 Å)).40 The diameter of the kebab decreases with the increasing volume of the substituent, indicating that the substituent, as a defect of the chain, greatly influences the lateral growth of the crystal lamellae. A larger substituent also causes greater disturbance of the crystallization of PE, which is evidenced by the fact that the thickness of PE21Br kebabs is smaller than that of PE21F formed at the same undercooling degree (10 °C).39 However, the thickness of kebabs does not consistently decrease, as anticipated, with the increasing volume of the substituents. Unexpectedly, the thickness of PE21Br kebabs (6.8 ± 0.5 nm) is almost the same as that of PE21Cl (6.4 ± 0.5 nm).40 It suggests that PE21Br and PE21Cl crystals formed on CNT have analogous crystallization sequence length.
 |
| | Fig. 1 TEM images of PE21Br/SWCNT nanocomposites produced in p-xylene at different temperatures for 6 h. (a) 40 °C, (b) 50 °C, and (c) 60 °C (both PE21Br and SWCNT concentrations are 0.05 wt%). | |
Table 1 Average size of PE21Br lamellae formed on SWCNT, based on the TEM images of 200 lamellae
| Sample (crystallization temperature) |
Diameter of the kebab-like crystals (nm) |
Thickness of the kebab-like crystals (nm) |
Interval of kebab-like crystals (nm) |
| PE21Br/SWCNT (40 °C) |
17.2 ± 1.1 |
6.0 ± 0.6 |
16.3 ± 1.2 |
| PE21Br/SWCNT (50 °C) |
23.2 ± 1.2 |
6.6 ± 0.5 |
26.7 ± 1.4 |
| PE21Br/SWCNT (60 °C) |
18.4 ± 0.9 |
6.8 ± 0.5 |
34.5 ± 1.4 |
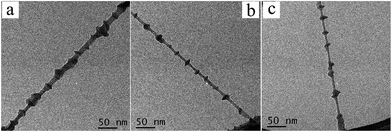
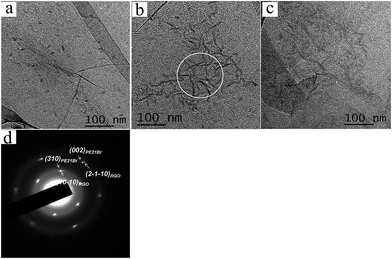
3.1.2. Morphologies of the PE21Br/RGO rod-like crystals. RGO has a two-dimensional flat area, unlike one-dimensional CNT, which is helpful for strict epitaxial crystallization. Three different crystallization temperatures (50, 60, and 70 °C), same as for PE21Br/SWCNT nanocomposites, were chosen to prepare PE21Br/RGO nanocomposites. The crystal morphologies (Fig. 2) show that RGO is covered with rod-like crystals. The rod-like crystals prefer to be arranged in three directions that are about 60° apart from each other, which indicates the strict epitaxial crystallization between PE21Br and RGO. Note that the regularity of PE21Br crystals formed on RGO is much poorer as compared to that of the PE21F and PE21Cl crystals.39,40 The average sizes of PE21Br crystals (listed in Table 2) are about 15 ± 1.2, 54 ± 2.3, and 43 ± 1.5 nm at 50, 60, and 70 °C, respectively, based on the measurement of 200 lamellae. Note that PE21Br/RGO nanocomposites cannot be produced at crystallization temperatures below 50 °C. One can see that only discrete nuclei and quite small rod-like crystals can be observed on the surface of RGO nanosheets at 50 °C. Once the crystallization temperature increases to 60 °C, small nuclei and crystals of PE21Br grow into largest lamellae with an average size of 53 ± 2.3 nm. This effect may be attributed to the lattice matching playing the dominant role in epitaxial crystallization of the polymer on the two-dimensional graphite layer, and PE21Br chains require more time or much higher crystallization temperature to adjust their conformations to the surface of RGO. Even when the crystallization temperature was successively increased to 70 °C, about 6 °C above the melting temperature of PE21Br, rod-like crystals were again formed although the average value of the size of lamellae decreased to 42 ± 1.5 nm. This phenomenon is similar to the crystallization behavior of PE21Br on SWCNT. The density (number/0.01 μm2) of lamellae decreased from 37 at 60 °C to 29 at 70 °C, as given in Table 2. When the isothermal crystallization temperature increases, the number of rod-like crystal lamellae decreases for the less stable crystal nucleus to exist at lower undercooling degree. The average size and density of PE21Br lamellae formed on RGO are also much smaller than those of PE21F and PE21Cl lamellae,39,40 which further indicates that the influence of substituents on crystal growth becomes greater with the increase in substituent volume. We can also see from Table 2 that the thickness of the rod-like crystals increases with the increasing crystallization temperature. It is also suggested that the isothermal crystallization temperature plays a decisive role in the thickness and density of lamellae formed on RGO. By comparing Tables 1 and 2, we found that the average thickness of rod-like crystals of PE21Br formed on RGO is almost the same as that of the kebab crystals formed on SWCNT under the same crystallization conditions, again suggesting that the thickness of PE21Br crystals on both CNT and RGO is determined by the crystallization temperature. However, the uniformity of the thickness of rod-like crystals induced by RGO is better than that of kebab crystals, which may be due to the fact that the two-dimensional RGO is helpful for strict epitaxial crystallization. Comparing PE21Br with PE21F39 and HDPE,17 the maximal thickness and size of PE21Br lamellae formed on RGO is about 6.9 nm and 53 nm, which is smaller than 8.8 nm and 73 nm for PE21F and 13 nm and 100 nm for HDPE. It is also attributed to the influence of Br substituent. The thickness of PE21Br lamellae formed on RGO (6.9 ± 0.4 nm) is also the same as that of PE21Cl (6.5 ± 0.4 nm).40
 |
| | Fig. 2 TEM images of PE21Br/RGO nanocomposites produced in p-xylene at different temperatures for 6 h. (a) 50 °C, (b) 60 °C, and (c) 70 °C. (d) The selected-area electron diffraction (SAED) pattern of the circled area of (b) (both PE21Br and RGO concentrations are 0.05 wt%). | |
Table 2 Average size of PE21Br lamellae formed on RGO based on the TEM images of 200 lamellae
| Sample (crystallization temperature) |
Size of lamellae (nm) |
Thickness of lamellae (nm) |
Density (number/0.01 μm2) |
| PE21Br/RGO (50 °C) |
15 ± 1.2 |
5.0 ± 0.6 |
15 |
| PE21Br/RGO (60 °C) |
53 ± 2.3 |
6.7 ± 0.4 |
37 |
| PE21Br/RGO (70 °C) |
42 ± 1.5 |
6.9 ± 0.4 |
29 |
Fig. 2d shows the selected area electron diffraction (SAED) pattern of the circled area shown in Fig. 2b. Orthorhombic reflection spots of PE21Br can be observed, and the innermost diffractions of PE21Br are overlapped with RGO (1 0 −1 0) diffractions, and the next six symmetric weak PE21Br reflection spots are close to RGO (2 −1 −1 0) reflections. The diffraction patterns of PE21Br crystals formed on the surfaces of RGO are similar to those of polyethylene orthorhombic crystals formed on the surfaces of graphite,31 highly oriented pyrolytic graphite (HOPG),32 and RGO.17 They are also identical to those of PE21F39 and PE21Cl40 orthorhombic crystals formed on the surfaces of RGO: the (002) and (310) reflection spots of the orthorhombic form are close to the (2 −1 −1 0) and (1 0 −1 0) reflections of RGO, respectively. According to the abovementioned analysis, we can deduce that PE21Br rod-like crystals formed on the surfaces of RGO are the orthorhombic form, and the PE21Br chains in the edge-on crystal are parallel to the basal plane of the RGO sheets.
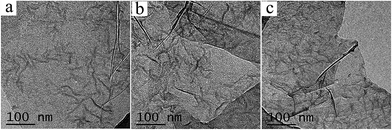
3.1.3. PE21Br/nanofiller composites prepared with the assistance of supercritical CO2. Supercritical CO2 (SC CO2) could facilitate the crystallization of polymers because of the antisolvent effect,43 which was used herein to further study the influence of crystallization conditions on the epitaxial crystallization of PE21Br. PE21Br/nanofiller composites were prepared in p-xylene at 50 °C for PE21Br/SWCNT nanocomposites and 60 °C for PE21Br/RGO nanocomposites, with the assistance of SC CO2; the experimental pressure of SC CO2 was tuned from 10 to 15 to 20 MPa. The crystallization morphologies are shown in Fig. 3 and 4. In these cases, the average size of the PE21Br lamellar crystals formed on SWCNT and RGO are listed in Tables 3 and 4. SWCNTs are apt to agglomerate and form small bundles at SC CO2 pressure, and it becomes gradually serious as the SC CO2 pressures increase. Therefore, the diameter of SWCNT is much thicker than that produced without SC CO2 (Fig. 1). After 3 h of isothermal crystallization with the assistance of SC CO2, the diameter of PE21Br crystals formed on SWCNT at 50 °C and 10 MPa is 25.8 ± 1.3 nm, larger than that of crystals formed after 6 h of isothermal solution crystallization (23.2 ± 1.2 nm, Table 1). As the SC CO2 pressure increased, the diameter of PE21Br formed on SWCNT at 15 MPa increased to 27.5 ± 1.3 nm. Similarly, the lamellae size of PE21Br formed on RGO at 10 MPa is 63 ± 3.0 nm, also larger than that of crystals formed without the assistance of SC CO2 after 6 h of isothermal solution crystallization (Table 2). It is suggested that SC CO2 can accelerate the lateral growth of the lamellae. The diameter of the PE21Br kebab decreases with the increasing pressure of SC CO2, from 27.5 ± 1.3 at 15 MPa to 24.5 ± 1.4 nm at 20 MPa. This rule can also be observed in the PE21Br/RGO system, as indicated in Table 4. The average sizes of the rod-like crystals of PE21Br/RGO nanocomposites are about 63 ± 3.0, 70 ± 3.3, and 48 ± 2.2 nm for 10, 15, and 20 MPa, respectively. This phenomenon has also been observed in our previous work39,40 and can be attributed to the amount and speed of the PE21Br precipitation being greatly increased at excessively high CO2 pressure. The intervals of kebabs of PE21Br formed on SWCNT became smaller due to the large deposition of the PE21Br chain, from 24.9 ± 1.4 nm at 10 MPa and 25.3 ± 1.2 nm at 15 MPa to 23.5 ± 1.3 nm at 20 MPa. Same trend was followed by the density of the lamellae of PE21Br formed on RGO. The thickness of the lamellar crystals produced with the assistance of SC CO2 (Tables 3 and 4) is almost consistent with that prepared by traditional solution crystallization. This suggests that SC CO2 can promote the lateral growth of lamellae on CNT and RGO, but it cannot change the thickness of the crystal lamellae, which is directly related to the crystallization temperature. We can conclude that the optimum SC CO2 pressure is 15 MPa, at which the rod-like lamellae crystals possess the maximum size.
 |
| | Fig. 3 TEM images of PE21Br/SWCNT nanocomposites produced at different SC CO2 pressures: (a) 10 MPa, (b) 15 MPa, and (c) 20 MPa in p-xylene at 50 °C for 3 h. | |
 |
| | Fig. 4 TEM images of PE21Br/RGO nanocomposites produced at different SC CO2 pressures: (a) 10 MPa, (b) 15 MPa, and (c) 20 MPa in p-xylene at 60 °C for 3 h. | |
Table 3 Average size of PE21Br lamellae formed on SWCNT with the assistance of SC CO2, based on the TEM images of 200 lamellae
| Sample (pressure) |
Diameter of kebab crystals (nm) |
Thickness of kebab crystals (nm) |
Interval of kebab crystals (nm) |
| PE21Br/SWCNT (10 MPa) |
25.8 ± 1.3 |
6.7 ± 0.8 |
24.9 ± 1.4 |
| PE21Br/SWCNT (15 MPa) |
27.5 ± 1.3 |
6.7 ± 0.7 |
25.3 ± 1.2 |
| PE21Br/SWCNT (20 MPa) |
24.5 ± 1.4 |
6.8 ± 0.8 |
23.5 ± 1.3 |
Table 4 Average size of PE21Br lamellae formed on RGO with the assistance of SC CO2 based on the TEM images of 200 lamellae
| Sample (pressure) |
Size of lamellae (nm) |
Thickness of lamellae (nm) |
Density (number/0.01 μm2) |
| PE21Br/RGO (10 MPa) |
63 ± 3.0 |
6.7 ± 0.8 |
43 |
| PE21Br/RGO (15 MPa) |
70 ± 3.3 |
6.9 ± 0.7 |
55 |
| PE21Br/RGO (20 MPa) |
48 ± 2.2 |
6.9 ± 0.8 |
65 |
3.2. Thermal behavior of PE21Br/nanofiller composites
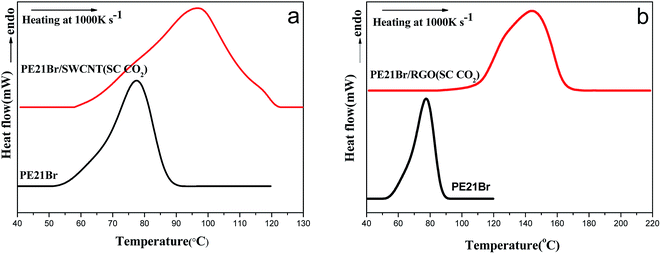
Fig. 5 shows the melting behaviors of PE21Br/nanofiller composites measured by fast-scan differential scanning calorimetry (Flash DSC). Flash DSC is sensitive to detecting quite small masses of samples (as low as 10 ng), and the abnormally fast heating rate can completely suppress the melting recrystallization.47 The melting peak temperature of PE21Br is 77.6 °C, measured by Flash DSC, which is 13 °C higher than that measured by traditional DSC. The melting temperature shifted to higher temperature compared with traditional DSC because of the superheating effect48,49 and thermal lags.47
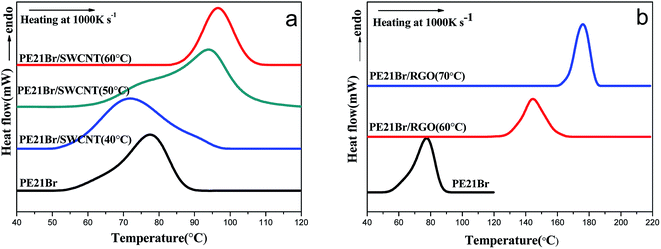 |
| | Fig. 5 First heating curves of PE21Br and PE21Br/nanofiller composites at Flash DSC measurement at the heating rate of 1000 K s−1. (a) PE21Br/SWCNT nanocomposites and (b) PE21Br/RGO nanocomposites. | |
As reflected in Fig. 5a, the melting temperature of the PE21Br/SWCNT nanocomposite crystallized at 40 °C is 71.7 °C, 6 °C lower than that of PE21Br. It is suggested that the thickness of the lamellae of the PE21Br/SWCNT nanocomposite prepared at lower crystallization temperature is much smaller than that of pure PE21Br. The melting temperatures increase with the increasing crystallization temperature, from 94.0 °C at 50 °C to 96.8 °C at 60 °C, which is up to 19 °C higher than that of PE21Br. The increase rate of melting temperature with the crystallization temperature is higher than that of PE21F/SWCNT nanocomposites,39 indicating that higher crystallization temperature is needed for incorporating larger substituents to form longer methylene sequences or adjusting the conformation due to the hindrance of the substituent. Surprisingly, the melting temperature of the PE21Br/RGO nanocomposites is 144.5 °C for crystallization at 60 °C (Fig. 5b), which is 67 °C higher than that of PE21Br. Moreover, the melting temperatures of PE21Br/RGO nanocomposites increased to 176.0 °C at the crystallization temperature of 70 °C. PE21Br/RGO crystals and PE21Br/SWCNT crystals have similar thickness as abovementioned, which convinced us that the remarkably higher melting temperatures are not caused by the thicker lamellae formed on RGO: i.e., there should be another factor inducing this particular behavior. It is known that PE21Br has a lower melting temperature compared to PE21F because the bulkier Br substituent disturbs the length of the continuous methylene sequences.51 However, PE21Br/SWCNT nanocomposites prepared at higher crystallization temperatures and PE21Br/RGO nanocomposites possess particularly higher melting temperatures. These results suggest that SWCNT and RGO may induce PE21Br to form crystals with different structures, which can be indicated by abovementioned SAED and has been illustrated by XRD in the following section. Furthermore, the melting range of polymers can also be a reflection of the uniformity of lamellae thickness. It is evident that the melting ranges (span of onset-end shown in Table 5) of PE21Br/RGO composites are smaller than those of PE21Br/SWCNT composites prepared at the same crystallization temperature, which is consistent with the result that the uniformity of the thickness of crystals on RGO is better than that on CNT.
Table 5 Melting data of PE21Br and PE21Br/nanofiller composites
| Sample (crystallization temperature) |
Tm (°C) peak |
Tm (°C) onset |
Onset-end (°C) |
| PE21Br |
77.6 |
62.3 |
24.8 |
| PE21Br/SWCNT (40 °C) |
71.7 |
55.9 |
37.1 |
| PE21Br/SWCNT (50 °C) |
94.0 |
73.2 |
32.1 |
| PE21Br/SWCNT (60 °C) |
96.8 |
87.9 |
18.7 |
| PE21Br/RGO (60 °C) |
144.5 |
131.0 |
28.9 |
| PE21Br/RGO (70 °C) |
176.0 |
166.3 |
18.1 |
PE21Br/nanofiller composites produced at 60 °C and 15 MPa SC CO2 pressure were taken as examples for investigating the influence of SC CO2 on the melting behavior of PE21Br crystals. Fig. 6 shows the melting behaviors measured by Flash DSC. The melting temperatures are given in Table 6. The melting peak temperature of PE21Br/SWCNT nancomposites produced at 60 °C is 96.9 °C for 15 MPa, which is almost consistent with that prepared by traditional solution crystallization (96.8 °C in Table 5). The same result is also observed in PE21Br/RGO nanocomposites. This effect further confirms that the determinant of crystal lamellae thickness is the crystallization temperature, which is also in agreement with the analysis of TEM images (Tables 3 and 4). The melting ranges of PE21Br/SWCNT and PE21Br/RGO nanocomposites prepared at 60 °C and 15 MPa SC CO2 pressure are 60.2 and 53.8 °C, respectively, which are larger than those of the nanocomposites prepared by traditional solution crystallization (18.7 and 28.9 °C, as shown in Table 5). This also suggests that more lamellae with inhomogeneous thickness were formed under SC CO2 because of the large amount and speed of the PE21Br precipitation. Similar to that produced by traditional solution crystallization, the melting range of PE21Br/RGO nanocomposites is smaller than that of PE21Br/SWCNT nanocomposites at SC CO2.
 |
| | Fig. 6 First heating curves of PE21Br and PE21Br/nanofiller composites produced at 70 °C and different SC CO2 pressures, as observed in the Flash DSC measurement at the constant heating rate of 1000 K s−1. (a) PE21Br/SWCNT nanocomposite and (b) PE21Br/RGO nanocomposite. | |
Table 6 Melting data of PE21Br and PE21Br/nanofiller composites produced at 15 MPa SC CO2 pressure
| Sample |
Tm (°C) peak |
Tm (°C) onset |
Onset-end (°C) |
| PE21Br |
77.6 |
62.3 |
24.8 |
| PE21Br/SWCNT |
96.9 |
61.8 |
60.2 |
| PE21Br/RGO |
144.1 |
112.1 |
53.8 |
3.3. Crystalline structure of the PE21Br/nanofiller composites
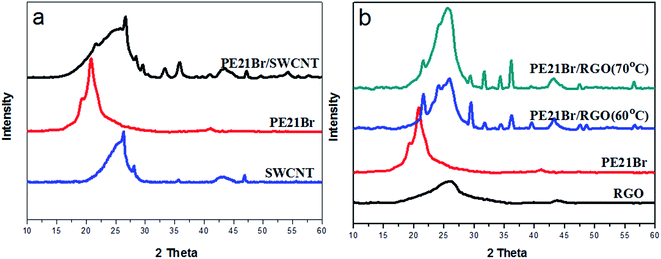
X-ray diffraction (XRD) was conducted to investigate the crystal structure of PE21Br/nanofiller composites. As shown in Fig. 7a and Table 7, two peaks centered at 19.1° and 20.8° in the XRD pattern of PE21Br can be indexed as (100) and (010) diffractions of the triclinic form, respectively;50 however, the two diffractions become quite poor or even disappear. Instead, two new peaks that appear at 21.7° and 23.1° in PE21Br/SWCNT nanocomposites could be assigned to (110) and (200) diffractions of the orthorhombic form, respectively (Table 7). The orthorhombic form structure can also be confirmed according to the higher 2θ peaks 29.9°, 35.9°, and 39.9°, which can be indexed as (210), (020), and (011) diffractions of the orthorhombic form, respectively. The other peaks can be assigned to the contribution of SWCNT. From the abovementioned XRD results, we can draw a conclusion that SWCNT induced PE21Br to form an ordered lattice structure although PE21Br has a larger volume of the substituent. The orthorhombic lattice parameters of the PE21Br/SWCNT nanocomposite were calculated to be a = 7.501, b = 4.974, and c = 2.548 Å, which fall between those of PE21F (a = 7.515, b = 4.989, and c = 2.547 Å)39 and HDPE (a = 7.410, b = 4.934, and c = 2.547 Å). Likewise, XRD results of the PE21Br/RGO nanocomposites are shown in Fig. 7b. A series of diffraction peaks of orthorhombic form centered at 21.6°, 24.0°, 29.5°, 36.3°, and 39.5° were again observed from PE21Br/RGO nanocomposites prepared at 60 °C (Table 7). The other peaks can again be assigned to the contribution of RGO. On increasing the crystallization temperature of the PE21Br/RGO nanocomposites to 70 °C (Fig. 7b), two peaks at 21.6° and 24.0° assigned to (110) and (200) reflections of orthorhombic form become weak, which can be attributed to the fact that the quantity of epitaxial crystallized lamellae is small, especially at lower undercooling degree. The XRD results of the PE21Br/RGO nanocomposites indicate that the crystal structure of PE21Br epitaxially crystallized on the surface of RGO was transformed into the orthorhombic form from the triclinic form. This also supports the conclusion drawn from the analysis of the SAED pattern (Fig. 2d). The orthorhombic lattice parameters of PE21Br/RGO nanocomposites, calculated to be a = 7.416, b = 4.945, and c = 2.549 Å, also fall between those of PE21F39 and HDPE. The lattice parameters of PE21Br/RGO nanocomposites are larger than those of the PE21Cl/RGO nanocomposite (a = 7.314, b = 4.920, and c = 2.541 Å)40 although both PE21Br and PE21Cl were induced by RGO to form orthorhombic structures. This indicates that the crystal structure of the PE21Br/RGO nanocomposite is less ordered than that of the PE21Cl/RGO nanocomposite because of the disturbance of the bulkier Br substituent. We can also find that the lattice parameters of PE21Br/RGO nanocomposites are lower than those of PE21Br/SWCNT nanocomposites, further indicating the different orderness of two crystals. X-ray diffractograms of PE21Br/nanofiller composites prepared with the assistance of SC CO2 show the same results. This effect indicates that although it can effectively promote the lateral growth of lamellae on CNT and RGO, SC CO2 cannot change the crystal structure of the PE21Br/nanofiller composites.
 |
| | Fig. 7 XRD diffractograms of PE21Br, nanofillers, and PE21Br/nanofiller composites. (a) PE21Br/SWCNT nanocomposites and (b) PE21Br/RGO nanocomposites. | |
Table 7 XRD reflections for PE21Br and PE21Br/nanofiller composites
| Sample |
Packing cell |
2θ (deg) |
| 010 |
100 |
110 |
200 |
210 |
020 |
011 |
| PE21Br |
Triclinic |
19.1 |
20.8 |
|
|
|
|
|
| PE21Br/SWCNT |
Orthorh |
|
|
21.5 |
24.1 |
29.6 |
36.1 |
39.6 |
| PE21Br/RGO (60 °C) |
Orthorh |
|
|
21.6 |
24.0 |
29.5 |
36.3 |
39.5 |
| PE21Br/RGO (70 °C) |
Orthorh |
|
|
21.6 |
24.0 |
29.5 |
36.3 |
39.5 |
Obviously, although the bromine substituent can be incorporated into the crystalline lattice of the PE backbone,50,51 it reduces the orderness of the continuous methylene sequences. Eventually, triclinic crystals are formed to facilitate the minimum spatial requirements to accommodate the bulky Br groups between adjacent molecules in the crystal,50,51 which also results in the much lower melting temperature of PE21Br compared to that of PE and PE21F with orthorhombic form. However, RGO and CNT transformed the triclinic form of PE21Br into the orthorhombic form according to the abovementioned results. The same crystal structure with different orderness may be attributed to different mechanisms of crystal formation on the SWCNT and RGO. For RGO, lattice matching should play the dominant role in polymer epitaxial crystallization. On the basis of structural analysis of epitaxial crystallization, the chain direction 〈001〉 and the {110} plane of the orthorhombic PE21Br are parallel to the 〈2 −1 −10〉 direction and the (0001) plane of RGO, respectively.17,32 However, only the chain axis of PE21Br, 〈010〉, may be indexed as parallel to the 〈2 −1 −10〉 RGO.17,32 Using the lattice parameters of PE21Br and RGO, we calculated the lattice mismatch value along the chain axis of PE21Br to be 3.6% for the orthorhombic form, while the lattice mismatch along the direction perpendicular to the chain axis is 3.8%.31,32 The periodic length of the PE21Br triclinic form along the chain axis was 4.15–5.27 nm (ref. 52) and then the lattice mismatch value was much larger than 15%. Therefore, PE21Br has epitaxial crystallization on RGO only with the orthorhombic form. One-dimensional CNT can also induce the transformation of the crystal from the triclinic form of PE21Br to the orthorhombic form, but the lattice parameter of the PE21Br lamellae formed on SWCNT is slightly larger than that formed on RGO because of the absence of strict lattice matching. Therefore, different mechanisms of SWCNT and RGO result in different capacities, where both nanofillers induce substituted polymers to crystallize and generate the ordered chain packing structure. The experimental results are in good agreement with those obtained by computer simulation.37,38 Ordered lattice structure caused by epitaxial crystallization causes the melting temperature of polymers to notably increase, which allows models for fabricating functional polyolefin materials with high service temperature and provides guidance to prepare polymer-carbonaceous nanocomposites with expected physical properties as well as other functionalities.
4. Conclusion
The epitaxial crystallization behavior of PE21Br on two different types of structural nanofillers was investigated. SWCNT and RGO induced the structural transformation of PE21Br from the triclinic form to the orthorhombic form, which generated extraordinarily high melting temperatures. The different orthorhombic lattice parameters and melting temperatures of PE21Br/SWCNT and PE21Br/RGO nanocomposites are ascribed to different mechanisms of PE21Br crystallization on SWCNT and RGO. SC CO2 can accelerate the lateral growth of lamellae and form lamellae with inhomogeneous thickness on nanofillers. This finding has attracted our interest in further investigating the epitaxial crystallization behavior of other precision systems with bulkier substituents and higher content of substituents.
Acknowledgements
This work is financially supported by the National Natural Science Foundation of China (No. U1532114 and 51403110), Natural Science Foundation of Zhejiang Province (LY15B040003), Natural Science Foundation of Ningbo Municipal (2015A610021), and K. C. Wong Magna Fund in Ningbo University.
References
- S. Cheng, W. Hu, Y. Maand and S. Yan, Polymer, 2007, 48, 4264–4270 CrossRef CAS.
- B. Na, K. Wang, P. Zhao, Q. Zhang, R. Du, Q. Fu, Z. Yu and E. Chen, Polymer, 2005, 46, 5258–5267 CrossRef CAS.
- Y. J. Park, S. J. Kang, B. Lotz, M. Brinkmann, A. Thierry, K. J. Kim and C. Park, Macromolecules, 2008, 41, 8648–8654 CrossRef CAS.
- H. Chang, J. Zhang, L. Li, Z. Wang, C. Yang, I. Takahashi, Y. Ozaki and S. Yan, Macromolecules, 2009, 43, 362–366 CrossRef.
- J. Yang, C. Wang, K. Wang, Q. Zhang, F. Chen, R. Du and Q. Fu, Macromolecules, 2009, 42, 7016–7023 CrossRef CAS.
- R. Su, K. Wang, Q. Zhang, F. Chen, Q. Fu, W. Xu and B. Na, J. Phys. Chem. B, 2009, 113, 7423–7429 CrossRef CAS PubMed.
- J. Zhang, Y. Duan, S. Yan, C. Yang, I. Takahashi and Y. Ozaki, Macromolecules, 2010, 43, 5315–5322 CrossRef.
- J. C. Wittmann and B. Lotz, Prog. Polym. Sci., 1990, 15, 909–948 CrossRef CAS.
- S. Yan, F. Katzenberg, J. Petermann, D. Yang, Y. Shen, C. Straupe, J. C. Wittmann and B. Lotz, Polymer, 2000, 41, 2613–2625 CrossRef CAS.
- A. Thess, R. Lee, P. Nikolaev, H. J. Dai, P. Petit and J. Robert, Science, 1996, 273, 483–487 CAS.
- S. J. Tans, M. H. Devoret, H. J. Dai, A. Thess, R. E. Smalley and L. J. Geerligs, Nature, 1997, 386, 474–477 CrossRef CAS.
- M. J. Allen, V. C. Tung and R. B. Kaner, Chem. Rev., 2010, 110, 132–145 CrossRef CAS PubMed.
- H. Kim, A. A. Abdala and C. W. Macosko, Macromolecules, 2010, 43, 6515–6530 CrossRef CAS.
- X. Zheng and Q. Xu, J. Phys. Chem. B, 2010, 114, 9435–9444 CrossRef CAS PubMed.
- M. S. P. Shaffer and A. H. Windle, Adv. Mater., 1999, 11, 937–941 CrossRef CAS.
- J. Z. Xu, T. Chen, C. L. Yang, Z. M. Li, Y. M. Mao, B. Q. Zeng and B. S. Hsiao, Macromolecules, 2010, 43, 5000–5008 CrossRef CAS.
- S. Cheng, X. Chen, Y. G. Hsuan and C. Y. Li, Macromolecules, 2012, 45, 993–1000 CrossRef CAS.
- J. Yue, Q. Xu, Z. Zhang and Z. Chen, Macromolecules, 2007, 40, 8821–8826 CrossRef CAS.
- X. Zheng, Q. Xu, L. He, N. Yu, S. Wang, Z. Chen and J. Fu, J. Phys. Chem. B, 2011, 115, 5815–5826 CrossRef CAS PubMed.
- F. Zhang, H. Zhang, Z. Zhang, Z. Chen and Q. Xu, Macromolecules, 2008, 41, 4519–4523 CrossRef CAS.
- S. Manna and A. K. Nandi, J. Phys. Chem. C, 2007, 111, 14670–14680 CAS.
- J. Z. Xu, G. J. Zhong, B. S. Hsiao, Q. Fu and Z. M. Li, Prog. Polym. Sci., 2014, 39, 555–593 CrossRef CAS.
- S. Yang, D. Meng, J. Sun, W. Hou, Y. Ding, S. Jiang, Y. Huang and J. Geng, RSC Adv., 2014, 4, 25051–25056 RSC.
- W. Zhu, O. Yang, J. Sun, J. Memon, C. Wang, J. Geng and Y. Huang, Carbon, 2013, 62, 501–509 CrossRef.
- F. Mai, K. Wang, M. Yao, H. Deng, F. Chen and Q. Fu, J. Phys. Chem. B, 2010, 114, 10693–10702 CrossRef CAS PubMed.
- H. Deng, T. Skipa, R. Zhang, D. Lellinger, E. Bilotti, I. Alig and T. Peijs, Polymer, 2009, 50, 3747–3754 CrossRef CAS.
- H. Deng, T. Skipa, E. Bilotti, R. Zhang, D. Lellinger, L. Mezzo, Q. Fu, I. Alig and T. Peijs, Adv. Funct. Mater., 2010, 20, 1424–1432 CrossRef CAS.
- S. L. Kodjie, L. Li, B. Li, W. Cai, C. Y. Li and M. Keating, J. Macromol. Sci., Part B: Phys., 2006, 45, 231–245 CrossRef CAS.
- C. Y. Li, L. Li, W. Cai, S. L. Kodjie and K. K. Tenneti, Adv. Mater., 2005, 17, 1198–1202 CrossRef CAS.
- L. Li, C. Y. Li and C. Ni, J. Am. Chem. Soc., 2006, 128, 1692–1699 CrossRef CAS PubMed.
- F. Tuinstra and E. Baer, J. Polym. Sci., Part B: Polym. Phys., 1970, 8, 861–865 CrossRef CAS.
- Y. Takenaka, H. Miyaji, A. Hoshino, A. Tracz, J. K. Jeszka and I. Kucinska, Macromolecules, 2004, 37, 9667–9669 CrossRef CAS.
- X. Hu, H. An, Z. M. Li, Y. Geng, L. Li and C. Yang, Macromolecules, 2009, 42, 3215–3218 CrossRef CAS.
- A. Tracz, J. K. Jeszka, I. Kucinska, J. P. Chapel, G. Boiteux and M. Kryszewski, J. Appl. Polym. Sci., 2002, 86, 1329–1336 CrossRef CAS.
- A. Tracz, I. Kucinska and J. K. Jeszka, Macromolecules, 2003, 36, 10130–10132 CrossRef CAS.
- A. Tracz, I. Kucinska and J. K. Jeszka, Polymer, 2006, 47, 7251–7258 CrossRef CAS.
- Y. Li, M. Kroger and W. K. Liu, Macromolecules, 2012, 45, 2099–2112 CrossRef CAS.
- Y. Li, Polymer, 2011, 52, 2310–2318 CrossRef CAS.
- W. Miao, Y. Lv, W. Zheng, Z. Wang and Z. R. Chen, Polymer, 2016, 83, 205–213 CrossRef CAS.
- W. Miao, Z. Wang, Z. Li, W. Zheng and Z. R. Chen, Polymer, 2016, 94, 53–61 CrossRef CAS.
- E. Boz, A. J. Nemeth, R. G. Alamo and K. B. Wagener, Adv. Synth. Catal., 2007, 349, 137–141 CrossRef CAS.
- B. Wang, H. Li, Z. Li, P. Chen, Z. Wang and Q. Gu, Compos. Sci. Technol., 2013, 89, 180–185 CrossRef CAS.
- Z. Zhang, Q. Xu, Z. Chen and Z. Yue, Macromolecules, 2008, 41, 2868–2873 CrossRef CAS.
- F. Zhang, Q. Xu, H. Zhang and Z. Zhang, J. Phys. Chem. C, 2009, 113, 18531–18535 CAS.
- N. Yu, X. Zheng, Q. Xu and L. He, Macromolecules, 2011, 44, 3958–3965 CrossRef CAS.
- N. Yu, L. He, Y. Ren and Q. Xu, Polymer, 2011, 52, 472–480 CrossRef CAS.
- A. Toda, K. Taguchi, K. Nozaki and M. Konishi, Polymer, 2014, 55, 3186–3194 CrossRef CAS.
- H. Gao, J. Wang, C. Schick, A. Toda, D. Zhou and W. Hu, Polymer, 2014, 55, 4307–4312 CrossRef CAS.
- Z. Li, X. Jiang, H. Gao, D. Zhou and W. Hu, J. Therm. Anal. Calorim., 2014, 118, 1531–1536 CrossRef CAS.
- R. G. Alamo, K. Jeon, R. L. Smith, E. Boz, K. B. Wagener and M. R. Bockstaller, Macromolecules, 2008, 41, 7141–7151 CrossRef CAS.
- E. Boz, K. B. Wagener, A. Ghosal, R. Fu and R. G. Alamo, Macromolecules, 2006, 39, 4437–4447 CrossRef CAS.
- M. Tasaki, H. Yamamoto, M. Hanesaka, K. Tashiro, E. Boz, K. B. Wagener, C. Ruiz-Orta and R. G. Alamo, Macromolecules, 2014, 47, 4738–4749 CrossRef CAS.
Footnote |
| † Electronic supplementary information (ESI) available. See DOI: 10.1039/c7ra00958e |
|
| This journal is © The Royal Society of Chemistry 2017 |

 Open Access Article
 This Open Access Article is licensed under a Creative Commons Attribution-Non Commercial 3.0 Unported Licence
 a,
Bingjie Wangb,
Yiguo Li
a,
Bingjie Wangb,
Yiguo Li