 Open Access Article
Formation of Pt–Ag alloy on different silicas – surface properties and catalytic activity in oxidation of methanol†
Joanna Wisniewska and
Maria Ziolek *
*
Adam Mickiewicz University in Poznan, Faculty of Chemistry, ul. Umultowska 89b, 61-614 Poznan, Poland. E-mail: ziolek@amu.edu.pl
First published on 31st January 2017
Abstract
The idea of this work was to specify the conditions of alloying silver and platinum loaded on different silicas, i.e. commercial amorphous silica, MCF and NbMCF mesoporous cellular foams and to estimate the influence of the metal species on the activity and selectivity of the catalysts in the oxidation of methanol. For this purpose different amounts of both metals were used for achieving Ag/Pt molar ratios between 1.6 and 5.1. The obtained materials were characterized by nitrogen adsorption isotherms, XRD, TEM, XPS and UV-Vis. The measurements were performed after drying the materials at 333 K, followed by their calcination in air at 773 K and activation in argon or hydrogen flow at 673 K. Pt–Ag alloy was formed after calcination independently of the structure and composition of the support, if the Ag/Pt molar ratio achieved at least 2.5. On the majority of samples the alloy disappeared after activation in argon or hydrogen flow, with the exception of 0.5Pt2Ag/MCF material activated in argon. Structural properties of the support influenced the particle size of the alloy and in this way determined the stability of Pt–Ag alloy in this material. The role of the bimetallic alloy on the activity and selectivity of the catalysts in methanol oxidation is discussed in this paper. The metal species on the supports, sensitive to thermal activation in argon or hydrogen media, did not change during the catalytic oxidation of methanol.
1. Introduction
Bimetallic nanocrystals, supported on inorganic oxides, appear to be promising in enhancement of activity in many reactions through forming new active sites and inducing synergistic effects.1,2 Such materials can exhibit different nanostructures (heterostructure, core–shell, ensemble type, alloy) according to the metal nature and content, metal–support interaction, atmosphere and temperature of activation.1 Besides all bimetallic structures, alloy nanoparticles have attracted increasing attention. Alloying causes multiple changes in the physicochemical properties of the metallic components. As far as the catalytic properties are concerned, two effects are important: the ensemble (geometric) and ligand (electronic) effects. The first one defines the number of atoms in a specific geometric orientation required for enhancement of a particular catalytic reaction and the second one concerns modification of the electron density distribution as a consequence of formation of missed bonds. These two effects are usually simultaneously present and lead to improvement of catalytic activity of bimetallic catalysts.3,4It is well known that platinum is one of the best catalysts in oxidation reactions.5 However, its high cost and easy poisoning by carbon monoxide are the reasons prompting the search for improvement of Pt-based catalysts properties. The attempts involving alloying of Pt with other transition metals have been particularly successful and led to the discovery of several promising Pt-based bimetallic catalysts showing improved catalytic activity.6–8 Silver is another one of the most popular transition metals used for catalytic oxidation.9–12 Silver containing alloy nanoparticles also display desired synergistic effect, improving catalytic properties, e.g. Au–Ag alloy nanocrystals deposited on different supports display enhanced activity and/or selectivity in oxidation of CO,13,14 glucose15 and methanol.16
The most challenging in preparation of Pt–Ag nanocrystals is to make Pt and Ag miscible.17,18 According to the phase diagram, it is possible to get an alloy only with a very high atomic content of either Ag or Pt. However, theoretical and experimental studies show that miscibility between different metals can be greatly increased with decreasing in their particle sizes.18 According to literature, Pt–Ag alloy nanoparticles can be synthesized by: simultaneous reduction of these metals,17,19–22 wet impregnation and further reduction in H2 flow,23 radiolytic method,24 ion implantation and electrodeposition method.25 Because of different reduction kinetics and the thermodynamics the immiscible phase, segregations of Ag atoms on the PtAg alloy surface can be also observed.26,27
So far the catalyst containing PtAg alloy nanoparticles have been applied mainly in the field of electrocatalysis, especially for electrooxidation of methanol.17,18,20,28–30 Besides electrocatalytic application, Hwang et al.23 are the only authors who have tested alumina-supported platinum–silver alloy nanoparticle in low-temperature CO oxidation. Pt–Ag/Al2O3 catalyst, prepared by wet impregnation, displayed significantly improved activity and largely lowered activation energy barrier when compared to those of both pure Pt and pure Ag catalysts at room temperature. The Langmuir–Hinshelwood mechanism, in which CO adsorbs to Pt active sites and O2 gets activated on adjacent Ag sites, has been proposed for the Pt–Ag catalyst to explain the promoted CO oxidation kinetics. The little knowledge about Pt–Ag alloy nanoparticles and their catalytic properties in heterogeneous catalysis has inspired us to focus our studies on this topic.
In our previous work31 we have prepared bimetallic (Pt–Ag) catalysts based on MCF mesoporous cellular foams, also modified with Nb and Ta and applied the so obtained catalysts in methanol oxidation. The intended Ag/Pt atomic ratio was 1.8 (wt Ag![[thin space (1/6-em)]](https://www.rsc.org/images/entities/char_2009.gif) :
:![[thin space (1/6-em)]](https://www.rsc.org/images/entities/char_2009.gif) Pt = 1
Pt = 1![[thin space (1/6-em)]](https://www.rsc.org/images/entities/char_2009.gif) :
:![[thin space (1/6-em)]](https://www.rsc.org/images/entities/char_2009.gif) 1). In such composition of both metals, the metallic platinum and silver as well as cationic metal species were observed on the support surface depending on the pre-treatment. Moreover, Pt–Ag ensembles were recognized. However, Pt–Ag alloy was not formed.
1). In such composition of both metals, the metallic platinum and silver as well as cationic metal species were observed on the support surface depending on the pre-treatment. Moreover, Pt–Ag ensembles were recognized. However, Pt–Ag alloy was not formed.
In this work we have changed the bimetallic composition and applied different Ag/Pt ratios with silver used in excess. On the basis of literature, we expected that the formation of platinum–silver alloy would be possible if silver was used in high excess.
Taking into account the results from ref. 31 in this work we applied MPTMS (3-mercaptopropyltrimethoxysilane) as a functionalizing agent used before metals loading and niobium for the modification of MCF support. In the previous work it was shown that the synergistic effects between niobium and silver enhanced the catalyst activity in methanol oxidation and that the catalysts prepared after functionalization with MPTMS were more effective in methanol oxidation than those prepared by functionalization with APTMS (3-aminopropyltrimethoxysilane).
The idea of this work was to find the composition of platinum and silver most suitable for the formation of metals alloy, estimate the interaction of metals in alloy with niobium in the support, determine the stability of the alloy and its activity in methanol oxidation. Moreover, the effect of silica structure, amorphous commercial silica vs. mesoporous MCF silica, on the surface and catalytic properties was also analyzed in this work.
2. Experimental
2.1. Synthesis and functionalization of MCF and NbMCF supports
MCF and NbMCF supports were prepared according to the procedure described in ref. 32 and our previous paper.31 Then, the supports were grafted with 3-mercaptopropyltrimethoxysilane (MPTMS) (95%, Sigma-Aldrich) to functionalize their surface before modification with metals. As a reference support, commercial, amorphous silica (Ultrasil) was used. The details of the preparation protocols are shown in the ESI data.†2.2. Modification of functionalized supports with platinum and/or silver
To obtain monometallic and bimetallic catalysts the same procedure as in our previous work31 was used, see the ESI data.† In this paper, we used different bimetallic compositions and applied the following Ag![[thin space (1/6-em)]](https://www.rsc.org/images/entities/char_2009.gif) :
:![[thin space (1/6-em)]](https://www.rsc.org/images/entities/char_2009.gif) Pt wt ratios: 1.0
Pt wt ratios: 1.0![[thin space (1/6-em)]](https://www.rsc.org/images/entities/char_2009.gif) :
:![[thin space (1/6-em)]](https://www.rsc.org/images/entities/char_2009.gif) 0.5, or 2.0
0.5, or 2.0![[thin space (1/6-em)]](https://www.rsc.org/images/entities/char_2009.gif) :
:![[thin space (1/6-em)]](https://www.rsc.org/images/entities/char_2009.gif) 0.5, or 2.0
0.5, or 2.0![[thin space (1/6-em)]](https://www.rsc.org/images/entities/char_2009.gif) :
:![[thin space (1/6-em)]](https://www.rsc.org/images/entities/char_2009.gif) 1.0 that correspond to the following atomic ratios: 3.6, 7.2, and 3.7, respectively. In the catalysts symbols, the numbers indicate the intended metals weight loading, e.g. 1Pt2Ag/M means the intended 1 wt% of Pt and 2 wt% of Ag. In this work, we focused on treatment conditions of modified materials during activation. To clarify the catalysts symbols reference to different treatment conditions, Table 1 gives the activation conditions for each material used in this work.
1.0 that correspond to the following atomic ratios: 3.6, 7.2, and 3.7, respectively. In the catalysts symbols, the numbers indicate the intended metals weight loading, e.g. 1Pt2Ag/M means the intended 1 wt% of Pt and 2 wt% of Ag. In this work, we focused on treatment conditions of modified materials during activation. To clarify the catalysts symbols reference to different treatment conditions, Table 1 gives the activation conditions for each material used in this work.
| Catalyst symbola | The sequence of treatment conditions |
|---|---|
| a D – drying at 333 K, for 12 h. Ar – activation in Ar flow at 673 K, for 2 h, H2 – activation in H2 flow at 673 K, for 2 h. | |
| 0.5Pt2Ag/M-D | As prepared sample, drying: 333 K, 12 h |
| 0.5Pt2Ag/M | Drying: 333 K, 12 h |
| Calcination in air: 773 K, 4 h | |
| 0.5Pt2Ag/M-Ar | Drying: 333 K, 12 h |
| Calcination in air: 773 K, 4 h | |
| Activation in Ar flow (40 cm3 min−1): 673 K, 2 h | |
| 0.5Pt2Ag/M-H2 | Drying: 333 K, 12 h |
| Calcination in air: 773 K, 4 h | |
| Activation in H2 + Ar flow (10 cm3 min−1 + 30 cm3 min−1): 673 K, 2 h | |
2.3. Activation of catalysts
Before methanol oxidation, the samples were activated in the flow of argon (40 cm3 min−1) or mixture of hydrogen and argon (10 + 30 cm3 min−1). For this purpose, the samples in the form of powder were pressed (<2 MPa), crushed and the fraction of particles from 0.5 to 1.0 mm was collected to be used in the reaction. The 0.04 g of the sample was put into the flow-bed reactor (length l = 70 mm and Ø = 5 mm) and the catalyst was heated from room temperature to 673 K at a rate 10 K min−1. Then the sample was activated for 2 h at 673 K.2.4. Characterization
The materials prepared were characterized by using ICP-OES, N2-adsorption/desorption, Transmission Electron Microscopy (TEM), X-ray diffraction (XRD), X-ray fluorescence (XRF), ultraviolet-visible (UV-Vis) spectroscopy, and X-ray photoelectron spectroscopy (XPS). All these techniques are described in details in the ESI data (S3-SD†), according to our previous papers.31,33 Catalysts after activation and methanol oxidation were characterized by X-ray diffraction, ultraviolet-visible (UV-Vis) spectroscopy and Scanning Transmission Electron Microscopy (STEM).2.5. Methanol oxidation
Catalytic reaction was performed in fixed-bed flow reactor, as described in our previous works31,33 and ESI data (S4-SD†). This time, we focused on the effect of pretreatment conditions on catalytic activity of prepared bimetallic systems. Thus, before catalytic reaction, samples were activated in Ar or H2 + Ar mixture at 673 K for 2 h.The following products detected by FID and TCD detectors were taken into account: methanol, formaldehyde, methyl formate, dimethoxymethane, dimethyl ether, and carbon dioxide. The carbon balance was ca. 95%. The product distribution was illustrated by selectivities.
3. Results and discussion
3.1. Composition and structure of catalysts
It is known that the isomorphous substitution of niobium into MCF mesoporous cellular foams is not an effective process and usually ca. 2.5 times less niobium is incorporated to MCF silica than the amount used in the preparation procedure.31,34 In this work the Si/Nb atomic ratio achieved in NbMCF support was 159 (the intended value was 64). The amounts of platinum and silver loaded on three supports: MCF (denoted as M), NbMCF (indicated as NbM) and commercial silica (denoted as Si) are shown in Table 2.| Catalyst | Real amount Pt [wt%] | Real amount Ag [wt%] | Intended Ag/Pt wt ratio | Real Ag/Pt wt ratio | Real Ag/Pt molar ratio | Efficiency of Ag loading |
|---|---|---|---|---|---|---|
| 1Ag/M | — | 0.7 | — | — | — | 74 |
| 2Ag/M | — | 1.8 | — | — | — | 92 |
| 0.5Pt/M | 0.5 | — | — | — | — | — |
| 1Pt/M | 1.0 | — | — | — | — | — |
| 0.5Pt1Ag/M | 0.5 | 0.7 | 2.0 | 1.4 | 2.5 | 68 |
| 0.5Pt2Ag/M | 0.5 | 1.1 | 4.0 | 2.3 | 4.2 | 57 |
| 1Pt2Ag/M | 1.0 | 0.9 | 2.0 | 0.9 | 1.6 | 46 |
| 0.5Pt1Ag/NbM | 0.5 | 0.8 | 2.0 | 1.6 | 2.9 | 80 |
| 0.5Pt2Ag/NbM | 0.5 | 1.4 | 4.0 | 2.8 | 5.1 | 70 |
| 1Pt2Ag/NbM | 1.0 | 1.3 | 2.0 | 1.3 | 2.4 | 66 |
| 0.5Pt1Ag/Si | 0.5 | 1.0 | 2.0 | 2.0 | 3.6 | 100 |
| 0.5Pt2Ag/Si | 0.5 | 1.4 | 4.0 | 2.8 | 5.1 | 69 |
| 1Pt2Ag/Si | 1.0 | 1.4 | 2.0 | 1.4 | 2.5 | 68 |
The use of MPTMS as a functionalizing agent anchored to the supports before metals loading allowed the incorporation of platinum with 100% efficiency. In contrast, the efficiency of silver loading was mostly lower and depended on the amount of platinum in the mixture of modifiers and the composition of the support. The presence of niobium in NbMCF support enhanced the incorporation of silver because of strong silver–niobium interaction described in ref. 31 and observed also in this work. The higher amount of platinum (1 wt% instead of 0.5 wt%) lowered the efficiency of silver loading because of the higher chemical affinity of thiol groups to platinum than to silver species resulted in a stronger interaction between SH end-group in MPTMS and the platinum source (chloroplatinic ion). However, even without platinum, silver loading did not reach 100%.
For the same intended composition of metals content, 0.5Pt1Ag/support, or 0.5Pt2Ag/support, or 1Pt2Ag/support, the real Ag/Pt atomic ratio was much higher on NbMCF than on MCF support. Moreover, for the same intended Ag/Pt wt ratio equal to 2.0, the real Ag/Pt ratio was much higher if lower amounts of both modifiers were used (0.5Pt1Ag/support instead of 1Pt2Ag/support) irrespective of the nature of the support. In each series of the catalysts based on different supports, the highest real Ag/Pt molar ratio was on 0.5Pt2Ag/support (4.2 for MCF support and 5.1 for two other supports). Thus, not only the ratio of metals in the modifiers mixture but also the amount of each metal source determined the final ratio between silver and platinum. Both parameters influenced the stability of metal species.
The calculation of metal contents from XPS spectra gives information about the metal concentrations on the surface of the materials. A comparison between the content of platinum and silver species in the bulk (calculated from ICP OES) and on the surface (estimated from XPS spectra) is shown in Table S1-SD.† It is clear that the concentration of platinum and silver on the surface is much lower than in the bulk which indicates that the preferential location of metals is in pores.
The structural parameters calculated from nitrogen adsorption/desorption isotherms are shown in Table 3 for the supports and the MCF mesoporous cellular foam loaded with the highest amounts of platinum and silver. MCF material exhibits high cell and window diameters. Interestingly, the decrease in window diameter was much higher than in the cell one after modification of MCF with niobium species. This proves that niobium present in the synthesis gel modified the structural parameters of mesoporous cellular foam, mainly the window size. It is supported by the shape of the hysteresis loop much wider for NbMCF than for MCF sample (Fig. S1-SD†). The mean pore volume was almost the same for MCF and NbMCF materials, whereas platinum and silver loading on MCF led to a significant decrease in the mean pore volume and surface area but only slightly changed the cell and window sizes. It indicates that both metals were located inside the pores. The surface area and mean pore volume of commercial silica were much lower than those in both MCF and NbMCF samples.
3.2. Surface properties and stability of Pt–Ag alloy
The contents of platinum and silver species were estimated on the basis of XRD, UV-Vis DRS, and XPS study. The studies were carried out after different pre-treatments of the samples modified with platinum and/or silver species, namely after (i) drying at 333 K for 12 h, (ii) drying at 333 K for 12 h and calcination at 773 K for 4 h, (iii) followed by activation at 673 K for 2 h in inert gas (Ar), (iv) and activation in reducing mixture (10 cm3 H2 and 30 cm3 Ar) i.e. in the conditions applied for activation before oxidation of methanol.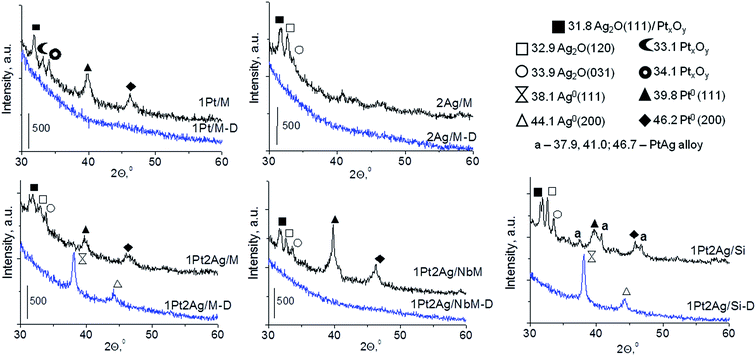 | ||
| Fig. 1 XRD patterns of mono and bimetallic catalysts after drying at 333 K (denoted as D) and calcination at 773 K. | ||
In the diffractograms of dried bimetallic samples the presence or absence of XRD peaks depends on the nature of the support and the amount of silver species introduced (Fig. 1 and S3-SD†). Three materials, 1Pt2Ag/M-D, 0.5Pt2Ag/Si-D, and 1Pt2Ag/Si-D, revealed two reflexes from (111) and (200) faces around 2θ = 38.1° and 44.1° in XRD patterns. These reflexes were assigned to metallic silver particles37 (JCPDS no. 04-073). They appeared only on silica supports (MCF and amorphous SiO2) and when using the excess of silver. One cannot exclude the presence of metallic silver and platinum in all the samples but they are highly dispersed so they do not give any reflexes in XRD pattern. Interestingly, on NbMCF support loaded by silver and platinum, no dried sample showed XRD peaks suggesting very high dispersion of both metallic species on this support.
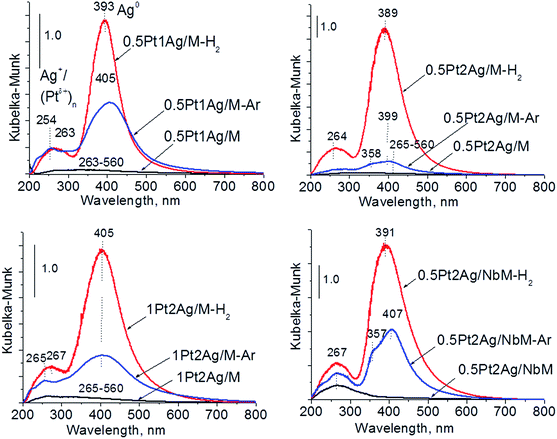
Calcination (treatment at 773 K in air) of the dried materials totally changed the XRD patterns (Fig. 1 and S3-SD†). The diffractograms of dried materials exhibited XRD peaks from metallic silver, while the XRD pattern after calcination showed the disappearance of metallic silver and the appearance of peaks characteristic of Ag2O at 2θ = 32.9° and 33.9° (ref. 35) [JCPDS 76-1393]. The third reflex at ca. 31.8° can originate from both, platinum and silver oxides. The peaks assigned to metal oxides are present in the XRD patterns of all calcined materials. Moreover, in all XRD patterns of calcined materials two reflexes at 39.8° (111) and 46.23° (200) come from metallic platinum species36,38 (JCPDS no. 04-0802). It means that calcination caused agglomeration of metallic platinum to the particle size detected in XRD technique. A significant change in XRD patterns after calcination of the materials also involves the appearance of new XRD peaks at 2θ = 37.7°, 40.9°, and 46.8°. According to literature23,39 the peaks positioned between those assigned to pure Pt and pure Ag indicate Pt–Ag alloy formation. Thus the XRD patterns of calcined materials (Fig. 2) indicate the presence of both metallic forms, Pt–Ag alloy and separated metallic platinum besides the platinum and silver oxides. It is clearly seen that only 1Pt2Ag/M and 1Pt2Ag/NbM samples do not show well separated peaks from Pt–Ag alloy but these peaks can be covered by shoulders in the XRD patterns. These two materials show the lowest Ag/Pt molar ratio: 1.6 and 2.4, respectively (Table 2). A comparison of intensity of the reflexes assigned to Pt–Ag alloy and ICP-OES data indicates that the excess of silver in relation to platinum is necessary for the formation of Pt–Ag alloy. However, 1Pt2Ag/Si calcined material exhibits very well distinguished XRD peaks originated from Pt–Ag alloy despite the relatively low atomic ratio of silver to platinum (2.5). Thus, one can conclude that the structure of the support plays also an important role in the alloy formation. The most intense reflexes were observed for the samples with high Ag/Pt molar ratio (e.g. 0.5Pt2Ag/M–Ag/Pt = 4.6; 0.5Pt2Ag/NbM–Ag/Pt = 5.1). Thus, the excess of silver in relation to platinum is crucial for the alloy formation and the structure of the support is also an important feature. Platinum–silver alloy was not observed in the materials previously studied31 in which Ag/Pt molar ratio was 1.8. UV-Vis diffuse reflectance spectroscopy (UV-Vis DRS) allowed the observation of bands assigned to charge transfers in metallic species (Fig. 3). As regards the bimetallic materials based on amorphous silica and MCF, the UV-Vis DR spectra of fresh, calcined samples revealed complex broad bands with well distinguished two maxima at 264 nm and 340 nm. The first band can be due to the charge transfer n* → d in the unreduced Pt2+,40 or to d–d electron transfer in platinum nanoparticles, or to 4d10 → 4d9s1 transition characteristic of well-dispersed Ag+ cations and/or small Agnδ+ clusters.41 Both charge transfers in silver species gave rise to a band at ca. 340 nm. The latter band can also originate from transition in Ptnδ+ clusters. The long tails in the region of higher wavelengths can cover the band characteristic of d–d electron transfer in Pt–Ag alloy.39,42 Such a band is well visible in the UV-Vis DR spectra of the materials based on amorphous silica. The use of NbMCF support did not allow the observation of bands coming from charge and electron transfers in silver and platinum species because the band assigned to the charge transfer in penta-coordinated niobium species dominated (the band at 265 nm).43
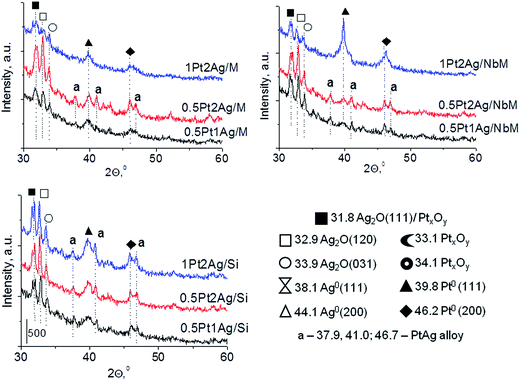 | ||
| Fig. 2 Comparison of XRD patterns of Pt–Ag bimetallic catalysts (calcined at 773 K) based on the same support, but with different metals loading. | ||
 | ||
| Fig. 3 UV-Vis DR spectra of the catalysts based on three different supports after calcination at 773 K. | ||
More information about the oxidation state of the catalyst components could be obtained from XPS study. As concerns silver species, XP spectra appeared to be complicated. The investigated region between 366 eV and 378 eV covers binding energies of Ag3d5/2 and Ag3d3/2 reported for Ag0, Ag2O and AgO.44–47 Cationic silver species are identifiable much more easily by their peak shape and width than by their absolute energy. Fig. S4-SD† presents the XP spectra of the samples with the highest metal loadings. They reveal the interaction of silver with niobium species located in the NbMCF support, whose presence is concluded from the shift of binding energies (BE) to higher values. The XP spectra of platinum Pt4f7/2 and Pt4f5/2 for the selected samples are shown in Fig. 4. The spectrum of the monometallic platinum sample presented the XPS bands characteristic of metallic and cationic (Pt2+) platinum species. In bimetallic samples metallic platinum was also detected but its binding energy was higher than that typical of monometallic platinum; the shift for Pt4f7/2: from 70.3 eV for monometallic 0.5Pt/M sample to 71.5 eV, 71.6 eV, and 71.3 eV for 0.5Pt2Ag/M, 0.5Pt2Ag/NbM, and 0.5Pt2AgSi, respectively. According to literature48–50 all these values are in the range typical of metallic platinum. However, the value of BE is an indicator of the binding strength which depends on the particle size51 and the type of surrounding.33,52 The higher BE in bimetallic samples indicates the stronger binding of platinum which occurs in Pt–Ag alloy. Interestingly, the bimetallic sample based on silica revealed in its XP spectrum only metallic platinum in the alloy, whereas for two other samples based on MCF and NbMCF additional cationic platinum (4+) was detected.
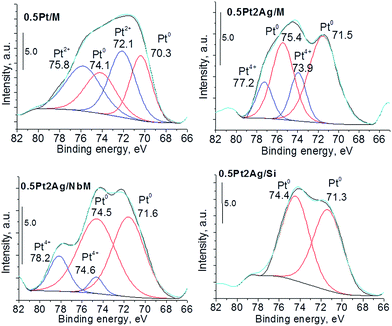 | ||
| Fig. 4 Pt4f XP spectra of monometallic and bimetallic selected samples (the samples after calcination in air at 773 K). | ||
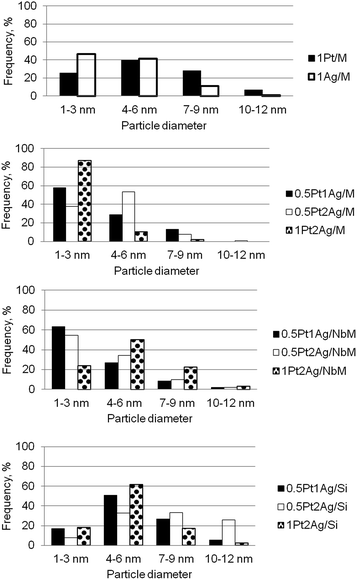
Metal particle sizes were calculated from TEM images (the examples of images are shown in Fig. S5-SD†). Of course, TEM images did not allow us to distinguish between single metallic and bimetallic particles, but they gave general overview concerning the sizes of metallic and bimetallic clusters. Fig. 5 shows the metal particle size distribution in the calcined monometallic and bimetallic samples. In monometallic materials loaded on MCF, silver dispersion was much better than platinum one for the similar metal loading (in 1Pt/M and 1Ag/M samples the greatest population of silver cluster sizes was in the range of 1–3 nm). Bimetallic samples reveal better dispersion of metallic clusters than monometallic samples. Particle size distribution depends on both, the nature of the support and the metal loading. On the basis of diagrams in Fig. 5 one can draw the information on the orders of population of the smallest (1–3 nm) metallic clusters depending on metal loading. The loading with 0.5Pt1Ag and 0.5Pt2Ag led to the following sequence of supports according to the population of the smallest clusters: NbMCF > MCF > SiO2; whereas for 1Pt2Ag samples the best dispersion was achieved on MCF support (MCF > NbMCF > SiO2). For all metal loadings the lowest dispersion was obtained on amorphous silica because this support favors agglomeration of metal particles. Thus, the structure of mesoporous cellular foams promoted dispersion of metals. The incorporation of niobium into MCF material enhanced the dispersion of metals because of the interaction between niobium and metals loaded which was documented by UV-Vis DRS and XPS results. The exception was the sample with the highest metal loading (1Pt2Ag/NbM) in which the dispersion of metals was much lower than that on the material without niobium, 1Pt2Ag/M. This phenomenon is caused by much lower window diameter (11.2 nm) in NbMCF support than in MCF (19.7 nm) as shown in Table 3. The lowering of window diameter caused difficulties in penetration of metals into the cells if the loading by silver and platinum was high. In this way the structure of NbMCF promoted the agglomeration of metals clusters under higher concentration of metals.
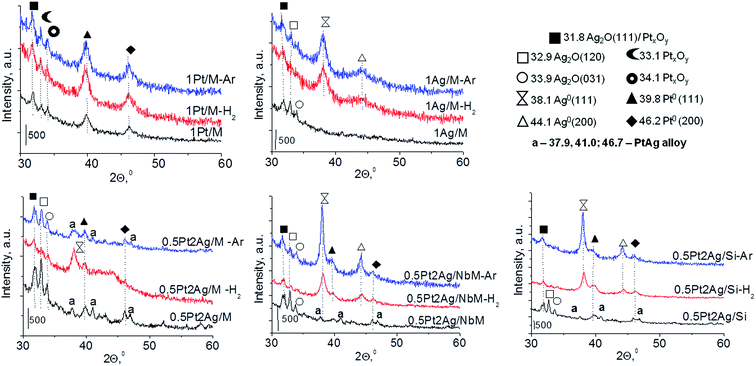 | ||
| Fig. 6 Comparison of XRD patterns of the selected samples after calcination at 773 K, activation at 673 K under hydrogen and argon flow. | ||
| Catalyst | Alloy particle size [nm] from XRD |
|---|---|
| 0.5Pt2Ag/M | 18.8 |
| 0.5Pt2Ag/M-Ar | 15.7 |
| 0.5Pt2Ag/NbM | 15.1 |
| 0.5Pt2Ag/Si | 17.3 |
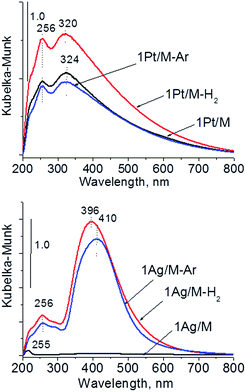 | ||
| Fig. 7 UV-Vis DR spectra of monometallic samples after calcination and activation under argon or hydrogen flow. | ||
The UV-Vis spectra of bimetallic samples based on MCF and NbMCF supports are shown in Fig. 8. In all spectra two parts can be distinguished, one at lower wavelengths (at ca. 260 nm) showing the bands from charge transfer in cationic silver, platinum or niobium species and the second region typical of SPR in metallic silver (at ca. 400 nm). Typically after activation in hydrogen flow a very intense band characteristic of metallic silver appeared, whereas this band was less pronounced after activation in argon flow. From all the UV-Vis spectra the one for 0.5Pt2Ag/M-Ar stands out. It does not reveal well-developed band characteristic of metallic silver, which is in agreement with the XRD pattern of this sample (Fig. 6) which showed the presence of peaks from Pt–Ag alloy and the absence of reflexes from metallic silver. The changes in the state of metal modifiers after thermal treatments under hydrogen or argon flow, which were evidenced by XRD and UV-Vis DRS study, should determine the activity and/or selectivity in catalytic processes.
3.3. Methanol oxidation
Taking into account the above described surface properties of bimetallic materials we chose the samples with the modifiers composition of 0.5Pt2Ag loaded on different supports and tested these materials in methanol oxidation performed after activation in argon or hydrogen flow in temperatures from 323 K to 523 K. The data characterizing the activity and selectivity of the selected materials in methanol oxidation are presented in Table S2-SD.† The main reaction products were methyl formate (MF – the product of selective oxidation) and carbon dioxide (CO2 – the product of total oxidation). The silica supports, both commercial and MCF, were inactive in the oxidation of methanol. Mesoporous cellular foam modified with niobium species showed negligible activity at higher temperatures (473 K and 523 K). The activity of monometallic silver catalyst loaded on MCF activated under argon or hydrogen flow appeared to be significant starting from 473 K (Table S2-SD†). The sample activated in argon flow revealed 89% of methanol conversion at 523 K and comparable selectivity to CO2 and MF, whereas the catalyst activated in hydrogen flow exhibited 97% of methanol conversion and selectivity mainly to CO2 (97%). The greater reduction of silver species by hydrogen treatment resulted in total oxidation of methanol. At lower reaction temperatures the monometallic silver catalyst showed negligible activity. The activity increased when bimetallic samples were used as catalysts. As Fig. 9 shows, the two samples, 0.5Pt2Ag/M-Ar and 0.5Pt2Ag/Si-Ar, activated in argon flow, showed the highest activity at 373 K (ca. 100% conversion of methanol). However, their selectivities were different. The main product obtained on 0.5Pt2Ag/M-Ar was MF (59% of selectivity), whereas on 0.5Pt2Ag/Si-Ar the selectivity to MF was lower (36%). The latter catalyst was active mainly in total oxidation because this material activated in argon flow contained the separated platinum and silver metallic phases. Metallic platinum is responsible for high activity of the catalysts in total oxidation as it was concluded from literature31,33,55–59 and the results obtained on 0.5Pt/M-Ar (Table S2-SD†). The selective formation of MF requires stronger chemisorption of formaldehyde (FA) formed in the first step of the methanol oxidation60–63 which allows the following interaction with oxygen to form formic acid. The latter one can be transformed to methyl formate if it interacts with the second methanol molecule. Pt–Ag alloy and cationic silver revealed such properties presenting medium strength of active centers for formaldehyde chemisorption. Too strong chemisorption of formaldehyde can lead to the oxidation to CO2. The presence of Pt–Ag alloy exclusively on 0.5Pt2Ag/M-Ar sample activated under argon flow before the reaction is the reason for the highest MF production over this catalyst. The selectivity to MF over this catalyst became higher (73%) at 423 K because of the lower strength of MF chemisorption at higher temperature allowing easier desorption of the chemisorbed MF. Interestingly, the presence of niobium in the support decreased the activity at a lower reaction temperature. It is caused by the changes in texture parameters described in the above sections and the interaction between niobium and silver species which influenced both, the alloy concentration diminishing during activation and the texture of metallic silver.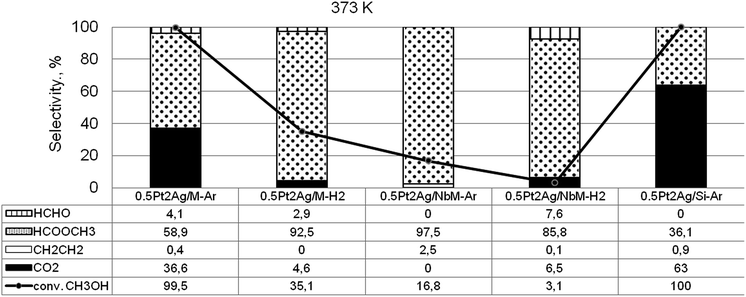 | ||
Fig. 9 Results of methanol oxidation (O2![[thin space (1/6-em)]](https://www.rsc.org/images/entities/char_2009.gif) : :![[thin space (1/6-em)]](https://www.rsc.org/images/entities/char_2009.gif) CH3OH = 2) – activity and selectivity for selected catalysts at 373 K. CH3OH = 2) – activity and selectivity for selected catalysts at 373 K. | ||
The interesting information coming from Fig. 9 and Table S2-SD† is the difference in the activity of the samples activated under argon flow and hydrogen flow. Hydrogen caused the higher reduction of cationic silver to metallic one and disappearance of Pt–Ag alloy, which resulted in the decrease of the catalyst activity in methanol oxidation.
The above described results concerning the metals states after activation under argon or hydrogen flow, imply that silver and platinum species on the surface of supports used were not stable upon activation. The question arises whether the new metallic species formed after activation are stable under the reaction conditions where oxygen is a reactant which can oxidize the metallic species, and formaldehyde (an intermediate product) can be a reducer of cationic species. The comparison of XRD patterns of the materials after activation and after the reaction of methanol oxidation clearly indicates that the active metal species are not changed considerably during the reaction (Fig. S8-SD†).
4. Conclusions
The composition of Pt–Ag mixture plays a crucial role in the formation of bimetallic alloy on the mesoporous cellular foams and amorphous silica. The excess of silver is necessary for this purpose. It was proved in this paper that Pt–Ag alloy is formed if the Ag/Pt molar ratio achieves a value of 2.5 or higher. The structure and composition of the silica support is less important for the formation of Pt–Ag alloy but it is crucial for its stability under activation conditions. It was documented that silica mesoporous cellular foam (MCF) used as the support allowed to preserve Pt–Ag alloy after activation under argon flow. The presence of bimetallic alloy in this catalysts resulted in a high activity and the highest selectivity to methyl formate in the low temperature (373 K and 423 K) oxidation of methanol. The active phases formed after activation in argon or hydrogen flow were stable under the reaction conditions. The presence of niobium in the NbMCF support gave rise to the niobium–silver interaction leading to a decrease in the activity in methanol oxidation in spite of higher metal dispersion. The activation of bimetallic samples in argon or hydrogen flow caused partial segregation of platinum and silver present in Pt–Ag alloy. This effect was more pronounced after activation in hydrogen flow caused partial segregation of platinum and silver present in Pt–Ag alloy. This effect was more pronounced after activation in hydrogen.Acknowledgements
National Science Centre in Poland (Grants No. 2015/19/N/ST5/00501 and 2014/15/B/ST5/00167) are acknowledged for the financial support of this work.References
- V. Dal Santo, A. Gallo, A. Naldoni, M. Guidotti and R. Psaro, Catal. Today, 2012, 197, 190–205 CrossRef CAS.
- A. Wang, X. Liu, C. Mou and T. Zhang, J. Catal., 2013, 308, 258–271 CrossRef CAS.
- L. Guczi, J. Mol. Catal., 1984, 25, 13–29 CrossRef CAS.
- W. M. H. Sachtler, in Handbook of Heterogeneous Catalysis, 2008, pp. 313–320 Search PubMed.
- Z. Zhang, Z. Jiang and W. Shangguan, Catal. Today, 2016, 264, 270–278 CrossRef CAS.
- A. U. Nilekar, Y. Xu, J. Zhang, M. B. Vukmirovic, K. Sasaki, R. R. Adzic and M. Mavrikakis, Top. Catal., 2007, 276–284 CrossRef CAS.
- T. Moriya, J. Kugai, S. Seino, Y. Ohkubo, T. Nakagawa, H. Nitani and T. A. Yamamoto, J. Nanopart. Res., 2013, 15, 1–8 CrossRef.
- R. P. Doherty, J.-M. Krafft, C. Méthivier, S. Casale, H. Remita, C. Louis and C. Thomas, J. Catal., 2012, 287, 102–113 CrossRef CAS.
- P. J. Van den Hoek, E. J. Baerends and R. a. Van Santen, J. Phys. Chem., 1989, 93, 6469–6475 CrossRef CAS.
- E. Cao, S. Firth, P. F. McMillan and A. Gavriilidis, Catal. Today, 2007, 126, 119–126 CrossRef CAS.
- D. Chen, Z. Qu, S. Shen, X. Li, Y. Shi, Y. Wang, Q. Fu and J. Wu, Catal. Today, 2011, 175, 338–345 CrossRef CAS.
- V. V. Dutov, G. V. Mamontov, V. I. Zaikovskii and O. V. Vodyankina, Catal. Today, 2015, 278, 150–156 CrossRef.
- A. Q. Wang, C. M. Chang and C. Y. Mou, J. Phys. Chem. B, 2005, 109, 18860–18867 CrossRef CAS PubMed.
- W. P. Zeng, J. Tang, P. Wang and Y. Pei, RSC Adv., 2016, 6, 55867–55877 RSC.
- T. Benkó, A. Beck, K. Frey, D. F. Srankó, O. Geszti, G. Sáfrán, B. Maróti and Z. Schay, Appl. Catal., A, 2014, 479, 103–111 CrossRef.
- I. Sobczak and E. Dembowiak, J. Mol. Catal. A: Chem., 2015, 409, 137–148 CrossRef CAS.
- K. Kim, K. L. Kim and K. S. Shin, Analyzer, 2011, 23374–23380 CAS.
- Z. Peng, H. You and H. Yang, Adv. Funct. Mater., 2010, 20, 3734–3741 CrossRef CAS.
- J. B. Xu, T. S. Zhao and Z. X. Liang, J. Phys. Chem. C, 2008, 17362–17367 CAS.
- G.-T. Fu, R.-G. Ma, X.-Q. Gao, Y. Chen, Y.-W. Tang, T.-H. Lu and J.-M. Lee, Nanoscale, 2014, 6, 12310–12314 RSC.
- W. He, X. Wu, J. Liu, X. Hu, K. Zhang, S. Hou, W. Zhou and S. Xie, Chem. Mater., 2010, 22, 2988–2994 CrossRef CAS.
- B. J. Hwang, S. Murugesan, S. Kumar, C. Chen, R. Chang, D. Liu and J. Lee, J. Phys. Chem. C, 2008, 2370–2377 CAS.
- S. Y. Hwang, C. Zhang, E. Yurchekfrodl and Z. Peng, J. Phys. Chem. C, 2014, 118, 28739–28745 CAS.
- C. M. Doudna, M. F. Bertino, F. D. Blum, A. T. Tokuhiro, D. Lahiri-Dey, S. Chattopadhyay and J. Terry, J. Phys. Chem. B, 2003, 107, 2966–2970 CrossRef CAS.
- C. Guo and J. Hu, Appl. Phys. A, 2014, 809–813 CrossRef CAS.
- M. M. Jeff Greeley and J. K. Norskov, Annu. Rev. Phys. Chem., 1999, 50, 79–115 CrossRef PubMed.
- U. B. Demirci, J. Power Sources, 2007, 173, 11–18 CrossRef CAS.
- L. Feng, G. Gao, P. Huang, X. Wang, C. Zhang, J. Zhang, S. Guo and D. Cui, Nanoscale Res. Lett., 2011, 6, 551 CrossRef PubMed.
- V. V. Pryadchenko, V. V. Srabionyan, E. B. Mikheykina, L. A. Avakyan, V. Y. Murzin, Y. V. Zubavichus, I. Zizak, V. E. Guterman and L. A. Bugaev, J. Phys. Chem. C, 2015, 119, 3217–3227 CAS.
- J. J. Lv, J. X. Feng, S. S. Li, Y. Y. Wang, A. J. Wang, Q. L. Zhang, J. R. Chen and J. J. Feng, Electrochim. Acta, 2014, 133, 407–413 CrossRef CAS.
- J. Wisniewska, M. Ziolek, N. Artioli and M. Daturi, J. Catal., 2016, 336, 58–75 CrossRef CAS.
- P. Schmidt-Winkel, W. W. Lukens, D. Zhao, P. Yang, B. F. Chmelka and G. D. Stucky, J. Am. Chem. Soc., 1999, 121, 254–255 CrossRef CAS.
- J. Czaplinska, P. Decyk and M. Ziolek, Appl. Catal., A, 2015, 504, 361–372 CrossRef CAS.
- K. Stawicka, M. Trejda and M. Ziolek, Appl. Catal., A, 2013, 467, 325–334 CrossRef CAS.
- G. Valverde-Aguilar, J. a. García-Macedo and V. Rentería-Tapia, J. Nano Res., 2008, 3, 103–114 CrossRef CAS.
- X. Chen, J. Chen, Y. Zhao, M. Chen and H. Wan, Chin. J. Catal., 2012, 33, 1901–1905 CrossRef CAS.
- X. Huang, M. Yang, G. Wang and X. Zhang, Microporous Mesoporous Mater., 2011, 144, 171–175 CrossRef CAS.
- C. H. Jung, J. Yun, K. Qadir, B. Naik, J. Y. Yun and J. Y. Park, Appl. Catal., B, 2014, 154–155, 171–176 CrossRef CAS.
- M. L. Wu and L. B. Lai, Colloids Surf., A, 2004, 244, 149–157 CrossRef CAS.
- Y. Borodko, C. M. Thompson, W. Huang, H. B. Yildiz, H. Frei and G. A. Somorjai, J. Phys. Chem. C, 2011, 115, 4757–4767 CAS.
- P. M. More, D. L. Nguyen, M. K. Dongare, S. B. Umbarkar, N. Nuns, J. S. Girardon, C. Dujardin, C. Lancelot, A. S. Mamede and P. Granger, Appl. Catal., B, 2015, 162, 11–20 CrossRef CAS.
- J. Gao, X. Ren, D. Chen, F. Tang and J. Ren, Scr. Mater., 2007, 57, 687–690 CrossRef CAS.
- D. C. Tranca, A. Wojtaszek-Gurdak, M. Ziolek and F. Tielens, Phys. Chem. Chem. Phys., 2015, 17, 22402–22411 RSC.
- A. M. Ferraria, A. P. Carapeto and A. M. Botelho Do Rego, Vacuum, 2012, 86, 1988–1991 CrossRef CAS.
- V. K. Kaushik, J. Electron Spectrosc. Relat. Phenom., 1991, 56, 273–277 CrossRef CAS.
- G. B. Hoflund and Z. F. Hazos, Phys. Rev. B: Condens. Matter Mater. Phys., 2000, 62, 126–133 CrossRef.
- X. Bao, M. Muhler, T. Schedel-Niedrig and R. Schlögl, Phys. Rev. B: Condens. Matter Mater. Phys., 1996, 54, 2249–2262 CrossRef CAS.
- V. La Parola, M. Kantcheva, M. Milanova and A. M. Venezia, J. Catal., 2013, 298, 170–178 CrossRef CAS.
- J. Cai, Y. Huang, B. Huang, S. Zheng and Y. Guo, Int. J. Hydrogen Energy, 2014, 39, 798–807 CrossRef CAS.
- X. Li, W. Zheng, H. Pan, Y. Yu, L. Chen and P. Wu, J. Catal., 2013, 300, 9–19 CrossRef CAS.
- A. Masson, B. Bellamy, Y. H. Romdhane, M. Che, H. Roulet and G. Dufour, Surf. Sci., 1986, 173, 479–497 CrossRef CAS.
- M. Chatterjee, T. Iwasaki, Y. Onodera and T. Nagase, Catal. Lett., 1999, 61, 199–202 CrossRef CAS.
- A. Ruban, H. Skriver and J. Nørskov, Phys. Rev. B: Condens. Matter Mater. Phys., 1999, 59, 15990–16000 CrossRef.
- A. Monshi, World J. Nano Sci. Eng., 2012, 2, 154–160 CrossRef.
- J. Zhu, T. Wang, X. Xu, P. Xiao and J. Li, Appl. Catal., B, 2013, 130–131, 197–217 CrossRef CAS.
- L. Usón, M. G. Colmenares, J. L. Hueso, V. Sebastián, F. Balas, M. Arruebo and J. Santamaría, Catal. Today, 2014, 227, 179–186 CrossRef.
- Y. J. Mergler, A. Van Aalst, J. Van Delft and B. E. Nieuwenhuys, Appl. Catal., B, 1996, 10, 245–261 CrossRef CAS.
- A. Tsuji, K. T. V. Rao, S. Nishimura, A. Takagaki and K. Ebitani, ChemSusChem, 2011, 4, 542–548 CrossRef CAS PubMed.
- A. Fukuoka, J. Kimura, T. Oshio and Y. Sakamoto, J. Am. Chem. Soc., 2007, 10120–10125 CrossRef CAS PubMed.
- J. M. Tatibougt, Appl. Catal., A, 1997, 148, 213–252 CrossRef.
- G. Busca, Catal. Today, 1996, 27, 457–496 CrossRef CAS.
- L. E. Briand, W. E. Farneth and I. E. Wachs, Catal. Today, 2000, 62, 219–229 CrossRef CAS.
- J. Florek-Milewska, P. Decyk and M. Ziolek, Appl. Catal., A, 2011, 393, 215–224 CrossRef CAS.
Footnote |
| † Electronic supplementary information (ESI) available. See DOI: 10.1039/c6ra28365a |
| This journal is © The Royal Society of Chemistry 2017 |

