 Open Access Article
Thermal responses of a gas hydrate-bearing sediment to a depressurization operation
K. Yamamoto*a,
T. Kanno†
a,
X.-X. Wangb,
M. Tamakia,
T. Fujiia,
S.-S. Cheeb,
X.-W. Wang c,
V. Pimenovd and
V. Shakod
aJapan Oil, Gas and Metals National Corporation, 1-2-2 Hamada Mihama-ku, Chiba-shi, Chiba 261-0025, Japan. E-mail: yamamoto-koji@jogmec.go.jp
bSchlumberger K. K., Kanagawa, Sagamihara, Japan
cBaker Hughes Inc., Houston, TX, USA
dSchlumberger Moscow Research Centre, Moscow, Russia
First published on 17th January 2017
Abstract
As a part of a research program aiming to mobilize marine gas hydrate deposits as an energy resource, the worlds' first gas production attempt was performed in early 2013 in the Daini Atsumi Knoll, Eastern Nankai Trough, off Honshu Island, Japan. The test concluded with 119![[thin space (1/6-em)]](https://www.rsc.org/images/entities/char_2009.gif) 000 m3 (under ambient conditions) of methane gas production during six consecutive days of depressurization operation through a borehole drilled at 1000 m water depth. As thermal and mass transportation in a heterogeneous geological formation are the governing factors of efficiency and effectiveness of the resource, the test was associated with intensive underground temperature monitoring. Temperature sensors installed in one production and two observation boreholes could detect temperature variations during gas production due to the endothermic gas hydrate dissociation process and mass/heat transport around the boreholes. The measurements in the observation holes started one year before the test and continued until plug-and-abandonment, and thus enabled monitoring of both the initial temperature and temperature change arizing from recovery processes. The depth profiles of measured temperatures in all holes can be related to the geological features of the corresponding formation, and those thermal responses revealed the intervals where gas hydrate dissociation predominantly occurred. By analyzing the energy conservation in the production borehole, the gas and water production profiles could be estimated and major gas and water production zones were identified. Preliminary numerical analysis results show the range of formation permeability and that the observed temperature drop is equivalent to the heat consumption by hydrate dissociation for the volume of produced methane gas. Moreover, the thermal responses could provide some clues about the location and mechanism of the sand production event. This sand production event ultimately terminated the production operations on the seventh day of flow.
000 m3 (under ambient conditions) of methane gas production during six consecutive days of depressurization operation through a borehole drilled at 1000 m water depth. As thermal and mass transportation in a heterogeneous geological formation are the governing factors of efficiency and effectiveness of the resource, the test was associated with intensive underground temperature monitoring. Temperature sensors installed in one production and two observation boreholes could detect temperature variations during gas production due to the endothermic gas hydrate dissociation process and mass/heat transport around the boreholes. The measurements in the observation holes started one year before the test and continued until plug-and-abandonment, and thus enabled monitoring of both the initial temperature and temperature change arizing from recovery processes. The depth profiles of measured temperatures in all holes can be related to the geological features of the corresponding formation, and those thermal responses revealed the intervals where gas hydrate dissociation predominantly occurred. By analyzing the energy conservation in the production borehole, the gas and water production profiles could be estimated and major gas and water production zones were identified. Preliminary numerical analysis results show the range of formation permeability and that the observed temperature drop is equivalent to the heat consumption by hydrate dissociation for the volume of produced methane gas. Moreover, the thermal responses could provide some clues about the location and mechanism of the sand production event. This sand production event ultimately terminated the production operations on the seventh day of flow.
Introduction
Naturally occurring clathrate hydrates of hydrocarbon gases, which are also called methane hydrate or MH because the dominant guest molecules are methane, have attracted the interest of scientists, engineers, and industry because of their influence on global climate change,1,2 as a possible cause of massive subsea mass movement,3 as a candidate for drilling geo-hazards in deep boreholes,4 and as future alternative resources to conventional oil and gas.5,6 Due to them being stable under high pressure and low-temperature conditions,7 they have been found in sub-permafrost zones of arctic areas and in deep-water settings.8In a recent estimate, the gas-in-place volume in hydrate-bearing sand (methane hydrate deposits in sandy sediments, which are believed to be the most promising type of occurrence as a resource9) is 1.226 × 10¹⁵ m3 (43![[thin space (1/6-em)]](https://www.rsc.org/images/entities/char_2009.gif) 311 trillion cubic feet), which includes of the amounts in well-documented resource fields such as the Gulf of Mexico (190.2 × 10¹² m3),10 the Alaskan North Slope (technically recoverable, 2.42 × 10¹² m3),11 and the Eastern Nankai Trough (1.13 × 10¹² m3).12
311 trillion cubic feet), which includes of the amounts in well-documented resource fields such as the Gulf of Mexico (190.2 × 10¹² m3),10 the Alaskan North Slope (technically recoverable, 2.42 × 10¹² m3),11 and the Eastern Nankai Trough (1.13 × 10¹² m3).12
Due to the thermodynamic and hydro dynamic nature of methane hydrates, in which they exist in the pore space of granular sedimentary material and have relatively large latent heat capacity (436.8 kJ kg−1), dissociation/association processes of methane hydrates in geological settings are governed by heat and fluid transport in porous media7,13 with either natural or artificial causes. The endothermic nature of methane hydrate dissociation inhibits drastic changes of state (solid to fluid) and causes difficulty in recovering fuel gas from solid matter. Therefore, the knowledge of thermodynamic and hydraulic characteristics and processes in geo-materials is quite important for both scientific and engineering purposes to understand and predict hydrate-related phenomena.
Under the initiative and funding of the Japanese Ministry of Economy, Trade and Industry (METI), the Research Consortium for methane hydrate resources in Japan (MH21) formed by Japan Oil, Gas and Metals National Corporation (JOGMEC) and National Institute of Advanced Industrial Science and Technology (AIST) has performed integrated studies of exploration and development of gas-production technologies since 2001.14 To bring the methane hydrate from a “prospective” to a “contingent” state as an unconventional petroleum resource,15 laboratory and numerical studies and field verification of gas-producing techniques have been a key components of the program.
One possible technique to recover fuel gas from hydrate deposits underneath the seafloor is the depressurization method,16–22 in which the pore pressure in a gas hydrate-bearing sediment is forcibly reduced below the hydrate stability pressure by pumping water through a drilled borehole. The method can be regarded as “primary recovery” of gas from a gas hydrate reservoir because it does not require any thermal energy input, and a high energy return on investment is expected if the method is valid in nature. Therefore, MH21 has focused on verification of the validity of this method for future commercialization of this type of resource.14,22,23
The effectiveness of this technique in a real gas hydrate reservoir, however, depends on how rapidly the state of hydrate instability is established and is maintained stable. Two factors govern the phase shift process. First, depressurized conditions should be established in a certain domain around the borehole by moving water and gas to the borehole, but excessive water inflow from the surrounding area may make continuous depressurization difficult. The distribution of the absolute permeability which is intrinsic permeability of the sediment without hydrate, as well as the initial effective permeability with hydrates in pore spaces are key parameters of the hydraulic process.
The second factor is thermal processes. The method can be sustainable if sufficient natural heat is continuously supplied. Sensible heat of formation, which is defined as the difference between the equilibrium temperature under depressurized conditions and the original temperature, can act as a heat source.
For the case wherein the sediment porosity φ = 40% and hydrate saturation (volume fraction of hydrate in pore space) Sh = 70%, the difference between phase equilibrium temperature after depressurization and the original in situ temperature is 11 K. If typical density and heat capacity values of quartz are applied, the sensible heat of the hydrate can supply only 5% of the dissociation heat (21 kJ kg−1 out of 436.8 kJ kg−1 of necessary heat), but the heat supply from the sediment grains and pore fluid can dissociate 33% of the hydrate in the pore space.24 Moreover, heat transport from surrounding formations through conduction and advection provides an additional heat supply process.
The depressurization method was first tested in nature as a small-scale trial during the JAPEX/GCS/JNOC Mallik 5L-38 research well program (2002) in the Northwest Territories, Canada25–28 and was tried29,30 and proved31–33 in the full-scale production test of the Aurora/JOGMEC/NRCan Mallik 2L-38 program (2007–2008).
After the success of the Mallik 2L-38 program, MH21 decided to conduct the world's first offshore gas-production attempt34 in a marine gas hydrate deposit in the Eastern Nankai Trough off Japan. The test was performed in March 2013 together with intensive data acquisition, sampling, and monitoring. In this program, temperature measurement was a core activity.35–37
Downhole temperature measurement is one possible way to determine the extent of the hydrate dissociation region. This type of measurement has been conducted during past exploration and intentional in situ gas hydrate dissociation trials such as the Mallik 5L-38 thermal stimulation test (2002),38,39 the METI Tokai-oki to Kumano-nada exploratory drilling campaign,40–42 the Mallik 2L-38 depressurization test (2007–2008),43,44 and the Ignik Sikumi CH4–CO2 exchange and depressurization test (2012).45 Temperature data in the gas-production hole have been obtained in previous projects,39,45 but temperature drop detection in vicinity of the production hole using observation boreholes has not been successful.
In the following sections, an outline of the production test associated with the temperature-monitoring programs, the data obtained, and the results of the preliminary analyses and their interpretations is introduced.
Geological setting and production test operation
Geological setting and drilled boreholes
The site of the 2013 production test is situated in the north slope of Daini Atsumi Knoll, an outer ridge of a forearc basin off the Kii and Atsumi peninsulas of the Pacific coast of Honshu island, Japan (Fig. 1).46 In the area around the test site, the Eastern Nankai Trough, an intensive drilling campaign (METI Tokai-oki to Kumano-nada) including logging-while-drilling (LWD), wireline geophysical logging, and pressure core recovery40,41 were conducted after 2D and 3D seismic surveys (2000–2001), with subsequent experimental hole drilling for well completion and horizontal drilling trial.47 By integrating information from those surveys, thick highly concentrated methane hydrate deposits were identified in the sandy layers of Pleistocene turbiditic sediments48–51 in some locations.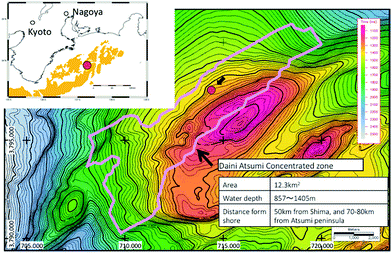 | ||
| Fig. 1 Location map of the test site (northern flank of the Daini Atsumi Knoll) with a bathymetry map and the extent of the methane hydrate concentration zone (indicated by the pink solid line). | ||
In the Daini Atsumi Knoll, the zone with highly hydrate-saturated sandy layers, which is also called the methane hydrate concentrated zone (MHCZ) was identified with a thickness of 50–70 m at around 300 m below seafloor (mBSF) in a water depth of approximately 1000 m.52
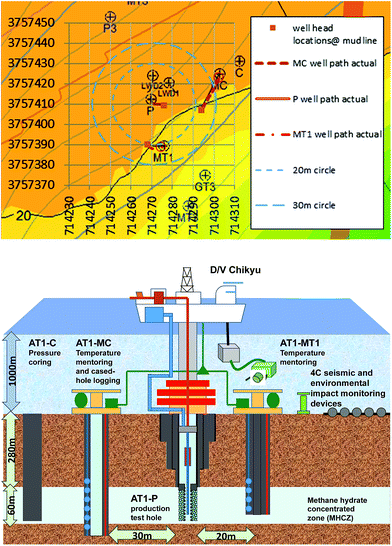
After the decision on the first offshore production test, three boreholes for the test were drilled in early 2012 (ref. 53) using the deep-water scientific drilling vessel D/V Chikyu that was constructed for the integrated ocean drilling program (IODP). This operation was part of the first year of the two-year program and involved an intensive logging program and installation of temperature-monitoring devices. Two monitoring boreholes, AT1-MC and AT1-MT1, and the shallow section of the production borehole (AT1-P) were drilled with geophysical logging operations to obtain the formation property data. Another borehole dedicated to the pressure coring54,55 (AT1-C) was drilled a few months later. The hole locations and their trajectories projected in the horizontal section are shown in Fig. 2. Due to well trajectory deviation, the locations of the holes at reservoir depth (∼280 mBSF) are different from those at the seafloor. The offsets of the AT1-MC and AT-MT1 holes from AT1-P at the reservoir depth are 34 and 22 m, respectively.
Geophysical logging data, particularly the resistivity image tool that provides high-resolution wellbore images, were useful to identify the geometry and lithology of each thin layer. Highly hydrate-saturated sand is identified as a high resistivity zone, and low resistivity corresponds to silt zone or water bearing sand.
The geophysical log-derived data were supported by core sample information and seismic data, which can provide detailed information on the geological features of turbiditic sediments52,56–58 and their physical properties.59–64 Overall, the MHCZ and overburden are divided into four units. The top zone (Unit I) is relatively uniform and clayey slump deposit. Below Unit I, thin layers of turbidite sequences with alternations of sandy and silty layers start around 80–100 mBSF. In the next unit (Unit II), hydrates occur in sandy layers, but their saturation is not sufficiently high to be regarded as an attractive energy resource.
Fig. 3 illustrates the detailed resistivity images obtained in the reservoir and adjacent sections of the three boreholes. In the figure, red color indicates the highly electrically resistive methane hydrate zones. The target MHCZ zone (Unit IV) lies below a 25 m-thick silt-dominated zone (Unit III) and is divided into three major subzones.
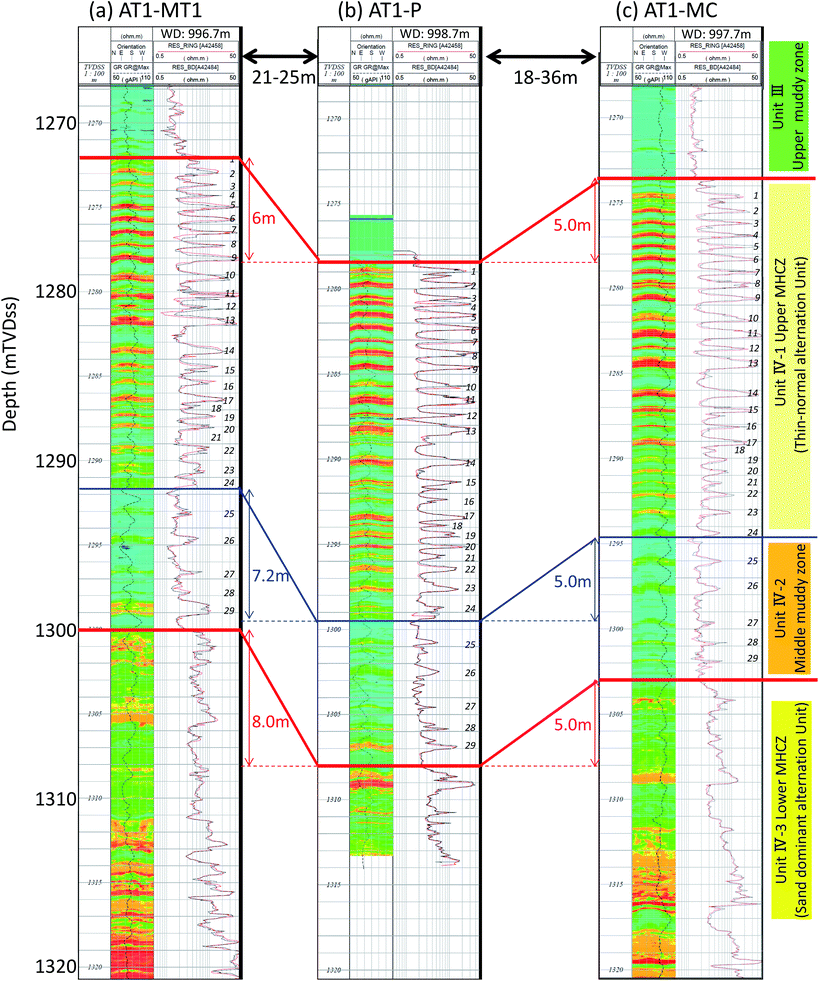 | ||
| Fig. 3 LWD resistivity image log of each borehole. High resistivity zones that may be highly methane hydrate-saturated sandy layers are depicted in red. The images show that horizontal continuity of each layer is quite good, and therefore the corresponding zones can be identified between wells (after Fujii et al., 2015).52,56 | ||
Unit III is expected to be a pressure seal between the depressurized zone and the overlying water-bearing zone and is suitable for the casing shoe of the well because of the mechanically sound nature of the sediment.
The upper zone of Unit IV (subunit IV-1) comprise numerous thin turbidite sequences of sand-silt alternations (the typical thickness of each layer is some tens of centimeters). In this zone, sandy layers are composed of fine to very fine sand (mean particle size dmean ∼ 150 μm) with high hydrate saturation Sh (max. Sh = 80%).
Subunit IV-2 also contains alternations of silt and sand, but with a greater dominance of silt, lower Sh, and each layer is thicker than those of subunit IV-1. Subunit IV-3 consists thicker (1 m or more) channel turbidities in which features of the Bouma sequence are clearly visible.57–59
Between the three boreholes, the lateral continuity of lithology is quite good and correspondences between wells can be clearly defined. Due to the steep formation dip (dip direction = NW, dip angle ∼ 20°), the level of each unit is different, but the thicknesses of each unit are almost identical. Table 1 describes well and sediment geometry including the depths of the tops of each unit and the relative and absolute positions of the holes.
| a MSL below mean sea level, BSF: below sea floor, BTMHCZ: below top of methane hydrate concentrated zone. | |||
|---|---|---|---|
| AT1-P (producer hole) | |||
| Well location | Northing | Easting | |
| Coordinates | 33° 56.1212N | 137° 19.0992E | |
| Easting | Northing | ||
| UTM53 (mudline) | 714![[thin space (1/6-em)]](https://www.rsc.org/images/entities/char_2009.gif) 276.08 276.08 |
3![[thin space (1/6-em)]](https://www.rsc.org/images/entities/char_2009.gif) 757 757![[thin space (1/6-em)]](https://www.rsc.org/images/entities/char_2009.gif) 408.99 408.99 |
|
| UTM53 (reservoir) | 714![[thin space (1/6-em)]](https://www.rsc.org/images/entities/char_2009.gif) 271.14 271.14 |
3![[thin space (1/6-em)]](https://www.rsc.org/images/entities/char_2009.gif) 757 757![[thin space (1/6-em)]](https://www.rsc.org/images/entities/char_2009.gif) 410.11 410.11 |
|
| mMSL | mBSF | mBTMHCZ | |
| Water depth | 998.70 | 0.00 | |
| Top Unit III | 1254.71 | 256.01 | −23.21 |
| Top Unit IV-1 (TMHCZ) | 1277.92 | 279.22 | 0.00 |
| Top Unit IV-2 | 1296.78 | 298.08 | 18.86 |
| Top Unit IV-3 | 1308.19 | 309.49 | 30.27 |
| Bottom of MHCZ | — | — | — |
| Bottom of hole | 1316.70 | 318.00 | 38.78 |
![[thin space (1/6-em)]](https://www.rsc.org/images/entities/char_2009.gif) |
|||
| AT1-MT1 (monitoring hole #1) | |||
| Well location | |||
| Coordinates | 33° 56.1109′N | 137° 19.0937E | |
| Easting | Northing | ||
| UTM53 (mudline) | 714![[thin space (1/6-em)]](https://www.rsc.org/images/entities/char_2009.gif) 268.03 268.03 |
3![[thin space (1/6-em)]](https://www.rsc.org/images/entities/char_2009.gif) 757 757![[thin space (1/6-em)]](https://www.rsc.org/images/entities/char_2009.gif) 389.76 389.76 |
|
| UTM53 (reservoir) | 714![[thin space (1/6-em)]](https://www.rsc.org/images/entities/char_2009.gif) 274.55 274.55 |
3![[thin space (1/6-em)]](https://www.rsc.org/images/entities/char_2009.gif) 757 757![[thin space (1/6-em)]](https://www.rsc.org/images/entities/char_2009.gif) 388.70 388.70 |
|
| Offset@mudline (x,y,dist.) | −8.04 | −19.23 | 20.84 |
| Offset@reservoir (x,y,dist.) | 3.41 | −21.41 | 21.68 |
| mMSL | mBSF | mBTMHCZ | |
| Water depth | 996.70 | 0.00 | |
| Top Unit III | 1247.86 | 251.16 | −23.18 |
| Top Unit IV-1 (TMHCZ) | 1271.04 | 274.34 | 0.00 |
| Top Unit IV-2 | 1289.70 | 293.00 | 18.66 |
| Top Unit IV-3 | 1300.01 | 303.31 | 28.97 |
| Bottom of MHCZ | — | — | — |
| Bottom of hole | 1325.70 | 329.00 | 54.66 |
![[thin space (1/6-em)]](https://www.rsc.org/images/entities/char_2009.gif) |
|||
| AT1-MC (monitoring hole #2) | |||
| Well location | Northing | Easting | |
| Coordinates | 33° 56.1212N | 137° 19.0992E | |
| Easting | Northing | ||
| UTM53 (mudline) | 714![[thin space (1/6-em)]](https://www.rsc.org/images/entities/char_2009.gif) 276.08 276.08 |
3![[thin space (1/6-em)]](https://www.rsc.org/images/entities/char_2009.gif) 757 757![[thin space (1/6-em)]](https://www.rsc.org/images/entities/char_2009.gif) 408.99 408.99 |
|
| UTM53 (reservoir) | 714![[thin space (1/6-em)]](https://www.rsc.org/images/entities/char_2009.gif) 271.14 271.14 |
3![[thin space (1/6-em)]](https://www.rsc.org/images/entities/char_2009.gif) 757 757![[thin space (1/6-em)]](https://www.rsc.org/images/entities/char_2009.gif) 410.11 410.11 |
|
| Offset@mudline (x,y,dist.) | 18.08 | −2.00 | 18.19 |
| Offset@reservoir (x,y,dist.) | 31.46 | 12.75 | 33.95 |
| mMSL | mBSF | mBTMHCZ | |
| Water depth | 997.70 | 0.00 | |
| Top Unit III | 1250.38 | 252.68 | −23.47 |
| Top Unit IV-1 (TMHCZ) | 1273.85 | 276.15 | 0.00 |
| Top Unit IV-2 | 1292.73 | 295.03 | 18.88 |
| Top Unit IV-3 | 1303.54 | 305.84 | 29.69 |
| Bottom of MHCZ | 1335.55 | 337.85 | 61.70 |
| Bottom of hole | 1375.70 | 378.00 | 101.85 |
In the following sections, the depths of formations in the three boreholes are described by the distance below the top of methane hydrate concentrated zone (BTMHCZ). In this manner, the section occupied by each sub-unit is commonly given for each hole as follows:
Unit IV-1: 0–19 mBTMHCZ (meters below the top of methane hydrate concentrated zone).
Unit IV-2: 19–30 mBTMHCZ.
Unit IV-3: 30–61 mBTMHCZ.
Bottom of production well AT1-P: 38 mBTMHCZ.
Quantification of properties and physical conditions
The vertical profiles of the petro-physical parameters of the methane hydrate-bearing formations were evaluated from geophysical log data with correction from core derived data.The volume fraction of hydrate in pore spaces or hydrate saturation Sh, was estimated using the procedure to define fraction of electrically low conductivity hydrocarbons in pore space, Archie's equation,65
 | (1) |
As another way to derive permeability, a nuclear magnetic resonance tool that could give a different category of “porosity” (NMR porosity φNMR) was used. In this project, a pulse-generated neutron tool (EcoScope‡) was used to evaluate the neutron porosity φn, which is basically the count of hydrogen atoms or water molecules and the density, which is measured by number of electrons obtained using secondary gamma ray. These values can yield the volume of water or water-rich hydrate in a unit volume of sediment. On the other hand, φNMR is the quantity of movable water in a unit space because hydrogen atoms in solid state or bounded water show different excitation/relaxation behaviors against a magnetic field. The difference between porosities obtained using the density or neutron tool and NMR can be regarded as quantity of solid-state methane hydrate. This method is called as density-magnetic resonance (DMR) method,52,56,66–68 and formulated as follows;
 | (2) |
Other petro-physical parameters such as hydraulic parameters (intrinsic permeability of sediment and effective gas/liquid permeabilities), mechanical parameters (elasticity and strength), thermal parameters (specific heat and heat conductivity), and lithology were indirectly evaluated by geophysical log data, and verified or tuned using core-derived direct measurements.52,61–64,69
Of the parameters, the hydraulic parameters are particularly important for prediction of gas production, but are difficult to obtain by direct measurement. Previously obtained values from different methods (NMR-based geophysical logging,52 pressure coring,61,62 and a formation dynamics tester tool; pressure express or XPT‡)52 show a wide range such as from 0 to 100 mD (D: Darcy = 10−12 m2) in Unit IV-1: this is discussed later using the obtained temperature data.
The pore pressure of the formation was measured using a formation dynamics tester tool (XPT)52 during the wireline logging operation, and temperature information was obtained by long-term measurement using sensors deployed in the monitoring holes.70
Fig. 4 shows the log-derived porosity and hydrate saturation with temperature and pressure, together with the lithology of each layer identified from a combination of log and core data.
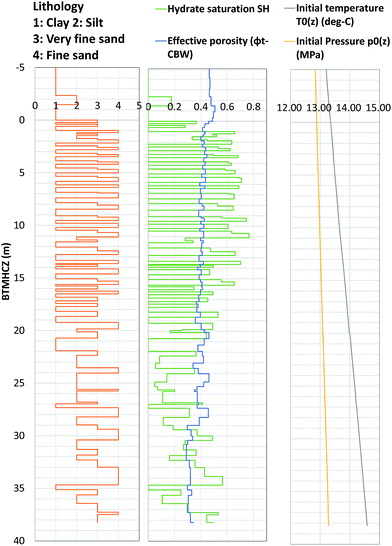 | ||
| Fig. 4 Modeled formation pressure and temperature conditions, formation properties (effective porosity and hydrate saturation) and initial formation pressure and temperature. | ||
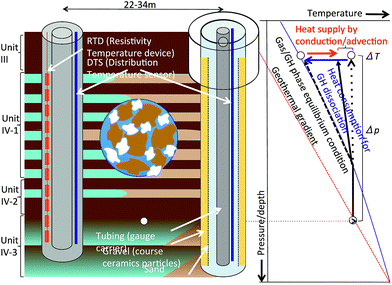
Fig. 5 shows a conceptual diagram of depressurization and temperature measurement. A pump operating in the production hole displaces water in the hole to the surface, thus lowering the liquid level, and creating depressurized conditions in the hole; subsequently, the formation pressure starts to drop. The rate of pore pressure change depends on the distance from the production hole and the initial permeability (the permeability of the sediment in the original hydrate state conditions). Effective permeabilities (the permeability values of the gas and liquid phases) are functions of the gas, liquid, and hydrate fractions in the pore, with the intrinsic (absolute) permeability of the sediment, and gradually alter due to state changes from solid hydrate to gas and water in the pore spaces.
Consumption of heat leads to a reduction in temperature when the hydrate dissociates. The temperature and pressure at the hydrate-water boundary should follow the phase equilibrium curve, but the actual measurable temperature is the average value of the hydrate dissociated fluid that is in phase equilibrium, and formation water and solid skeleton that is gradually cooled down. Furthermore, heat is brought from adjacent sediments by conduction and advection, and affecting the temperature.
For this project, two types of temperature sensors, Raman scattering-based distributed temperature sensing (DTS), which is widely used for gas/oil well monitoring71–75 and a temperature array of sensors (TAS‡) using a resistance temperature detector (RTD), which has a high temperature resolution were selected to fulfill the measurement requirements in terms of depth coverage, resolution and accuracy.
DTS uses optical fiber as an intrinsic sensor element and is capable of gathering data from a number of individual measurement points spatially distributed over the entire fiber length. DTS measures the rate between Stokes and anti-Stokes Raman back-scattering components in an optical fiber. The optical fibers were inserted in metal tubes connected to each other forming a U-turn or turn-around at the bottom of the cable. Two metal tubes were further protected with an encapsulation material to form a flat-pack cable.
For the RTD array, multiple (35) RTD sensors were welded together with pieces of an interval cable at a certain spacing (2 m each) to form a single temperature array. The detector uses platinum RTD, the resistance of which increases as the temperature rises. The detector and its electronics are located inside a protective metal housing and are therefore not exposed to fluids and reservoir pressure.
Table 2 describes the specifications of the RTD and DTS devices. RTD has higher temperature resolutions, and is regarded as a suitable tool to detect expected small temperature fluctuations in monitoring holes during production testing, despite the number of devices deployed being limited and thus range and spatial resolution being restricted. Moreover, DTS provides robust measurements and higher spatial resolution (1 m), and therefore it was selected as sensors for the production well, in which larger changes of temperature are expected. DTS was also used for long-term measurement in the monitoring boreholes, in which measurements over approximately one and half year-longs were planned, to record the effects of cement hydration and its relaxation,76,77 static geo-thermal conditions,78 effects of hydrate dissociation, and recovery of temperature after the production test.
| DTS | RTD array | |
|---|---|---|
| a Depending on the necessity of temperature resolution and sampling frequency. | ||
| Temperature resolution (K per 10 min) | 0.1 | 0.002 |
| Temperature absolute accuracy (K) | ±0.5 | ±0.1 |
| Vertical resolution (m) | 1 m | 2 m |
| Number of sensor | 35 | |
| Sampling time interval | 5 min to 2 h | 1 min |
| Covering zone (mBTMHCZ) | (1 m each) | (2 m each) |
| AT1-P | −280 to 32 m | — |
| AT1-MT1 | −274 to 44.66 m | −34.07 to 40.93 m |
| AT1-MC | −276 to 65.45 m | −16.45 to 61.55 m |
| Acquisition duration (0: time of pumping start) | ||
| AT1-P | −11 to 164 hours | — |
| AT1-MT1 | −366 to 156 days | −59 to 152 hours |
| AT1-MC | −371 to 138 days | −67 to 152 hours |
In the production hole (AT1-P), DTS was installed along with tubing at the center of the borehole. The gas production section of the hole was drilled with an 8-1/2′′ drill bit; thus, the hole diameter was approximately 21.5 cm or more (due to wellbore sloughing). In the hole, a gravel pack system79 was installed in the reservoir section as a sand-control device, and production tubing was installed at the center of the hole.36 The fluids (gas and water) inflow into the hole from the surrounding formation through the gravel pack device, in which coarse ceramic particles fill the space outside the slotted steel base pipe and metal screen, and the fluids flow upward to the surface.
The DTS covers 0 m to 38 mBTMHCZ of the production hole AT1-P. The pressure was measured at the pump intake depth (1184 mMSL (meters below the mean sea level) or −94 mBTMHCZ) and in the hydrate reservoir (1301 mMSL or 23 mBTMHCZ).
In both the monitoring holes, temperature sensors were installed in the casing annulus (9-5/8′′ casing in the hole drilled by a 12-1/4′′ bit, so the actual hole diameter was approximately 30 cm), and the annular spaces were subsequently filled with cement. In the case of AT1-MC, the inside of the casing was kept open to run geophysical logging tools for cased-hole logging before and after the flow test. The casing of AT1-MT1 well was filled with cement to prevent convection of fluid, which would generate interference with temperature measurements.
The measurements of DTS started immediately after installation and could monitor cement hydration heating and its relaxation and the initial temperature of the formation before the start of the depressurization operation.
Depressurization operation and gas/water production
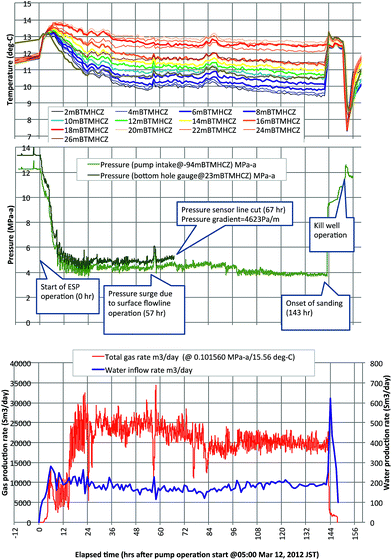
In March 2013, the gas-production test by depressurization was performed one year after the drilling operation with the same drilling platform. During the one-year suspension term, the cement hydrate heat around boreholes was effectively cured. Immediately before the production test, the reservoir section of the production hole was drilled, followed by installation of the sand-control device in the production section. After running downhole production systems36 that included an electrical submersible pump (ESP), a centrifugal gas–liquid separator, and pressure and temperature sensors, the operation of ESP in the test string started to displace the water from the borehole to surface at 05:00, March 12, 2013 JST (UTC + 9). Here-in-after, this moment is defined as hour zero. The produced gas and liquid were separated at the down hole and transported to the surface through independent flow lines.Fig. 6 shows the measured pressure and temperature data in the production borehole (AT1-P) with gas and water production rates. The original bottom hole pressure was approximately 13.5 MPa (higher than the in situ pore pressure due to the deck height of the test vessel = 28.3 m). The initial temperature in the hole was cooler than the original formation temperature because of circulation of liquid that was cooled down by seawater around the seafloor. Quantitative analytical results are discussed below.
In the original plan, the target pressure of depressurization was set to 3 MPa, which is close to the equilibrium pressure at freezing temperature (0 °C). Moreover, in the plan, the bottom hole pressure should have been gradually reduced in stages to observe the intermediate state between the original and the target. However, the occurrence of complicated multi-phase flow regimes in the water and gas flow lines in the initial stage made the pressure control difficult even with variable speed drive and surface choke control and the bottom hole pressure at the reservoir depth dropped to 5 MPa (8.5 MPa less than the original) within 12 hours and remained at that level until 98 hours, except for some fluctuations due to sluggish flow and short surges, resulting from intentional surface operations.
The electrical signal communication with downhole pressure gauge was disrupted at 67 hours, but another sensor at the pump intake continued to work until the end of the flow. The pressure gradient in the hole at the time of the disconnection was 4623 Pa m−1; this value is used to extrapolate the pressure distribution of intervals below the pump intake. The pressure in the reservoir depth remained at ∼4.5 MPa after 98 hours until the end of the moment of sand production (143 hours).
During the entire time of the flow, the gas and water rates were almost stable at approximately 20![[thin space (1/6-em)]](https://www.rsc.org/images/entities/char_2009.gif) 000 m3 per day and 200 m3 per day, respectively (under ambient conditions). The gas/liquid ratio was around 100, almost half the theoretical value of methane hydrate-dissociated fluids, but gradually reduced throughout the flow.
000 m3 per day and 200 m3 per day, respectively (under ambient conditions). The gas/liquid ratio was around 100, almost half the theoretical value of methane hydrate-dissociated fluids, but gradually reduced throughout the flow.
However, at hour 143, an abrupt pressure surge and temperature recovery were observed at the surface. Approximately 20 minutes later, a massive sand flow reached the surface and filled the production systems, which lost functionality. Although the ESP was still working, depressurized conditions could not be maintained due to the very strong water influx from the reservoir that could not be handled and filling of the surface devices by sand. Thus, the operation was forcibly terminated.
To stabilize the well and prevent further gas production, seawater was injected into the hole to return the pressure to the original state (kill well operation, 149–154 hours). During the operation, a volume of water loss was observed. Finally, the hole was plugged by a bridge plug and abandoned, so hydraulic communication between the reservoir and the surface or seafloor could not continue (233 hours). Finally, the AT1-MC and MT1 wells were plugged and abandoned in July and August of 2013, 4 months later.
The history of the operation is summarized in Table 3.
| Calendar date and time JST (=UTC + 9) | Elapsed time | Event |
|---|---|---|
| 2012 | ||
| Feb 25 00:00 | −371 days | AT1-MC DTS ON |
| Mar 11 01:10 | −366 days | AT1-MT1 DTS ON |
![[thin space (1/6-em)]](https://www.rsc.org/images/entities/char_2009.gif) |
||
| 2013 | ||
| Mar 09 15:00 | −62 hours | AT1-MC RTD ON |
| 18:00 | −59 hours | AT1-MT RTD ON |
| Mar 11 18:02 | −11 hours | AT1-P TDS ON |
| Mar 12 05:00 | 0 | Start ESP |
| 05:40 | 0.67 hours | Start pressure drop |
| 10:00 | 5 hours | Start gas flaring |
| Mar 16 00:00 | 67 hours | Disconnect downhole pressure gauge |
| Mar 18 04:00 | 143 hours (6 days) | Onset of sanding |
| 04:15 | 143.25 hours | Sand reached surface |
| 09:40 | 148.67 hours | Start kill-well operation |
| 13:00 | 152 hours | MC/MT1 RTD OFF |
| 15:00 | 154 hours | Finish kill-well operation |
| Mar 20 01:00 | 164 hours (8 days) | AT1-P DTS OFF |
| Mar 22 22:00 | 233 hours (10 days) | Set bridge plug (communication between wellbore and formation disrupted) |
| Jul 16 00:00 | 138 days | AT1-MC DTS OFF |
| Aug 03 12:00 | 156 days | AT1-MT1 DTS OFF |
Results of the measurements and major observations in downhole temperature data
Production borehole
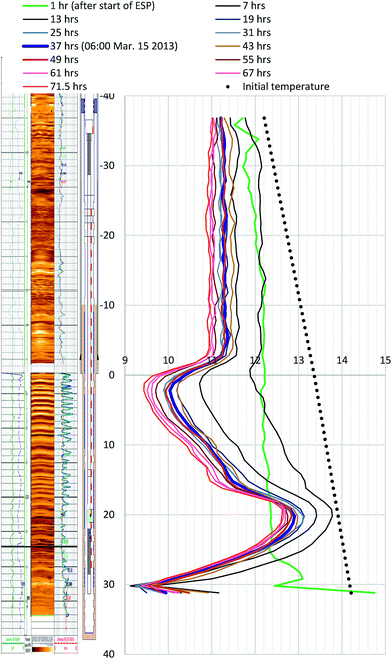
Fig. 7 depicts the temperature profile in the production interval at every 12 hours during the flow test. The pressure and temperature conditions are plotted in Fig. 8 for points at every 2 m. Highlighted depths (from 6 m to 18 mBTMHCZ) are commonly focused on in this study. A temperature drop was observed in the entire section, and there were two low-temperature troughs at 2 mBTMHCZ (or the top of the open-hole interval) and the bottom section of the sensor deployment (30 mBTMHCZ), and one relatively high-temperature peak at 20 mBTMHCZ.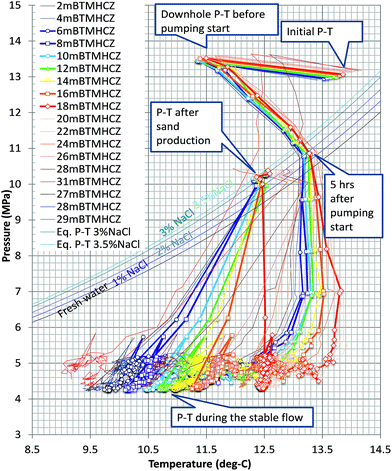 | ||
| Fig. 8 Relationship between measured temperature and estimated pressure with the phase-equilibrium curve of MH and vapour methane in the producer hole (AT1-P). Temperature is the value measured in the hole by DTS; pressure at each level is interporated with pressure gradients from the differential pressure between two sensors. “Initial P–T” is the estimated value under undisturbed conditions using the temperature sensor data from AT1-MT1 and the pressure gradient. The phase equilibrium curves for each salinity are based on Moridis et al.18 | ||
It should be noted that the sensors set in the hole measured the temperature of the mixed fluid from both influx from the formation at depth and flowing fluid in the hole; thus, the temperature drop trend means that the inflowing fluid was cooler than the fluid in the hole. From this viewpoint, the fluid influx was cool in Unit IV-1 (0–19 mBTMHCZ) and warm in Unit IV-2 (19–30 mBTMHCZ).
Prior to commencement of the pumping operation (negative hours), the temperature in the production hole was lower than the in situ formation temperature that was measured by DTS in the MT-1 and MC wells (initial PT in Fig. 8) after the one-year curing time, because of the circulation of fluid that had been cooled by cold seawater during drilling and completion operations (downhole P–T before pump start in Fig. 8).
Immediately after initiation of the pump drive, as the pressure decreased, the measured temperatures increased to the original initial temperature due to inflow of warm formation water; however, the warming ceased when the PT state reached the MH phase equilibrium curve. Until that moment, the PT plots were almost parallel, but they subsequently began to diverge. In all the sensors, as the pressure decreased to the target pressure, the temperature gradually reduced and reached almost stable PT conditions with some fluctuation. As shown in Fig. 6, the temperature continued to decrease.
After the moment of sand production (143 hours elapsed time), the PT conditions went back to the phase equilibrium conditions and stabilized again (PT after sand production in Fig. 8).
The nature of the PT curves suggests that the temperature in the production hole was mainly governed by dissociation of methane hydrate, but the detailed process at each depth varied. The reasons for the variation are discussed in the next section.
Monitoring boreholes
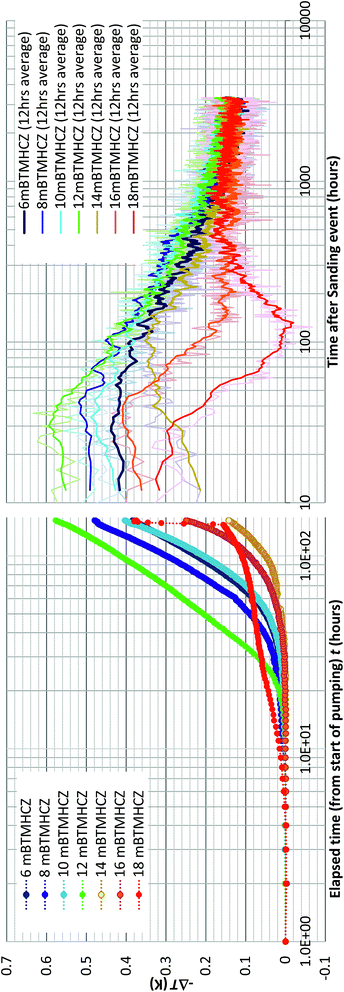
Because of the minimal temperature disturbance by convection of fluid in the casing, the temperature data obtained in AT1-MT1 (22 m offset from the production hole) are mainly discussed here. Fig. 9 depicts the temporal trend of temperature variation (ΔT = Tmeasured − Toriginal) of each sensor before, during, and after the production test. Fig. 10 shows details of the variations at some crucial depths (6–18 mBTMHCZ).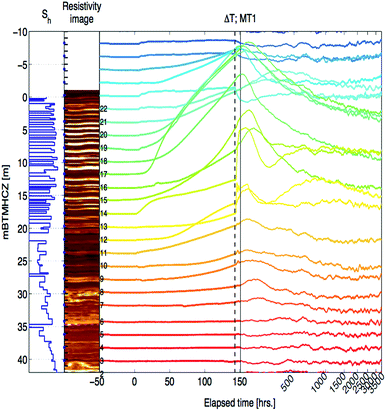 | ||
| Fig. 9 Temperature changes (−ΔT) of each RTD sensor and corresponding DTS reading before, during and after the production test. | ||
During the production term (0–143 hours), the sensors in Unit IV-1 (0–19 mBTMHCZ) and Unit IV-2 (19–30 mBTMHCZ) could detect a temperature-decreasing trend (increase in −ΔT), but the effect was not obvious in Unit IV-3 (30–38 mBTMHCZ). Moreover two sensors above the production zone (−2 and −4 mBTMHCZ) measured a clear temperature drop. The maximum temperature drop occurred at the sensor at 16 mBTMHCZ, and the magnitude of variation reached approximately 0.6 K.
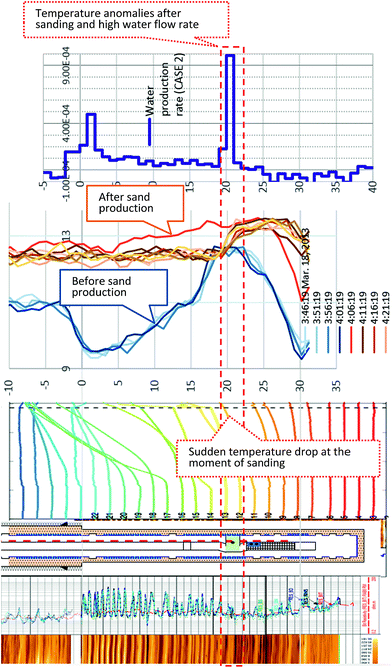
During the sand production (143 hours), some specific sensors (e.g., 18 m and 20 mBTMHCZ) detected a sudden and relatively large temperature drop. Moreover, the sensor at 0 mBTMHCZ recorded a small temperature increase.
After the flow ended, the temperature-decreasing trend continued in most of the production interval depths, and the largest delay in the temperature peak (50–60 hours after sand production, when the bottom hole pressure started to recover to the hydrostatic pressure) was observed by the sensor at 14 mBTMHCZ, despite other sensors recording lowest peak around 30 hours after the sand event. On the other hand, two sensors that had been highly influenced by the sand (18 m and 20 mBTMHCZ) displayed a temperature rebound after rapid temperature decreases. In the entire intervals of Units IV-1 and IV-2, the temperature did not fully recovered to the original state even after 3000 hours of measurement.
By observing the detailed characteristics of the temperature decrease trend during the production term in Fig. 9 and 10, two different patterns of temperature drop are apparent. After detecting a sensible change at a certain moments, most of the sensor values move on convex-downward curves and transform to a concave curve. In the semi-log (−ΔT − log![[thin space (1/6-em)]](https://www.rsc.org/images/entities/char_2009.gif) t) plot (Fig. 10), straight portions of the lines indicate logarithmic changes in temperature −ΔT after a certain time after the start of the alternation. The slopes of those variations have similar values except for that at 18 mBTMHCZ. In contrast, the sensor data at 18 mBTMHCZ indicate an immediate temperature drop after pump start with a concave function.
t) plot (Fig. 10), straight portions of the lines indicate logarithmic changes in temperature −ΔT after a certain time after the start of the alternation. The slopes of those variations have similar values except for that at 18 mBTMHCZ. In contrast, the sensor data at 18 mBTMHCZ indicate an immediate temperature drop after pump start with a concave function.
As observed in the temperature decrease trend during production, temperatures start decreasing at given moment and decrease following an exponential curve (thus the straight lines in the linear-log plot). Most of sensor values are on a straight line with a slope of 2–3; therefore,
| −ΔT = 0.7 − 0.8 × log10[(t − t0)]. | (3) |
This logarithmic feature suggests that the temperature variation obeyed planar axisymmetric fluid flow that caused the pressure-proportional temperature drop due to hydrate dissociation. Detectable temperature alteration began at 7 hours at 8 mBTMHCZ to 28 hours at 14 mBTMHCZ after the start of the pumping operation.
In contrast, the data at 18 mBTMHCZ started dropping within four hours of elapsed time, when the PT conditions in the production well had not reached the hydrate instability state and temperature was almost stable at approximately −ΔT = 0.1 K. Thus, this feature should not have been caused by methane hydrate dissociation, but it is more reasonable to assume that some cooler fluid (−ΔT = 0.1 K) flowed in the layer. It is interesting that maximum temperature at the moment of sand production was observed in this layer.
The temperature curves of 6, 8, and 12 mBTMHCZ merge into a single line. A possible reason for this is that there was some fluid interflow between the layers and equalization of pressure, after which the common phase-equilibrium temperature was detected. This feature was not caused by the equalization of temperature due to conduction because the temperature at 10 mBTMHCZ (between 8 and 12 m) was different from that in the other layers.
To cause temperature changes due to gas hydrate dissociation, at least 1.5 to 2 MPa of pressure drop condition should reach the location of the MT1 hole (20 m away from the production hole). A semi-quantitative analysis considering the heat capacity of formation fluid and solid will be discussed in a later section.
The heat recovery process was more complex. During sand production, when the pressure recovered to the original value within a few hours, some sensors detected a continuous temperature drop suggesting that hydrate dissociation occurred. The peak of −ΔT occurred 30–40 hours after the sanding in the sensors at 6, 8, 12 and 16 mBTMHCZ, but the peak was observed 100 hours after the event at 14 mBTMHCZ.
The sensor at 12 mBTMHCZ measured temperature rebound after a relatively quick temperature recovery to the original state. In the final stage, the readings of all sensors were similar, so homogenization of the temperature due to heat conduction may have occurred during the long recovery process. In the case of the sensor at 18 mBTMHCZ, the rapid decrease in temperature was caused by flow of formation fluid that had the original temperature of the formation (−ΔT = 0) but gradual conduction increased the temperature to balance that of adjacent layers. This rapid temperature drop and recovery at the specific depth (18 mBTMHCZ) could have been influenced by permeability enhancement by sand production, which could from a wormhole-like fluid pathway.
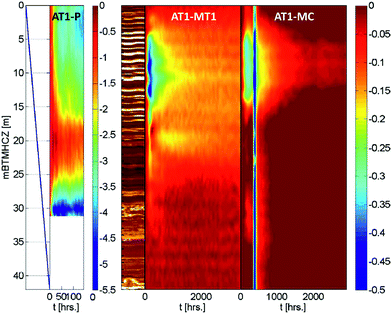
Fig. 11 shows color contours of the temperature records of three boreholes. Although the AT1-MC well (30 m offset from the production well) was relatively further away than MT1 and was influenced by natural and intended fluid motion and the plugging and abandonment of the borehole, similar temperature profiles were observed during and after the production operation.
Flow rate estimation from temperature data of the production well
Heat conservation model
In this section, vertical profiles of gas and liquid flow are estimated using DTS-derived temperature data for the AT1-P producer well. Understanding the relationship between gas productivity and reservoir properties and knowledge of productive formations and their natures are keys to evaluate the performance of individual reservoirs. Moreover, information on the gas and liquid productivity of each individual layer is valuable to understand undesired phenomena such as sand production. However, due to technical limitations of deepwater wells with complicated upper completion, no direct flow rate measurement was conducted; therefore, the origin and rates of liquid and gas can be evaluated only a limited data set.In this study, the liquid and gas flow rates are estimated using the temperature data obtained in the production borehole (AT1-P) and energy balance equations.
The approach to obtain the flow rates is
(1) Assume the temperature of liquid and gas from the petro-physical properties of the reservoir, particularly porosity and gas hydrate saturation in pores.
(2) Calculate flow rates that can satisfy the heat conservation and constraints of measured total flow rates by a mathematical optimization process.
To model the thermodynamic conditions in the borehole and the reservoir, the following assumptions are made:
• The gas hydrate reservoir is horizontally deposited alternations of silty and sandy sediment, and each layer is laterally homogeneous.
• For the borehole and flow in the hole:
▫ The production borehole is a vertical hole that is normal to the strata.
▫ The produced gas and water flow upward in the annulus space between the tubing and the base pipe of the sand-control device because the bottom of the tubing was almost closed by a sensor carrier.
▫ Heat-exchange by conduction between the formation and the fluid in the borehole does not occur, and heat transport is entirely by advection of fluid influx.
Furthermore, to reduce the number of unknowns, the assumed temperatures of the fluids are given a priori in accordance with a one-dimensional reservoir characterization model provided by the G&G team of MH21 using obtained core samples and geophysical logging data.52,56 The model is illustrated in Fig. 4. The variables and material properties used are summarized in Table 4.
| Variables to be solved | ||
| Fluid influx rate per length | q(g)in, q(w)in | kg s−1 m−1 |
![[thin space (1/6-em)]](https://www.rsc.org/images/entities/char_2009.gif) |
||
| Geometric parameter | ||
| Depth | Z | m |
![[thin space (1/6-em)]](https://www.rsc.org/images/entities/char_2009.gif) |
||
| Known, measured, or assumed values | ||
| Measured temperature in the borehole | T(z) | °C |
| Water and gas temperature in influxes | T(g)in, T(w)in | °C |
| Bottom hole pressure at depth = z | pBHz | Pa |
| Initial formation pressure at depth | p0z | Pa |
| Gas hydrate saturation (volume fraction in pore space) | Sh | — |
![[thin space (1/6-em)]](https://www.rsc.org/images/entities/char_2009.gif) |
||
| Calculated values | ||
| Heat influx rate in a unit length of borehole | Qin | J m−1 s−1 |
| Fluid velocity | v | m s−1 |
| Flowing fluid temperature | T(z) | °C |
| Fluid influx temperature (averaged) | Tin | °C |
| Water and gas fluxes in the borehole | q(w), q(g) | m3 s−1 |
| Joules–Thomson coefficient of the mixtures | Cj | J Pa−1 |
![[thin space (1/6-em)]](https://www.rsc.org/images/entities/char_2009.gif) |
||
| Material properties | ||
| Equilibrium temperature at pressure = p18 | Teq|p | °C |
| Specific heat capacity of gas at constant pressure | c(g)p | 1.497 kJ m−3 K−1 |
| Specific heat capacity of water at constant pressure | c(w)p | 4.109 kJ m−3 K−1 |
| Mass fraction of water in MH | f(w)m | 0.871 (hydration number is 6.1) |
| Gas hydrate dissociation heat | ΔHh | 436![[thin space (1/6-em)]](https://www.rsc.org/images/entities/char_2009.gif) 800 J kg−1 800 J kg−1 |
(A) If the pressure at the gas hydrate dissociation front is the same as the borehole pressure at the same level pBHz, then no pressure drop occurs in the reservoir.
(B) The temperature of the produced gas is the phase equilibrium temperature of gas hydrate and vapor-phase methane at the pressure. Two models are applied (the Joule–Thomson effect is not considered and considered)
 | (4-1) |
 | (4-2) |
(C) Three models are applied for the temperature of the produced water. In the first model, the water temperature is original formation temperature.
| T(w)in = T0z | (5-1) |
In the second model, the temperature of the produced water is the average of the phase-equilibrium temperature and initial formation temperature because both gas hydrate-dissociated and original formation water are produced simultaneously. The ratio of dissociation/original pore fluid is determined from hydrate saturation Sh.
 | (5-2) |
In the third model, the Joule–Thomson effect is not considered and considered to the previous model.
 | (5-3) |
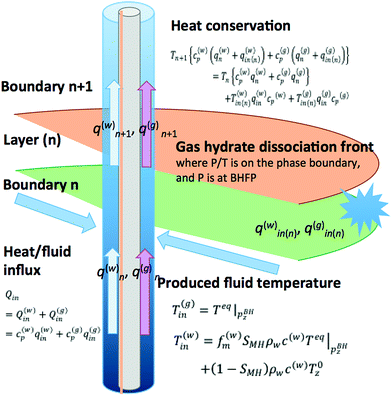
In both water and gas cases, we conducted the evaluation with and without consideration of the Joule–Thomson effect. The modeled production borehole and gas/water/heat transport situations are summarized in Fig. 12. The bottom hole temperature and pressure used here are the data obtained at 6:00 AM on March 2013 (JST = UTC + 9) when the gas and water production rates and measured temperature had almost stabilized.
Wang80 proposed a procedure for calculation of the gas/liquid influxes to the borehole from the temperature profile data. For the calculation, in the gas-production interval of the production borehole, the thermal energy conservation of the flowing fluid can be written as
 | (6) |
 | (7) |
In the case of our problem, we focus on the production zone of the borehole, and most of the heat is transported by advection; thus the heat conduction term (the second term on the right-hand-side) can be negligible. Moreover, due to the short length of the production interval the gravitational potential and kinetic energy term (third term) and the Joule–Thomson effect (fourth term) on the right-hand-side can be neglected. Instead, we focus on the endothermic effect of methane hydrate dissociation that causes large temperature drop.
The discretized form of eqn (6) can be written as
| Tn+1{c(w)p(q(w)n + q(w)in(n)) + c(g)p(q(g)n + q(g)in(n))} = Tn{c(w)pq(w)n + c(g)pq(g)n} + T(w)in(n)q(w)inc(w)p + T(g)in(n)q(g)inc(g)p | (8) |
Joule–Thomson effect is considered using the following equation
 | (9) |
 | (10) |
 | (11) |
The contribution of the Joule–Thomson (J–T) effect to the temperature in the reservoir is not obvious because if assumption (A) is correct, no J–T effect does not take place, however in a real situation, the pressure in the reservoir would not be constant. For this reason, thus two cases (the J–T effect case and the no J–T effect case) are considered.
Optimization process
The gas and water flow rates from the bottom of the hole are assumed to be zero, and the flow rate at the top of the production section is assumed to be the rate of gas production at the surface, the following values are assumed| q(g)0 = q(w)0 = 0 | (12-1) |
q(g)N = 0.23 [S m3 s−1] = 20![[thin space (1/6-em)]](https://www.rsc.org/images/entities/char_2009.gif) 000 [S m3 per day] 000 [S m3 per day]
| (12-2) |
| q(g)N = 0.23 × 10⁻³ [S m3 s−1] = 200 [S m3 s−1] | (12-3) |
Moreover, the influx of gas and liquid in the each segment should be not negative value. Therefore, the problem can be rewritten as follows.
Find the values of liquid and gas influx: q(w)in,q(g)in (n = 1, N) that can minimize the value of the residual error function
 | (13) |
Under the equality constraints
 | (14) |
The penalty function method for constrained optimization problems with both equality and inequality constraints81,82 was applied.
To carry out the optimization, a penalty function F(q(w)in,q(g)in|T,T(w)in,T(g)in) is defined as follows:
 | (15) |
 | (16-1) |
 | (16-2) |
The following process is performed.
(1) Tolerance values are set as ε1 = ε2 = 10−10.
(2) The initial value of q(w)[0]in,q(g)[0]in are set to be values that satisfy that f(q(w)[0]in,q(g)[0]in|T,T(w)in,T(g)in) = 0 under given values of T,T(w)in,T(g)in.
(3) The initial penalty parameter is set to ρ = 1. Then the following recurrent convergence process is conducted.
(4) Perform unconstrained optimization on the function F(q(w)in,q(g)in|T,T(w)in,T(g)in) using the conjugate gradient method of OPMIM() function in the R library and obtain the values (q(w)[k]in,q(g)[k]in).
(5) Check the convergence criteria. If
 | (17) |
| |F(q(w)[k]in,q(g)[k]in|T,T(w)in,T(g)in) − F(q(w)[k−1]in,q(g)[k−1]in|T,T(w)in,T(g)in) < ε2, | (18) |
Optimization results
The following three water and gas temperature-profiles cases – with and without consideration of Joule–Thomson effect – were given for the optimization process, and water and gas production rates were obtained as illustrated in Fig. 13-1–3.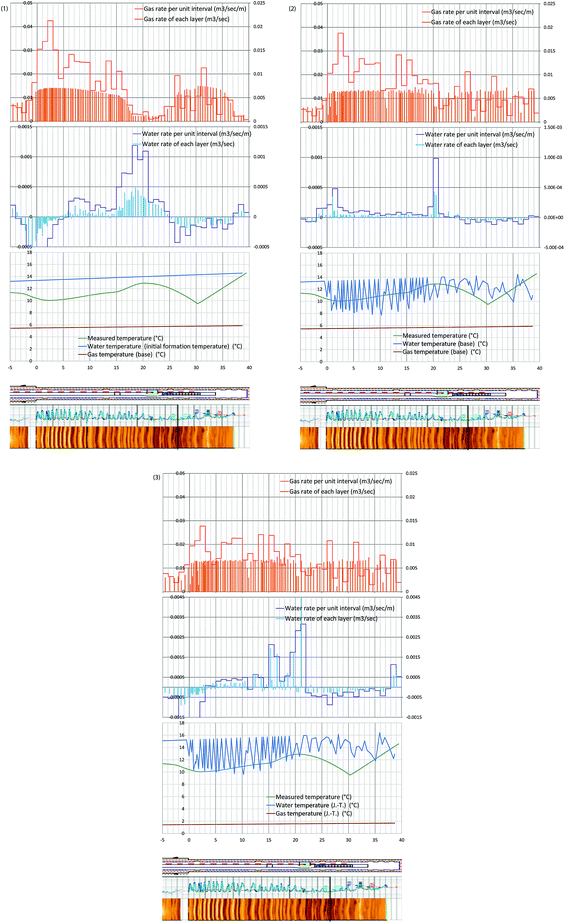 | ||
| Fig. 13 (1) Evaluated gas and water rates from each layer, and the 1 m average of those values with temperatures of produced water and gas, and measured temperature (hour 73 after the pump operation started). Case 1: the temperature of produced water is the initial formation temperature. Produced gas temperature is assumed to be the phase equilibrium temperature. No Joule–Thomson effect is considered (eqn (4-1) and (5-1)). (2) Evaluated gas and water rates from each layer, and the 1 m average of those values with temperatures of produced water and gas, and measured temperature (hour 73 after the pump operation started). Case 2: the produced liquid is the mixture of formation water and methane hydrate-dissociated water. The temperature of produced water is the initial formation temperature. Produced gas temperature is assumed to be the phase equilibrium temperature. No Joule–Thomson effect is considered (eqn (4-1) and (5-2)). (3) Evaluated gas and water rates from each layer, and the 1 m average of those values with temperatures of produced water and gas, and measured temperature (hour 73 after the pump operation started). Case 3: the produced liquid is the mixture of formation water and methane hydrate-dissociated water, and the Joule–Thomson effect is considered. The temperature of produced water is the initial formation temperature. Produced gas temperature is assumed to be the phase equilibrium temperature. The Joule–Thomson effect is considered (eqn (4-2) and (5-3)). | ||
Case 1 (Fig. 13-1): the temperature of produced water is the initial formation temperature. Produced gas temperature is assumed to be the phase equilibrium temperature. No Joule–Thomson effect is considered (eqn (4-1) and (5-1)).
Case 2 (Fig. 13-2): the produced liquid is the mixture of formation water and methane hydrate-dissociated water. The temperature of produced water is the initial formation temperature. Produced gas temperature is assumed to be the phase equilibrium temperature. No Joule–Thomson effect is considered (eqn (4-1) and (5-2)).
Case 3 (Fig. 13-3): the produced liquid is the mixture of formation water and methane hydrate-dissociated water, and the Joule–Thomson effect is considered. The temperature of produced water is the initial formation temperature. Produced gas temperature is assumed to be the phase equilibrium temperature. The Joule–Thomson effect is considered (eqn (4-2) and (5-3)).
In the figures, the bars at each layer indicate the gas/water influxes of each layer, and solid lines indicate gas/water influxes from each 1 m section.
In every case, strong gas influx should occur in Unit IV-1 section and moderate gas influx in Unit IV-3. This result matches the temperature data of the monitoring borehole, in which strongest temperature drop happened in Unit IV-1. In the case of water rate, it is common observation that the dominant water-producing zone is the boundary between Units IV-1 and IV-2 (15–22 mBTMHCZ). Water influx from Unit IV-3 is small and sometime negative value was calculated. In those regions, the assumed gas temperature was too low, or water temperature was too high to compensate each other.
The result of this calculation process cannot be assumed to be a unique solution; thus, the given water and gas profiles represent possible solutions, but overall the conditions of the profiles are reasonable considering the reservoir characteristics.
Unit IV-1 shows the relatively high methane hydrate saturation, and the observed temperature is cool; thus, the main gas-production zone should be Unit IV-1. On the other hand, Unit IV-2 and the boundary zone should produce relatively warm water that causes warm up of the flowing fluid in the hole.
Among the three fluid temperature cases, the Case 2 result is the least irrationality with relatively small negative water flux that is required to compensate the energy unbalance.
Thermal response of the methane hydrate reservoir inferred from temperature data from monitoring boreholes
In this section, the RTD-derived high precision data in the AT1-MT1 wells are used for comparison of the temperature measurements and the results of the simplified thermodynamic and hydraulic models with the fewest assumptions, and the hydraulic parameters of the formation are evaluated. Moreover, the gas production from the methane hydrate dissociation process is calculated for comparison with the measured volume of methane gas production.Model hypothesis of hydraulic and thermal transport in the reservoir
In this section, the analysis focuses on the vicinity of the monitoring boreholes AT1-MT1, which is 20 m away from the production borehole at the reservoir depth.Due to the relatively short period of the operation, methane hydrate dissociation mainly occurred in the vicinity of the production hole, where quite complex non-linear and transient phenomena such as physical property changes due to gas hydrate dissociation and mechanical effects on the properties should have taken place. However, it can be assumed that the monitoring borehole is under relatively static conditions. Therefore, the following assumptions are made for this preliminary thermal analysis.
(1) The fluid flow and pore-pressure distribution in the formation obey Darcy's law. Each layer is horizontal, laterally homogeneous and isotropic. Vertical permeability is effectively zero due to the existence of inter-bedding low permeability clay zones, and so the fluid flow is regarded as a production well-centric radial flow.
(2) In the modeled area, the hydraulic and thermal properties of the sediments (such as sediment permeabilities and heat capacities) are constant and not affected by depressurization and methane hydrate dissociation.
(3) The thermal condition of the sediment at any point around the monitoring well is adiabatic, and the lack of conduction and convection contributes to temperature variation in the sediments, but only methane hydrate dissociation causes this variation. The necessary heat for the dissociation process is supplied from explicit heat of the gas hydrates themselves, sediment grains, and pore fluid.
(4) The pressure and temperature status after methane hydrate dissociation approaches the phase equilibrium of methane hydrate and the vapor phase of gas.
Model parameters and adopted governing equations are summarized in Tables 5 to 8. The validity of assumption (3) is checked with the approximate calculation
 | (19) |
| a 0.05 is set to avoid zero gas effective permeability at the initial stage. | ||
|---|---|---|
| Geometry (well centric axisymmetric 1D) and initial properties | ||
| Well radius | 0.1 m | |
| External radius of simulation domain | 500 m | |
| Initial hydrate saturation | Sh0 | 0.6 |
| Initial reservoir pressure | P0 | 13 MPa |
| Initial gas saturation | Sg0 | 0 (0.05a) |
| Initial water saturation | Sw0 | 0.4 |
| Porosity | φ | 0.3 |
| Initial temperature | T0 | 15.5 °C |
| Dimensionless phase equilibrium pressure | ye0 | 0.9 (range: 0.85 to 0.95) |
![[thin space (1/6-em)]](https://www.rsc.org/images/entities/char_2009.gif) |
||
| Material properties – liquid | ||
| Compressibility | βw | 4.5 × 10⁻¹⁰ Pa−1 |
| Viscosity | μw | 10−3 Pa s |
![[thin space (1/6-em)]](https://www.rsc.org/images/entities/char_2009.gif) |
||
| Material properties – gas | ||
| Compressibility | βg | 7.7 × 10⁻⁸ Pa−1 |
| Viscosity | μg | 10−5 Pa s |
Firstly, horizontal pressure profile was calculated by the one-dimensional axisymmetric multiphase fluid model described by eqn (22) and (23) in Table 6. In this calculation, the methane hydrate dissociation rate and the volumes of produced gas and water are computed using the kinetic equation (eqn (24) in Table 7 (ref. 21, 86 and 87)). The produced gas influences the effective permeability through eqn (23) in Table 6.
| Reservoir property – hydraulic | ||
| Darcy's equations and the equation of continua83 | ||
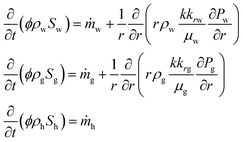 (22) (22) |
||
| Absolute permeability (intrinsic permeability of sediment without hydrate) | k | 10 mD (range 0.1–50 mD) |
![[thin space (1/6-em)]](https://www.rsc.org/images/entities/char_2009.gif) |
||
| Relative permeability parameters | ||
| Corey-exponent representation84,85 | ||
 (23-1) (23-1) |
||
 (23-2) (23-2) |
||
| Irreducible water | Swr | 0.25 |
| Irreducible gas | Sgr | 0.02 |
| Exponent | n | 3 |
| Boundary condition at the well (center of the domain) | P(r = 0) = const (Dirichlet) | 0.385 (5 MPa/13 MPa) |
| External boundary condition | qr (r = 500 m) = 0 (Neumann) | 0 (no flow boundary) |
| Kinetics parameters of MH dissociation in the Kim and Bishnoi equation21,86,87 | ||
| ṁg = MhkdAs(peq(r,T) − p) (24) | ||
| where | ||
 |
||
 |
||
 |
||
| ṁh = −(ṁg + ṁw) | ||
| Dissociation rate | kd | 8.7 × 10⁻¹⁰ mol m−2 Pa−1 s−1 |
| Hydrate surface | As0 | 105 m2 m−3 |
| Dissociation gas volume ratio | Bh | 181 |
| MH molar mass | Mh | 0.016 kg mol−1 |
| MH density | ρh | 893.7 kg m−3 |
| Molar volume at standard condition | VM | 22.4 L mol−1 |
Around the monitoring well, the temperature drop ΔT is calculated by the dissociation heat of dissociated gas hydrate in unit volume ϕΔShΔHh and ratio of the heat capacity of bulk material and gas hydrate as follows:
 | (20) |
Fig. 14 shows the calculated time variation of temperature at the position r = 20 m (the approximate distance between AT1-MT1 and AT1-P well) for various values of permeability (3–50 mD, dashed black lines) and measured temperature changes at some depths.
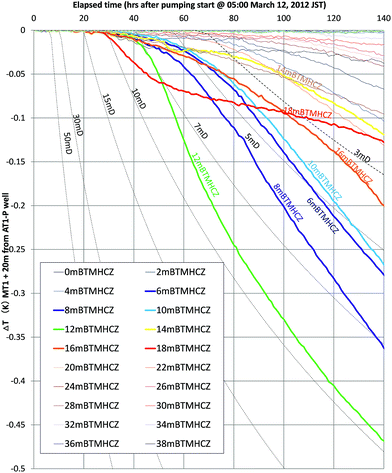 | ||
| Fig. 14 Estimated temperature drop for various permeabilities (k = 3–50 mD) at the location r = 20 m and measured the temperatures of selected depths in the reservoir of the AT1-MT1 borehole. | ||
The measured temperatures of the majority of the sections have similar profiles with numerically given temperature drops. Therefore, the assumptions of thermal condition and pressure drop advancement around the monitoring borehole are regarded as reasonable for this short-term test. From the comparison, the formation permeability of the gas-producing zones is estimated to be in the range of 3–10 mD. In the case of the deeper Unit IV-3 zone, the initial permeability should be far smaller (<1 mD).
Gas production and heat consumption
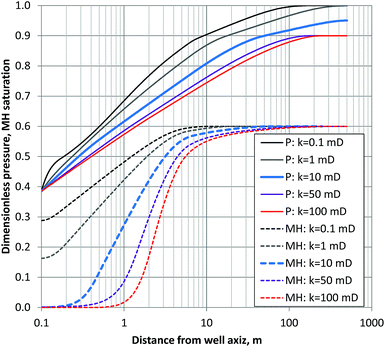
To verify the model is valid and the results match the heat consumption necessary for the gas volume that was actually produced, a non-isothermal model is applied with consideration of the energy equation (eqn (25)). Fig. 15 shows the calculated horizontal profiles of dimensionless pressure and hydrate saturation changes ΔSh at the time t = 140 hours. The calculation results show that large dissociation (e.g., >0.1 in ΔSh) occurs only in the area within 10 m of the production hole even in high-permeability cases.Fig. 16 shows the time progress of the cumulative gas-production volume (under ambient pressure) from 1 m thickness of formation with assigned permeability. By assigning some reasonable range of permeabilities based on core- and log-derived permeability values from past studies52,61,62 to each lithology defined in Fig. 4, the cumulative gas production volume can be calculated as shown in Table 9. The computed cumulative gas volume throughout the flow test ranges from 100![[thin space (1/6-em)]](https://www.rsc.org/images/entities/char_2009.gif) 000 to 130
000 to 130![[thin space (1/6-em)]](https://www.rsc.org/images/entities/char_2009.gif) 000 m3 under the ambient condition and matches the measured production gas volume (119
000 m3 under the ambient condition and matches the measured production gas volume (119![[thin space (1/6-em)]](https://www.rsc.org/images/entities/char_2009.gif) 000 m3) reasonably well.
000 m3) reasonably well.
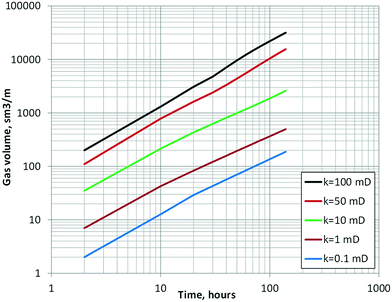 | ||
| Fig. 16 Temporal profile of cumulative gas volume generated per 1 m thickness of MH layer with various permeability values. | ||
![[thin space (1/6-em)]](https://www.rsc.org/images/entities/char_2009.gif) 000 m3, and matches the calculation results reasonably well
000 m3, and matches the calculation results reasonably well
| Lithology | Thickness (m) | Assigned perm. (mD) | Gas volume per unit thickness at t = 140 hour (m3 m−1) | Cumulative gas volume at t = 140 hour (m3) |
|---|---|---|---|---|
| High permeability case | ||||
| Clay (∼μm) | 11 | 0 | 0 | 0 |
| Silt | 8 | 1 | 468 | 3903 |
| Very fine sand | 8 | 12 | 3400 | 25![[thin space (1/6-em)]](https://www.rsc.org/images/entities/char_2009.gif) 704 704 |
| Fine sand | 11 | 28 | 9200 | 101![[thin space (1/6-em)]](https://www.rsc.org/images/entities/char_2009.gif) 292 292 |
| Total | 38 | — | — | 130![[thin space (1/6-em)]](https://www.rsc.org/images/entities/char_2009.gif) 899 899 |
![[thin space (1/6-em)]](https://www.rsc.org/images/entities/char_2009.gif) |
||||
| Intermediate perm. case | ||||
| Clay (∼μm) | 11 | 0 | 0 | 0 |
| Silt | 8 | 1 | 468 | 3903 |
| Very fine sand | 8 | 12 | 3400 | 25![[thin space (1/6-em)]](https://www.rsc.org/images/entities/char_2009.gif) 704 704 |
| Fine sand | 11 | 24 | 8100 | 89![[thin space (1/6-em)]](https://www.rsc.org/images/entities/char_2009.gif) 181 181 |
| Total | 38 | — | — | 118![[thin space (1/6-em)]](https://www.rsc.org/images/entities/char_2009.gif) 788 788 |
![[thin space (1/6-em)]](https://www.rsc.org/images/entities/char_2009.gif) |
||||
| Low perm. case | ||||
| Clay (∼μm) | 11 | 0 | 0 | 0 |
| Silt | 8 | 2 | 800 | 6672 |
| Very fine sand | 8 | 13 | 3814 | 28![[thin space (1/6-em)]](https://www.rsc.org/images/entities/char_2009.gif) 834 834 |
| Fine sand | 11 | 20 | 6500 | 71![[thin space (1/6-em)]](https://www.rsc.org/images/entities/char_2009.gif) 565 565 |
| Total | 38 | — | — | 107![[thin space (1/6-em)]](https://www.rsc.org/images/entities/char_2009.gif) 071 071 |
The total production volume of methane gas calculated from the model used for the temperature estimation matches the actual measurement reasonably well with assumed permeability.
The consumed thermal energy for gas hydrate dissociation in a unit depth is computed by the following equation:
 | (21) |
The total consumed energy is calculated as 2.30 × 10¹¹ J. The result is consistent with the calculated values from chemical reaction formula (eqn (24)) which is 2.75 × 10¹¹ J.
Events related to sand production
As shown in Fig. 17, it is interesting that data from the monitoring and production boreholes consistently show that some anomalies occurred at a certain depth when sand production occurred 143 hours after the flow started.24,76In the case of monitoring boreholes, a rapid, relatively large temperature drop was observed at 18 and 20 mBTMHCZ. After the production test, quick recovery of temperature with some rebound occurred in the same layer.
In the case of the production borehole, after the production test, a temperature discontinuity was observed at 20 mBTMHCZ (above this level, the temperature is cooler than that below), and some cool fluid should have flowed in this layer. The temperature of this cooler fluid matched the water temperature during gas production. This depth is at the boundary of Units IV-1 and IV-2, where strong water influx was inferred, and the temperature drop in the monitoring hole may not have been caused by methane hydrate dissociation, but by supply of cool water. By taking into account the fact that AT1-MT1 well was located in the up-dip direction of AT1-P, a possible explanation is that the origin of the cooler fluid can be formation fluid of shallower level in the up-dip direction, and the sand production made a fluid pathway from the direction that crossed AT1-MT1.
These facts suggest that the strong water flow characteristics of the section might have damaged the functionality of the sand-control device (gravel pack) and led to the catastrophic sand event. Further investigations including experimental and modelling works to identify the cause and processes of the sand production are underway.
Conclusions
From the methane hydrate concentrated zone in the Daini Atsumi Knoll, 119![[thin space (1/6-em)]](https://www.rsc.org/images/entities/char_2009.gif) 500 S m3 gas was produced along with 1250 m3 of water during 143 hours of flow by approximately 9 MPa of pressure reduction in a borehole. During the flow, sensors installed in the production and monitoring boreholes measured temperature reductions. A combination of the longer-term and distributed sensing by DTS and higher resolution RTD in three boreholes worked quite well to obtain the comprehensive view of the temporal and spatial domain of the thermal responses.
500 S m3 gas was produced along with 1250 m3 of water during 143 hours of flow by approximately 9 MPa of pressure reduction in a borehole. During the flow, sensors installed in the production and monitoring boreholes measured temperature reductions. A combination of the longer-term and distributed sensing by DTS and higher resolution RTD in three boreholes worked quite well to obtain the comprehensive view of the temporal and spatial domain of the thermal responses.
The temperature profile observed in the production hole should reflect the thermal condition of the influx flow. By solving heat conservation equation under some assumptions about temperatures of gas and water, the fluid influx of each layer was evaluated and major gas and water production intervals were identified.
The nature of the temperature reduction in the observation hole is highly related to the geological and petro-physical conditions, particularly the formation permeability. It is reasonable to assume that a significant temperature drop occurred at a specific depth where the initial permeability was large.
At some depths, the measured temperature drop was not mainly caused by hydrate dissociation; displacement of pore water by the pump operation also caused a temperature change. From analysis of the temperature data of the AT1-MT1 and AT1-MC holes, the gas hydrate dissociation front could reach the monitoring boreholes at some specific intervals.
From integrating the data of three boreholes, the following interpretations are reasonable:
(1) Methane hydrate dissociation and gas production occurred in both Unit IV-1 (0–19 mBTMHCZ) and Unit IV-3 (30–38 mBTMHCZ), where gas hydrate saturation is high, but the dissociation in Unit IV-3 was concentrated in the vicinity of the production hole, and did not notably affect the monitoring holes.
(2) Water was mainly produced from some specific low hydrate saturation sand and silt layers between Unit IV-1 and IV-2 (approximately 20 mBTMHCZ).
(3) The temperature drop that began just after the pump operation started (05:00 JST on March 12, 2013) at 20 mBTMHCZ of the AT1-MT1 hole was not caused by hydrate dissociation but by supply of relatively cool fluid (approximately 0.1 K) from the adjacent region, probably from the up-dip direction.
(4) The water production interval coincides with the layers of sand-production-related phenomena, so the event was highly related to the strong water flow. Further engineering studies are necessary to understand the process of the phenomenon.
(5) According to the modelling study, the temperature drop can be explained only by adiabatic heat supply from sensible heat. Heat conduction/advection effects make relatively small contributions to methane hydrate dissociation.
(6) By comparing model results and actual measurements, the initial permeability of the gas-producing layers is in the range in 3–10 mD. These values are intermediate between those derived from NMR logging derived and the formation dynamics test tool, and similar to the value derived from pressure core.
(7) Temperature recovery was observed in each layer after gas hydrate dissociation. The temperature in the gas-production zone at the monitoring hole location did not return to the original state until 4 months after the production test.
(8) In the case of depth 18 mBTMHCZ, the early stage of heat recovery was mainly caused by heat advection with flow of warmer formation fluid.
(9) The later stage of temperature recovery including 18 mBTMHCZ was dominated by conduction of heat and was a relatively slow process.
Moreover, temperature changes related to a sand-production event were observed in both the production and monitoring boreholes. The data suggested that significant fluid mass motion occurred in a limited interval (approximately 20 mBTMHCZ). The sand- and water-producing interval coincides with the water-producing low-hydrate-saturation silt and sand layers between Unit IV-1 and Unit IV-2. The event affected the thermal condition of the AT1-MT1 borehole, which was located 20 m away from the AT1-P hole. The identified water producing interval that affected gas and water production behavior, and possibly caused sand production event is an important finding that had not been expected before the test. Such hydraulically heterogeneous character of the formation can disturb continuous and sustainable gas production. Therefore, identification of such heterogeneous feature from geophysical survey data should be important for site characterization.
The temperature measurement results suggested that the necessary heat to produce the observed gas rate (20![[thin space (1/6-em)]](https://www.rsc.org/images/entities/char_2009.gif) 000 m3 per day) is achievable under adiabatic conditions and with little heat supply from adjacent heat sources. On the other hand, the temperature recovery is markedly slower than the temperature drop process, so heat support from formations outside of the reservoir is not expected at least for this short-duration phenomenon.
000 m3 per day) is achievable under adiabatic conditions and with little heat supply from adjacent heat sources. On the other hand, the temperature recovery is markedly slower than the temperature drop process, so heat support from formations outside of the reservoir is not expected at least for this short-duration phenomenon.
In this study, relatively simple models with minimum assumptions were applied to avoid model-dependent complexity. In the real field, the processes are expected to be more complex and dynamic; for example, formation permeabilities that are assumed to be constant in this study will be altered by hydrate dissociation. Moreover, reservoir characters are heterogeneous and not continuous. Rigorous numerical studies are necessary for quantification of formation characters through the temperature data. The MH21 research team will continue to work on the next step of data analysis using the compositional numerical simulation model MH21-HYDRES19,20 to allow more quantitative analysis considering dynamic reservoir condition changes.
After the success of the 2013 gas-production attempt, the Japanese Government and the MH21 consortium decided to conduct a second test in the same area in early 2017. For the next test, two different types of sand control will be installed in two production holes. Monitoring boreholes will be drilled to obtain temperature data, and measurement of pressure data in the holes will be attempted. Moreover, in the production hole, an array-type pressure sensors as well as temperature sensors will be applied to the production zone to obtain data on the pressure profile in the hole, which can give information of fluid density and gas fraction in the fluid; therefore, the number of unknown variables can be reduced. Moreover, temperature measurement in the production hole will be continued after the test to obtain data on temperature recovery at the location of depressurization.
It should be noted that disturbance of reservoir characteristics caused by drilling and gravel pack operation may affect measured temperature data through creation of fractures. In subsequent testing, such interference should be minimized to obtain clear data.
The data obtained in the present study suggest that continuous dissociation of methane hydrate by latent heat of the formation itself is sustainable, but wellbore and formation conditions should be kept sound to prevent sand production and water breakthrough.
Acknowledgements
The data presented were obtained with efforts of D/V Chikyu drilling and navigation crews, staffs of Japan Petroleum Exploration Co., Ltd. (JAPEX), Japan Drilling Company (JDC), Mantle Quest Japan Company Ltd. (MQJ), Marine Works Japan Ltd. (MWJ) and all other operation and data acquisition activity members. In particular, the authors would like to appreciate the contribution of Mr Akihiko Sato, Dr Tokujiro Takayama, Dr Yoshinori Sanada, Dr Kiyofumi Suzuki, Dr Yoshihiro Konno, Dr Jiro Nagao, Dr Jun Yoneda, Mr Makoto Seki, Mr Yoshihiro Terao, Mr Maki Matsuzawa, Mr Bill Hay, Mr Ian Ayling, Mr Mil Duncan, Ms Mika Takekoshi, Mr Shunsuke Sakurai, Mr Itoyuki Nishioka, and Dr Tatsuo Saeki for their support and suggestions. The study is a part of MH21 research consortium activities funded by the Agency for Natural Resources and Energy, the Ministry of Economy, Trade and Industry (METI).Notes and references
- C. D. Ruppel, Methane Hydrates and Contemporary Climate Change, Nature Education Knowledge, 2011, 3(10), 29 Search PubMed.
- United Nations Environment Programme, Frozen Heat, A Global Outlook on Methane Hydrates, vol. 2, 2015, http://www.methanegashydrates.org/, June 10, 2016 Search PubMed.
- M. Maslin, M. Owen, R. Betts, S. Day, T. Jones and A. Ridgwell, Gas hydrates: past and future geohazard?, Philos. Trans. R. Soc., A, 2010, 368, 2369–2393, DOI:10.1098/rsta.2010.0065.
- D. R. McConnell, Z. Zhang and R. Boswell, Review of progress in evaluating gas hydrate drilling hazards, Mar. Pet. Geol., 2012, 34, 209–223 CrossRef.
- R. Boswell and T. S. Collett, Current Perspectives on Gas Hydrate Resources, Energy Environ. Sci., 2011, 4, 1206–1215 CAS.
- R. Boswell, K. Yamamoto, S.-R. Lee, T. S. Collett, P. Kumar, and S. Dallimore, Chapter 8-Methane hydrates, in Future Energy, Second Edition: Improved, Sustainable and Clean Options for our Planet, ed. M. Letcher, Elsevier, London, UK, 2014, vol. 225, pp. 159–178 Search PubMed.
- E. D. Sloan Jr and C. Koh, Clathrate Hydrates of Natural Gases, CRC Press, 3rd edn, 2007 Search PubMed.
- C. Ruppel, T. Collett, R. Boswell, T. Lorenson, B. Buczkowski and W. Waite, A new global gas hydrate drilling map based on reservoir type, Fire In The Ice, DOE-NETL, 2011, 11(1), 13–17 Search PubMed.
- A. H. Johnson, Global Resource Potential of Gas Hydrate – A New Calculation, Fire In The Ice, DOE-NETL, 2011, 11(2), 1–4 Search PubMed.
- M. Frye, Compiler, Preliminary evaluation of in-place gas hydrate resources: Gulf of Mexico Outer Continental Shelf, OCS Report MMS 2008-004, Minerals Management Service, Resource Evaluation Division, 2008 Search PubMed.
- T. S. Collett, W. F. Agena, M. W. Lee, M. V. Zyrianova, K. J. Bird, T. C. Charpentier, D. W. Houseknect, T. R. Klett, R. M. Pollastro, and R. M. Schenk, Assessment of gas hydrate resources on the North Slope, U.S. Geological Survey Fact Sheet, 2008-3073, Alaska, 2008, p. 4 Search PubMed.
- T. Fujii, T. Saeki, T. Kobayashi, T. Inamori, M. Hayashi and O. Takano, Resource Assessment of Methane Hydrate in the Eastern Nankai Trough, Eos Trans. AGU, Japan, 2007, 88(52), Fall Meet. Suppl. Abstract OS12A-02 Search PubMed.
- Iu. F. Makogon and Y. F. Makogon, Hydrates of Hydrocarbons, Pennwell Corp, 1997 Search PubMed.
- Research Consortium for Methane Hydrate Resources in Japan (MH21), Japan's Methane Hydrate R&D Program, Phase 1 Comprehensive Report of Research Results, 2009, http://www.mh21japan.gr.jp/english/wp/wp-content/uploads/ca434ff85adf34a4022f54b2503d86e92.pdf, 2016 Search PubMed.
- Society of Petroleum Engineers (SPE), American Association of Petroleum Geologists (AAPG), World Petroleum Council (WPC) and Society of Petroleum Evaluation Engineers (SPEE), Petroleum Resources Management System, 2007, http://www.spe.org/industry/docs/Petroleum_Resources_Management_System_2007.pdf, 2016 Search PubMed.
- G. D. Holder and P. Fp. Angert, Simulation of gas production from a reservoir containing both gas hydrates and free natural gas, SPE Annual Technical Conference and Exhibition, 26–29 September, New Orleans, LA, 1982 Search PubMed.
- M. H. Yousif, H. H. Abass, M. S. Selim and E. D. Sloan, Experimental and theoretical investigation of methane-gas-hydrate dissociation in porous media, SPE Reservoir Eval. Eng., 1991, 6, 69–76 CrossRef CAS.
- G. J. Moridis, and T. S. Collett, Strategies for gas production from hydrate accumulation under various geological conditions, Report LBNL-52568, Lawrence Berkeley National Laboratory, Berkeley, C.A., USA, 2003 Search PubMed.
- M. Kurihara, H. Ouchi, Y. Masuda, H. Narita and Y. Okada, Assessment of gas productivity of natural methane hydrates using MH21 Reservoir Simulator, Proceedings of the AAPG Hedberg Conference, Vancouver, B.C., Canada, September 12–16, 2004 Search PubMed.
- Y. Masuda, Y. Konno, M. Kurihara, H. Ouchi, Y. Kamata, T. Ebinuma, and H. Narita, Validation study of numerical simulator predicting gas production performance from sediments containing methane hydrate, Proceedings of the 5th International Conference on Gas Hydrate, Trondheim, Norway, 13–16 June, 2005, vol. 3, (Paper ref. 3056), pp. 1076–1085 Search PubMed.
- G. J. Moridis, M. B. Kowalsky and K. Pruess, Depressurization-induced gas production from class-1 hydrate deposits, SPE Reservoir Eval. Eng., 2007, 10, 458–481 CrossRef CAS.
- M. Kurihara, M. Sato, H. Ouchi, H. Narita, Y. Masuda, T. Saeki and T. Fujii, Prediction of gas productivity from Eastern Nankai Trough methane-hydrate reservoirs, SPE Reservoir Eval. Eng., 2009, 12, 477–499 CrossRef CAS , SPE125481.
- M. Kurihara, H. Ouchi, H. Narita and Y. Masuda, Gas production from methane hydrate reservoirs, Proceedings of the 7th International Conference on Gas Hydrates (ICGH 2011), Edinburgh, Scotland, United Kingdom, July 17–21, 2011 Search PubMed.
- K. Yamamoto, Production techniques for methane hydrate resources and field test programs, Chigaku Zasshi, 2009, 118(5), 913–934 CrossRef CAS , in Japanese.
- S. H. Hancock, S. R. Dallimore, T. S. Collett, D. Carle, B. Weatherill, T. Satoh, and T. Inoue, Overview of pressure-drawdown production test results for the JAPEX/JNOC/GSC et al. Mallik 5L- 38 gas hydrate production research well. in Scientific Results from the Mallik 2002 Gas Hydrate Production Well Program, ed. S. R. Dallimore and T. S. Collett, Mackenzie Delta, Northwest Territories, Canada, Geological Survey of Canada Bulletin 585, 2005, p. 134 Search PubMed.
- S. R. Dallimore, and T. S. Collett, Summary and implications of the Mallik 2002 gas hydrate production research well program, in Scientific Results from the Mallik 2002 Gas Hydrate Production Well Program, ed. S. R. Dallimore and T. S. Collett, Mackenzie Delta, Northwest Territories, Canada, Geological Survey of Canada Bulletin 585, 2005, pp. 1–36 Search PubMed.
- M. Kurihara, K. Funatsu, K. Kusaka, M. Yasuda, S. R. Dallimore, T. S. Collet, and S. H. Hancock, Well-test analysis for gas hydrate reservoirs: Examination of parameters suggested by conventional analysis for the JAPEX/JNOC/GSC et al. Mallik 5L-38 gas hydrate production research well, in Scientific Results from the Mallik 2002 Gas Hydrate Production Well Program, ed. S. R. Dallimore and T. S. Collett, Mackenzie Deta, Northwest Territories, Canada, Geological Survey of Canada Bulletin 585, 2005, p. 137 Search PubMed.
- H. Hong and M. Pooladi-Darvish, Numerical study of constant-rate gas production from in situ gas hydrate by depressurization, in Scientific Results from the Mallik 2002 Gas Hydrate Production Well Program, ed. S. R. Dallimore and T. S. Collett, Mackenzie Deta, Northwest Territories, Canada, Geological Survey of Canada Bulletin 585, 2005, p. 138 Search PubMed.
- D. I. Ashford, M. Numasawa, C. K. Martin, K. Yamamoto, S. R. Dallimore, J. F. Wright, F. M. Nixon, A. Applejohn, and A. E. Taylor, Overview of engineering and operations activities conducted as part of the JOGMEC/NRCan/Aurora Mallik 2007-2008 Gas Hydrate Production Research Well Program, Part A: 2007 field program, in Scientific results from the JOGMEC/NRCan/Aurora Mallik 2007-2008 gas hydrate production research well program, ed. S. R. Dallimore, K. Yamamoto, J. F. Wright and G. Bellefleur, Geological Survey of Canada Bulletin 601, Mackenzie Delta, Northwest Territories, Canada, 2012, pp. 35–51 Search PubMed.
- D. I. Ashford, M. Numasawa, C. K. Martin, K. Yamamoto, S. R. Dallimore, J. F. Wright, F. M. Nixon, A. Applejohn, and A. E. Taylor, Overview of engineering and operations activities conducted as part of the JOGMEC/NRCan/Aurora Mallik 2007-2008 Gas Hydrate Production Research Well Program, Part B: 2008 field program, in Scientific results from the JOGMEC/NRCan/Aurora Mallik 2007-2008 gas hydrate production research well program, ed. S. R. Dallimore, K. Yamamoto, J. F. Wright and G. Bellefleur, Mackenzie Delta, Northwest Territories, Canada, Geological Survey of Canada Bulletin 601, 2012, pp. 53–65 Search PubMed.
- S. R. Dallimore, J. F. Wright, F. M. Nixon, M. Kurihara, K. Yamamoto, T. Fujii, K. Fujii, M. Numasawa, M. Yasuda and Y. Imasato, Geological and thermodynamic factors affecting the stimulation-response characteristics of a production test interval, Mallik 2007 gas hydrate production research well, Proceedings of the 6th International Conference on Gas Hydrates, Vancouver, B.C., Canada, July 6–10, 2008 Search PubMed.
- S. R. Dallimore, J. F. Wright, K. Yamamoto and G. Bellefleur, Proof of concept for gas hydrate production using the depressurization technique, as established by the JOGMEC/NRCan/Aurora Mallik 2007-2008 Gas Hydrate Production Research Well Program, in Scientific results from the JOGMEC/NRCan/Aurora Mallik 2007-2008 gas hydrate production research well program, ed. S. R. Dallimore, K. Yamamoto, J. F. Wright and G. Bellefleur, Mackenzie Delta, Northwest Territories, Canada, Geological Survey of Canada Bulletin 601, 2012, pp. 1–15 Search PubMed.
- M. Kurihara, K. Funatsu, H. Ouchi, A. Sato, M. Yasuda, K. Yamamoto, T. Fujii, M. Numasawa, H. Narita, Y. Masuda, S. R. Dallimore, and J. F. Wright, Analysis of the JOGMEC/NRCan/Aurora Mallik gas hydrate production test through numerical simulation, Proceedings of the 6th International Conference on Gas Hydrates, Vancouver, B.C., Canada, June 6–10, 2008 Search PubMed.
- Research Consortium for Methane Hydrate Resources in Japan (MH21), Implementation Plan for Phase 2, 2009, http://www.mh21japan.gr.jp/english/wp/wp-content/uploads/c78678339b1ca272c59cb2b006dd244a1.pdf, 2016 Search PubMed.
- K. Yamamoto, Y. Terao, T. Fujii, T. Ikawa, M. Seki, M. Matsuzawa and T. Kanno, Operational overview of the first offshore production test of methane hydrates in the eastern Nankai Trough, 2014 Offshore Technology Conference, Houston, Texas, USA, 5–8 May, 2014 Search PubMed.
- M. Matsuzawa, Y. Terao, B. Hay, L. Wingstrom, M. Duncan and I. Ayling, A Completion System Application for the World's First Marine Hydrate Production Test, 2014 Offshore Technology Conference, Houston, Texas, 05–08 May, 2014 Search PubMed.
- Y. Terao, K. Lay and K. Yamamoto, Design of the surface flow system for 1st offshore production test of methane hydrate, Offshore Technology Conference Asia, Kuala Lumpur, Malaysia, 25–28, March, 2014 Search PubMed.
- J. Henninges, J. Schrötter, K. Erbas and E. Huenges, Temperature field of the Mallik gas hydrate occurrence – implementation on phase changes and thermal properties, in Scientific Results from the Mallik 2002 Gas Hydrate Production Well Program, ed. S. R. Dallimore and T. S. Collett, Mackenzie Deta, Northwest Territories, Canada, Geological Survey of Canada Bulletin 585, 2005, p. 128 Search PubMed.
- S. H. Hancock, T. S. Collett, S. R. Dallimore, T. Satoh, T. Inoue, E. Huenges, and B. Weatherill, Overview of thermal stimulation production-test results for the JAPEX/JNOC/GSC et al. Mallik 5L-38 gas hydrate production research well, in Scientific Results from the Mallik 2002 Gas Hydrate Production Well Program, ed. S. R. Dallimore and T. S. Collett, Mackenzie Delta, Northwest Territories, Canada, Geological Survey of Canada Bulletin 585, 2005, p. 135 Search PubMed.
- Y. Tsuji, and Y. Nonaka, Multi-well drilling campaign METI “Tokai-oki To Kumano-nada” in 2004 for methane hydrate evaluation in the Nankai Trough area, off Central Japan, Proc. AAPG Hedberg Conference, Vancouver, B.C., Canada, September 12–16, 2004 Search PubMed.
- H. Takahashi and Y. Tsuji, Multi-well exploration program in 2004 for natural hydrate in the Nankai-Trough, offshore Japan, in Proceedings of 2005 Offshore Technology Conference, Houston, Texas, 02–05 May, 2005 Search PubMed.
- M. Fukuhara, V. Tertychnyi, K. Fujii, V. Shako, V. Pimenov, Y. Popov, D. Murray, and T. Fujii, Temperature monitoring results for methane-hydrate sediments in the Nankai Trough, Japan, in Natural gas hydrates—Energy resource potential and associated geologic hazards: AAPG Memoir 89, ed. T. Collett, A. Johnson, C. Knapp and R. Boswell, 2009, pp. 414–432 Search PubMed.
- K. Fujii, B. Cho, T. Ikegami, H. Sugiyama, Y. Imasato, S. R. Dallimore, and M. Yasuda, Development of a monitoring system for the JOGMEC/NRCan/Aurora Mallik Gas Hydrate Production Test Program, Proc. 6th Int. Conf. on Gas Hydrates, Vancouver, B.C., Canada, July 6–10, 2008 Search PubMed.
- K. Fujii, N. Sakiyama, Y. Morikami, T. Ikegami, V. Pimenov, V. Shako, A. Parshin, N. Inada, Y. Nakatsuka, J. F. Wright, and S. R. Dallimore, Down-hole–monitoring data analysis and interpretation for the JOGMEC/NRCan/Aurora Mallik Gas Hydrate Production Research Well Program, in Scientific results from the JOGMEC/NRCan/Aurora Mallik 2007–2008 Gas Hydrate Production Research Well Program, ed. S. R. Dallimore, K. Yamamoto, J. F. Wright and G. Bellefleur, Geological Survey of Canada, Bulletin 601, 2012, pp. 91–105 Search PubMed.
- D. Schoderbek, H. Farrell, K. Hester, J. Howard, K. Raterman, S. Silpngarmlert, K. L. Martin, B. Smith, and P. Klein, ConocoPhillips Gas Hydrate Production Test Final Technical Report, October 1, 2008–June 30, 2013, DOE Award No.: DE-NT0006553 Search PubMed.
- J. Ashi, K. Aoike, Y. Nakamura, S. Saito, S. Kuramoto, M. Kinoshita, S. Morita, U. Tsunogai, S. Kojima and P. Henry, Geological Structure and Cold Seep at the Daini-Atsumi Knoll off Enshu-Nada, JAMSTEC Jounral of Deep Sea Research (Shinkai Kenkyu), 2004, 24, 1–11 Search PubMed , in Japanese.
- M. Matsuzawa, S. Umezu and K. Yamamoto, Evaluation of Experiment program 2004: Natural hydrate exploration campaign in Nankai Trough offshore Japan, 2006 IADC/SPE Drilling Conference, Miami Beach, FL, 21–23 February 2006, IADC/SPE 98960 Search PubMed.
- Y. Tsuji, H. Ishida, M. Nakamizu, R. Matsumoto, S. Shimizu, Overview of the methane hydrate research well METI “Nankai Trough” as a mile-stone in the evaluation of hydrate resource potential, Spec. Issue of Resour. Geol., 54(1), 3–10 Search PubMed.
- Y. Tsuji, T. Namikawa, T. Fujii, M. Hayashi, R. Kitamura, M. Nakamizu, K. Ohbi, T. Saeki, K. Yamamoto, T. Inamori, N. Oikawa, S. Shimizu, M. Kawasaki, S. Nagakubo, J. Matsushima, K. Ochiai, and T. Okui, Methane-hydrate occurrence and distribution in the eastern Nankai Trough, Japan: Findings of the Tokai-oki to Kumano-nada methane-hydrate drilling program, in Natural gas hydrates-Energy resource potential and associated geologic hazards: AAPG Memoir 89, ed. T. Collett, A. Johnson, C. Knapp, and R. Boswell, 2009, pp. 228–246 Search PubMed.
- T. Saeki, T. Fujii, T. Inamori, T. Kobayashi, M. Hayashi, S. Nagakubo and O. Takano, Extraction of Methane Hydrate Concentrated Zone for Resource Assessment in the Eastern Nankai Trough, Japan, 2008 Offshore Technology Conference, 5–8 May, Houston, Texas, USA, 5–8 May, 2008 Search PubMed.
- T. Fujii, T. Saeki, T. Kobayashi, T. Inamori, M. Hayashi, O. Takano, T. Takayama, T. Kawasaki, S. Nagakubo, M. Nakamizu and K. Yokoi, Resource assessment of methane hydrate in the Eastern Nankai Trough, 2008 Japan, Offshore Technology Conference, Houston, Texas, 5–8 May, 2008 Search PubMed.
- T. Fujii, K. Suzuki, T. Takayama, M. Tamaki, Y. Komatsu, Y. Konno, J. Yoneda, K. Yamamoto and J. Nagao, Geological setting and characterization of a methane hydrate reservoir distributed at the first offshore production test site on the Daini-Atsumi Knoll in the eastern Nankai Trough, Japan, Mar. Pet. Geol., 2015, 66(2), 310–322 CrossRef CAS.
- K. Yamamoto, M. Seki and T. Ikawa, Well planning for the methane hydrate first offshore production test, J. Jpn. Assoc. Pet. Technol., 2012, 77(5), 349–357 CrossRef CAS.
- K. Yamamoto, Overview and introduction: Pressure core-sampling and analyses in the 2012-2013 MH21 offshore test of gas production from methane hydrates in the eastern Nankai Trough, Mar. Pet. Geol., 2015, 66, 296–309 CrossRef.
- N. Inada and K. Yamamoto, Data report: Hybrid pressure coring system tool review and summary of recovery result of gas hydrate-related coring in the Nankai project, Mar. Pet. Geol., 2015, 66, 323–345 CrossRef.
- T. Fujii, S. Noguchi, T. Takayama, K. Suzuki, K. Yamamoto and T. Saeki, Site selection and formation evaluation at the 1st offshore methane hydrate production test site in the eastern Nankai Trough, Japan, in Proceedings of 75th EAGE Conference & Exhibition Incorporating SPE EUROPEC 2013 London, UK, 2013 Search PubMed.
- T. Ito, Y. Komatsu, T. Fujii, K. Suzuki, K. Egawa, Y. Nakatsuka, Y. Konno, J. Yoneda, Y. Jin, M. Kida, J. Nagao and H. Minagawa, Lithological features of hydrate-bearing sediments and their relationship with gas hydrate saturation in the eastern Nankai Trough, Japan, Mar. Pet. Geol., 2015, 66(2), 368–378 CrossRef.
- T. Komatsu, K. Suzuki and T. Fujii, Sedimentary facies and paleoenvironments of a gas-hydrate-bearing sediment core in the eastern Nankai Trough, Japan, Mar. Pet. Geol., 2015, 66(2), 358–367 CrossRef.
- K. Suzuki, P. Schultheiss, T. Ito, Y. Nakatsuka, K. Egawa and K. Yamamoto, Overview: Physical properties and sedimentological features of hydrate-bearing samples recovered from the first gas production test site on Daini-Atsumi knoll around Eastern Nankai Trough, Mar. Pet. Geol., 2015, 66(2), 346–357 CrossRef CAS.
- M. Kida, Y. Jin, M. Watanabe, Y. Konno, J. Yoneda, K. Egawa, T. Ito, Y. Nakatsuka, K. Suzuki, T. Fujii and J. Nagao, Chemical and crystallographic characterizations of natural gas hydrates recovered from a production test site in the Eastern Nankai Trough, Mar. Pet. Geol., 2015, 66(2), 396–403 CrossRef CAS.
- Y. Konno, J. Yoneda, K. Egawa, T. Ito, Y. Jin, M. Kida, K. Suzuki, T. Fujii and J. Nagao, Permeability of sediment cores from methane hydrate deposit in the Eastern Nankai Trough, Mar. Pet. Geol., 2015, 66(2), 487–495 CrossRef CAS.
- J. Yoneda, A. Masui, Y. Konno, Y. Jin, K. Egawa, M. Kida, T. Ito, J. Nagao and N. Tenma, Mechanical properties of hydrate-bearing turbidite reservoir in the first gas production test site of the Eastern Nankai Trough, Mar. Pet. Geol., 2015, 66(2), 471–486 CrossRef.
- J. A. Priest, M. Druce, J. Roberts, P. Schultheiss, Y. Nakatsuka and K. Suzuki, PCATS Triaxial: A new geotechnical apparatus for characterizing pressure cores from the Nankai Trough, Japan, Mar. Pet. Geol., 2015, 66(2), 310–322 Search PubMed.
- J. C. Santamarina, S. Dai, M. Terzariol, J. Jang, W. F. Waite, W. J. Winters, J. Nagao, J. Yoneda, Y. Konno, T. Fujii and K. Suzuki, Hydro-Bio-Geomechanical properties of hydrate bearing sediments from Nankai Trough, Mar. Pet. Geol., 2015, 66(2), 434–450 CrossRef.
- G. E. Archie, The electrical resistivity log as an aid in determining some reservoir characteristics, Transaction of American Institute of Mining, Metallurgical, and Petroleum Engineers (AIME), 1942, 146, 54–62 Search PubMed.
- D. Murray, M. Fukuhara, O. Osawa, T. Endo, R. Kleinberg, B. Sinha and T. Namikawa, Characterizing gas hydrate reservoirs, 2006, E&P, August 2006 Search PubMed.
- R. Freedman, C. C. Minh, G. Gubelin, J. J. Freeman, T. McGuiness, B. Terry and D. Rawlence, Combining NMR and density logs for petrophysical analysis in gas-bearing formations, in Paper II, Presented at 39th SPWLA Symposium, 1998 Search PubMed.
- K. Akihisa, K. Tezuka, O. Senoh and T. Uchida, Well log evaluation of gas hydrate saturation in the MITI-Nankai-Trough well, offshore south-east Japan, in SPWLA 43rd Annual Logging Symposium, Paper BB, Oiso, Japan, 2002 Search PubMed.
- D. Murray, M. Fukuhara. C.-K. Khong, T. Namikawa and K. Yamamoto, Permeability estimates in gas hydrate reservoirs of the Nankai Trough, 2006, SPWLA 47th Annual Logging Symposium, Veracruz, Mexico, June 4–7, 2006 Search PubMed.
- T. Kanno, M. Takekoshi, X.-X. Wang, S. Chee, M. Fukuhara, O. Osawa, K. Yamamoto, T. Fujii, T. Takayama and K. Suzuki, In situ Temperature Measurement of Gas Hydrate Dissociation during the World-First Offshore Production Test, 2014 Offshore Technology Conference, Houston, Texas, USA, 5–8 May 2014, OTC-25235-MS Search PubMed.
- G. Williams, G. Brown, W. Hawthorne, A. Hartog and P. Waiter, Distributed temperature sensing (DTS) to characterize the performance of producing oil wells, Proc. SPIE, 2000, 4202, 39–54 CrossRef.
- G. Brown, Downhole temperatures form optical fiber, Oilfield Rev., 2008, 34–49 Search PubMed , Winter 2008/2009.
- S. MacKay, J. Lovell, D. Patel, F. Cens and S. Escanero, Completion Design for Sandface Monitoring in Subsea Wells, SPE Drill. Completion, 2010, 25(2), 194–198 Search PubMed.
- H. S. Gambhir, A. Shrivastav, J. Lovell, S. MacKay, C. Chouzenoux, B. Juchereau, F. Arachman and A. Chaudhary, Sensor Architecture for Open Hole Gravel Pack Completions, Proceedings of the SPE Annual Technical Conference and Exhibition, Denver, CO, USA, Sept 21–24, 2008, SPE-116476 Search PubMed.
- G. A. Brown and A. Hartog, Optical Fiber Sensors in Upstream Oil & Gas, J. Pet. Technol., 2002, 54(11), 63–65 CrossRef.
- X.-X. Wang, M. Takekoshi, T. Kanno, V. Shako, V. Pimenov, A. Parshin, and K. Yamamoto, Numerical simulation on the impact of temperature behaviour for cement hydration for the world's first offshore methane hydrate production test, 2014 Offshore Technology Conference, Houston, Texas, USA, 5–8 May 2014, OTC-25326-MS Search PubMed.
- X.-X. Wang, M. Takekoshi, T. Kanno, V. Pimenov, V. Shako, A. Parshin, and K. Yamamoto, Interpretation of the temperature data in monitoring wells on cement hydration for the offshore methane hydrate production test, CSMH-5, AIST Tokyo Waterfront, Japan, December 2013, p. A-19 Search PubMed.
- T. Kanno, M. Fukuhara, O. Osawa, S. Chee, M. Takekoshi, X.-X. Wang, V. Shako, V. Pimenov, T. Fujii, and K. Yamamoto, Estimation of geothermal gradient in marine gas-hydrate-bearing formation in the Eastern Nankai Trough, Proceedings of he 8th International Conference on Gas Hydrates ICGH8–2014, Beijing, China, July 28–August 1 2014 Search PubMed.
- Y. Terao, M. Duncan, B. Hay and L. Dang, Deepwater methane hydrate gravel packing completion results and challenges, 2014 Offshore Technology Conference, Houston, Texas, USA, May 5–8 2014, OTC-25330-MS Search PubMed.
- X.-W. Wang, 2010, System and method for modeling fluid flow profiles in a wellbore, US Pat. WO2010036599 A2, https://www.google.com/patents/WO2010036599A2?cl=en, 12 August 2015.
- S. Dong, Methods for Constrained Optimization, http://www.fd.cvut.cz/personal/nagyivan/erasmus/constrainedoptimization.pdf, 12, August 2015 Search PubMed.
- J. A. Snyman, Practical Mathematical Optimization, An introduction to Basic Optimization Theory and Classic and New Gradient-Based Algorithms, Chapter 3.1 Penalty function methods for constrained minimization, Springer Science and Business Media, Inc., NY 2005, pp. 57–59 Search PubMed.
- M. H. Yousif, H. H. Abass, M. S. Selim and E. D. Sloan, Experimental and theoretical investigation of methane-gas-hydrate dissociation in porous media, SPE Reservoir Eval. Eng., 1991, 6, 69–76 CrossRef CAS.
- A. T. Corey, The interrelation between gas and oil relative permeabilities, Prod. Mon., 1954, 38–41 Search PubMed.
- R. H. Brooks and A. T. Corey, Hydraulic Properties of Porous Media, Hydrology Papers, No. 3, Colorado State U., Fort Collins, Colorado, 1964 Search PubMed.
- H. C. Kim, P. R. Bishnoi, R. A. Heidemann and S. S. H. Rizvi, Kinetics of methane hydrate decomposition, Chem. Eng. Sci., 1987, 42, 1645–1653 CrossRef CAS.
- Y. Konno, H. Oyama, J. Nagao, Y. Masuda and M. Kurihara, Numerical analysis of the dissociation experiment of naturally occurring gas hydrate in sediment cores obtained at the Eastern Nankai trough, Japan, Energy Fuels, 2010, 24, 6353–6358 CrossRef CAS.
Footnotes |
| † Currently Schlumberger K. K. |
| ‡ Mark of Schlumberger. |
| This journal is © The Royal Society of Chemistry 2017 |

