 Open Access Article
Creative Commons Attribution 3.0 Unported Licence
Enhanced p-cresol photodegradation over BiOBr/Bi2O3 in the presence of rhodamine B†
Aijuan Hanab,
Jiulong Sunab,
Gaik Khuan Chuah*a and
Stephan Jaenicke*a
aDepartment of Chemistry, National University of Singapore, 3 Science Drive 3, Singapore 117543, Singapore. E-mail: chmcgk@nus.edu.sg; chmsj@nus.edu.sg; Fax: +65 6779 1691; Tel: +65 6516 2839 Tel: +65 6516 2918
bNUS Environmental Research Institute, National University of Singapore, 5A Engineering Drive 1, #02-01, Singapore 117411, Singapore
First published on 22nd December 2016
Abstract
Bismuth oxide is a visible-light activated photocatalyst that is adversely affected by a high rate of electron–hole recombination. To mitigate this, BiOBr/Bi2O3 composites were synthesized where BiOBr formed submicron thick platelets at the surface of the Bi2O3 particles. XRD measurements show the preferential formation of a (110)-facetted BiOBr overlayer which can be attributed to the commensurate structure of this plane with the (120) plane of Bi2O3. The photodegradation of p-cresol and RhB was studied as representative of an organic pollutant and a dye, respectively. The composite with 85% BiOBr/Bi2O3 exhibited the highest photoactivity for both molecules. Its higher activity compared to that of either Bi2O3 or BiOBr alone, or a mechanical mixture with the same composition, supports the hypothesis that the formation of an hetero-epitactic interface between BiOBr and Bi2O3 is instrumental in reducing electron–hole pair recombination. Interestingly, in mixtures of p-cresol and RhB, the rate of p-cresol photodegradation was enhanced but that for RhB was decreased compared to the pure solutions. This is not caused by competitive adsorption of the molecules but rather by excitation transfer from RhB to the co-adsorbed p-cresol. Therefore, the RhB degradation by deethylation, which is a surface reaction, is suppressed and only the reaction channel through attack of the OH· radical at the aromatic chromophore remains open.
1. Introduction
Water pollution is a pressing issue worldwide. Developing cheap and efficient ways to degrade pollutants has become the center point of much research.1 Semiconductor photocatalysis can be conveniently applied for the degradation of organic pollutants in water. Among various semiconductors, TiO2 has been most extensively used due to its photoactivity, insolubility, stability, low cost and non-toxic nature.2,3 Unfortunately, TiO2 has a wide band gap of 3.0–3.2 eV and is therefore not well matched to the solar spectrum. Only a small fraction (ca. 4%) of the incoming solar energy lies in the ultraviolet region, whereas visible light (400–700 nm) is far more abundant (ca. 46%). Hence, the research focus has shifted to the development of photocatalysts that can be activated by visible light.Several bismuth compounds have been reported to be visible light active photocatalysts, such as bismuth oxyhalides,4–8 NaBiO3,9–12 BiVO4,13–16 etc. It is interesting that despite being a heavy metal, bismuth is generally considered to be safe, as it is non-toxic and noncarcinogenic.17 In fact, bismuth salts are widely used in pharmaceutical products as antacids and in the treatment of peptic ulcers. Besides the ternary compounds, mixtures and composites such as NaBiO3/BiOCl,18 BiOI/BiOCl,19,20 BiOCl/BiOBr21–25 and Bi/BiOBr26 have been investigated for their photoactivity.
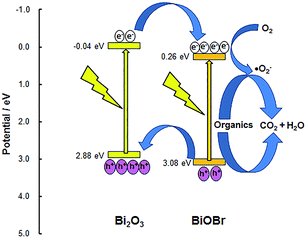
Bismuth oxide (Bi2O3) has a narrow band gap of ∼2.8 eV and has been used as a visible-light active photocatalyst for the degradation of organic pollutants, water splitting and organocatalysis.27–31 However, its photoactivity is hampered by fast electron–hole pair recombination. To facilitate the separation of the photo-generated electrons and holes, Bi2O3 has been coupled with other semiconductors in systems such as BiOCl/Bi2O3,32 BiOI/Bi2O3,33 Bi2O3/Co3O4,34 Bi2O3-reduced graphene oxide,35 Bi2O3/TiO2,36,37 or Bi2O3/Bi2O4−x.38 These examples motivated us to examine Bi2O3 more closely as a photocatalyst. We chose to investigate composite systems of BiOBr and Bi2O3, both of which absorb visible light as their band gaps are in the range of 2.8–2.9 eV. Wang et al. recently reported a similar system but their BiOBr/Bi2O3 composites were only 2.06 and 1.83 times more active for photodegradation of methyl orange than Bi2O3 and BiOBr, respectively.39 To achieve a high degree of cohesion at the interfaces within the composite, solid Bi2O3 was chemically converted to BiOBr by etching with varying amounts of HBr. Electronic structures were calculated using Density Functional Theory as implemented in the CASTEP code of the Materials Studio software (Fig. S1†). Bi2O3 has a direct band gap while BiOBr has an indirect band gap. The valence band of Bi2O3 is mainly due to oxygen 2p orbitals, whereas the valence band of BiOBr is mainly generated from bromine 4p (Fig. S2†). Hence, the valence band level of Bi2O3 is expected to be more negative than that of BiOBr. This is supported by the band edge positions of Bi2O3 and BiOBr as predicted using the Mulliken electronegativity of the individual atoms:40
| EVB = χ − Ee + (1/2)Eg |
Dyes are important water pollutants because they are resistant to biodegradation and direct photolysis. Natural reductive anaerobic degradation of many N-containing dyes such as rhodamine B is (RhB) incomplete and often generates potentially carcinogenic aromatic amines. However, the use of dyes to assess visible-light activated photocatalysts may not be appropriate due to dye sensitization. Hence, we used p-cresol as a model pollutant to assess the photoactivity of BiOBr/Bi2O3 with different compositions. Cresols are found in disinfectants, herbicides, wood preservatives and formulations for fragrances and dyes.41 For the purpose of benchmarking with other photocatalysts reported in the literature, the best photocatalyst was also tested using RhB.
2. Experimental
2.1 Sample preparation
The BiOBr/Bi2O3 heterojunctioned composites were prepared by reacting Bi2O3 with hydrobromic acid. After dispersing 1.398 g (3 mmol) of crystalline bismuth oxide (Sigma-Aldrich) in 14 ml of absolute ethanol, the required volume of 33% hydrobromic acid in glacial acetic acid (containing 1.5 to 6 mmol HBr) was added dropwise with stirring. The suspension was stirred for 1 h and the solid was recovered by centrifugation, washed with absolute ethanol and dried at 80 °C overnight in an oven. Pure BiOBr was prepared by etching Bi2O3 for 4 days in an excess (18 mmol) of hydrobromic acid/acetic acid solution.2.2 Characterization
Powder X-ray diffraction patterns were measured with a Siemens D5005 diffractometer using Cu Kα radiation for 2θ between 10 to 70° at 0.02° per step and a dwell time of 1 s per step. A calibration plot using the peak areas of the most intense reflexes, i.e., 2θ ∼ 27.5° for Bi2O3 and 31.7° for BiOBr, was made from known amounts of pure Bi2O3 and BiOBr. Based on this, the percentage of Bi2O3 and BiOBr in the composites was determined. Nitrogen adsorption and desorption isotherms were measured at −196 °C using a TriStar 3000 (Micromeritics) porosimeter. The specific surface area was calculated according to the BET (Brunauer–Emmett–Teller) model. Scanning electron micrographs were obtained with a JEOL JSM-6701F SEM (field-emission). Transmission electron microscopy was carried out using a JEOL 3010 transmission electron microscope operated at 200 kV. About 5 mg of finely ground sample was suspended in 5 ml of 2-propanol and after sonication, a drop of the suspension was placed onto a carbon-coated copper grid and dried at room temperature overnight. Diffuse reflectance spectra were measured with a Shimadzu UV-2450 UV-visible spectrophotometer.2.3 Photocatalytic activity
The photoactivity was measured using a 250 ml cylindrical quartz reactor at room temperature in air. Typically, a suspension of 0.10 g photocatalyst in 100 ml of an aqueous solution containing 24 ppm of p-cresol was magnetically stirred for 1 h to establish an adsorption–desorption equilibrium. The reactor was then irradiated by a 22 W daylight fluorescent lamp (KES). The photon flux had been determined with the potassium ferrioxalate actinometer system assuming a Fe3+ quantum yield of 1.11. To follow the photodegradation, aliquots were withdrawn at specific time intervals, centrifuged and the concentration of p-cresol determined from its absorption band at λ = 277.5 nm using a UV-vis spectrophotometer (Shimadzu UV1601) or by high performance liquid chromatography (Shimadzu UFLC 20A) with a mobile phase of acetonitrile and water (50![[thin space (1/6-em)]](https://www.rsc.org/images/entities/char_2009.gif) :
:![[thin space (1/6-em)]](https://www.rsc.org/images/entities/char_2009.gif) 50, v/v) at a flow rate of 1.0 ml min−1 and a Shim-pack VP-ODS C-18 reverse-phase column (250 mm l × 4.6 mm i.d., 5 μm). Besides p-cresol, RhB (20 ppm) and mixtures of RhB and p-cresol were similarly tested using the fluorescent, as well as blue, green and red LED lamps. The degradation efficiency (DE) was calculated as:
50, v/v) at a flow rate of 1.0 ml min−1 and a Shim-pack VP-ODS C-18 reverse-phase column (250 mm l × 4.6 mm i.d., 5 μm). Besides p-cresol, RhB (20 ppm) and mixtures of RhB and p-cresol were similarly tested using the fluorescent, as well as blue, green and red LED lamps. The degradation efficiency (DE) was calculated as:| DE = (C0 − C)/C0 × 100% |
3. Results and discussion
3.1 Characterization
The powder X-ray diffraction patterns of pure Bi2O3 and BiOBr agree well with those of monoclinic α-Bi2O3 (PDF 65-2366) and tetragonal BiOBr (PDF 73-2061), respectively (Fig. 2). For the BiOBr/Bi2O3 composites, no other phases except Bi2O3 and BiOBr were observed. By changing the molar ratio of HBr to Bi2O3 from 0.5 to 2 during the synthesis, the amount of BiOBr in the composite increased from 12 to 85 wt% (Fig. S3†). Pure BiOBr was obtained with HBr/Bi2O3 of 6.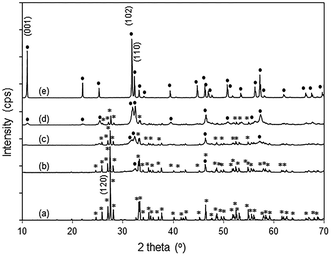 | ||
| Fig. 2 XRD patterns of (a) Bi2O3 (*), (b) 12% BiOBr/Bi2O3, (c) 57% BiOBr/Bi2O3, (d) 85% BiOBr/Bi2O3, and (e) BiOBr (●). | ||
In the XRD diffractogram of α-Bi2O3, the (120) reflex at 2θ ∼ 27.5° has the by far highest intensity, indicating the prevalence of this plane. With 12 wt% BiOBr in the composite, the (110) peak at 2θ ∼ 32.4° was the only BiOBr peak that could be observed. At higher BiOBr amounts in the composites, additional BiOBr peaks can be seen. In particular, the (102) peak at 2θ ∼ 31.7° grew to become the strongest peak for pure BiOBr. The dominance of (110)-facetted BiOBr at low HBr concentration may be attributed to commensurate atomic packing with the underlying Bi2O3. The (120) plane in Bi2O3 is made up of single zig-zagging rows of Bi separated by double rows of oxygen (Fig. 3a). For the (110) plane of BiOBr, single rows of Bi are separated by double rows of bromine with only a slight increase in the Bi–Bi distance from 8.11 Å in Bi2O3 to 8.13 Å in BiOBr. However, the (102) plane of BiOBr which formed at higher BiOBr content bears little similarity to the (120) plane of Bi2O3 (Fig. 3b).
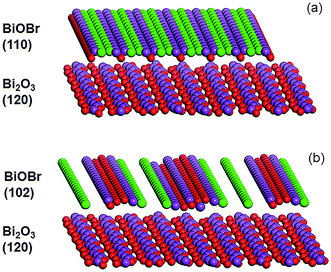 | ||
| Fig. 3 Illustration of the Bi2O3 (120) and BiOBr (a) (110) and (b) (102) planes (color code: red: O, purple: Bi, and green: Br). | ||
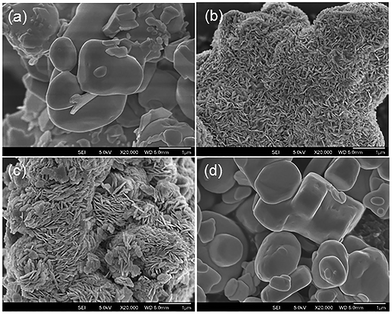
The commercial Bi2O3 has a low surface area of 2.30 m2 g−1 (Table 1). SEM micrographs of the material show irregular micro-sized particles (Fig. 4). After etching with HBr, the surface area of the composites increased to 3.00–7.99 m2 g−1. The increase in surface area of the BiOBr/Bi2O3 composites can be attributed to the formation of densely packed BiOBr platelets orientated in whorls perpendicular to the surface of the original Bi2O3 particles (Fig. 4). The thickness of these platelets grew with higher BiOBr content (from 15–20 nm to 60–100 nm). Due to the difference in the density of Bi2O3 (8.90 g cm−3) and BiOBr (6.70 g cm−3), the newly formed BiOBr occupies a larger volume than the Bi2O3 particles and contributes to the increased surface area. However, the pure BiOBr that formed after extensive contact of Bi2O3 with HBr had a very low surface area of only 0.67 m2 g−1. The sample comprised of plate-like particles with dimensions of 0.5–3 μm and 150–500 nm thickness.
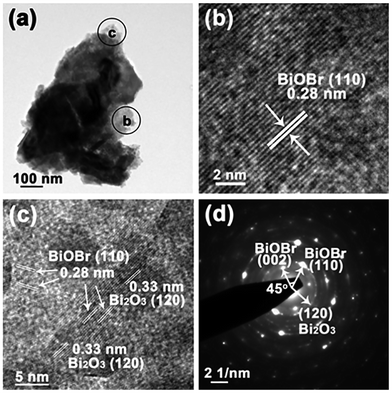
TEM was used to analyze the interface between the two phases in the composites. The micrograph of an 85% BiOBr/Bi2O3 sample clearly shows two different lattice spacings (Fig. 5). The lattice spacing of 0.28 nm corresponds to the (110) lattice plane of tetragonal BiOBr and is prevalent throughout the particle while the 0.33 nm lattice spacing can be assigned to the (120) lattice plane of Bi2O3. The latter only covers parts of the particle. The selective area electron diffraction (SAED) pattern shows spots which can be assigned to single crystalline BiOBr and diffraction rings that can be indexed to crystal planes of Bi2O3. Hence, these results lend support that Bi2O3 and BiOBr are well mixed at the nanoscale level, with BiOBr being the major component.
3.2 Optical properties
The optical absorption of a semiconductor near the band gap edge is given by the formula αhν = A(hν − Eg)η, where α = absorption coefficient, ν = light frequency, Eg = band-gap energy, A = constant and η = {1/2, 3/2, 2, 3}, for transitions that are direct-allowed, direct-forbidden, indirect-allowed and indirect-forbidden, respectively.42 The Kubelka–Munk function, F(R∞), for infinitely thick samples, is related to α by F(R∞) = (1 − R∞)2/2R∞ = α/S where R∞ is the reflectance of the sample divided by the reflectance of BaSO4 which is used as a reference, and S = scattering coefficient. As the scattering coefficient depends only weakly on energy, F(R∞) is proportional to α within the narrow energy range containing the absorption edge. By using the appropriate value for the exponent η, a plot of (F(R∞)hν)1/η versus hν results in a straight line where the intercept with the x-axis gives the band gap energy. Bi2O3, BiOBr and the composites all absorb in the visible light region with the absorption edge between 380 and 470 nm (Fig. 6a). For Bi2O3, the best linear fit was obtained with η = 1/2, in agreement with a direct-allowed electron transition of the material, and the Eg was deduced to be 2.92 eV (Fig. 6b). Because the band gap transition in BiOBr is indirect, a linear fit was obtained with η = 2 and the Eg was calculated to be 2.82 eV. Despite the wider band gap in Bi2O3, its absorption in the visible light region of 400–500 nm is stronger than that of BiOBr due to the direct excitation of electrons. The absorption of BiOBr/Bi2O3 composites decreased with BiOBr content and these materials have two band gaps between 2.82 and 2.92 eV.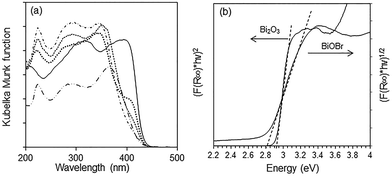 | ||
Fig. 6 (a) Diffuse reflectance spectra of ( ) Bi2O3, ( ) Bi2O3, ( ) BiOBr, BiOBr/Bi2O3 composites with ( ) BiOBr, BiOBr/Bi2O3 composites with ( ) 12%, ( ) 12%, ( ) 57% and ( ) 57% and ( ) 85% BiOBr and (b) determination of absorption edge energies for Bi2O3 and BiOBr. ) 85% BiOBr and (b) determination of absorption edge energies for Bi2O3 and BiOBr. | ||
3.3 Photocatalytic properties
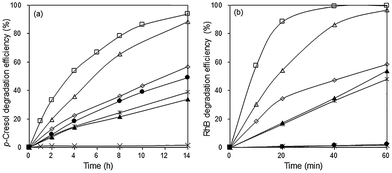
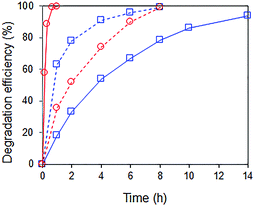
In the absence of the photocatalyst, no p-cresol degradation occurred even after 14 h illumination with visible light. In the presence of Bi2O3, ∼49% of p-cresol was degraded after this time (Fig. 7a). The degradation efficiency of the BiOBr/Bi2O3 composites was significantly higher and increased with BiOBr composition. However, pure BiOBr gave only 34% degradation efficiency. The highest activity was observed for 85 wt% BiOBr/Bi2O3 where 33% of p-cresol was degraded within 2 h and 94% after 14 h.The photodegradation of RhB was considerably faster than that of p-cresol. The highest photoactivity for RhB degradation was again observed for the sample, 85 wt% BiOBr/Bi2O3, showing that its activity is not specific for only one type of molecule (Fig. 7b). After only 1 h, >99% of RhB had been degraded. BiOBr/Bi2O3 were mechanically mixed in the same weight ratio, but its pseudo first-order rate constants for the degradation of p-cresol and RhB was about 5 and 8 times smaller, respectively, than the heterojunctioned composite. This result points to the importance of heterojunctions in the composite rather than the composition. The intimately bound interface formed between the (110) planes of BiOBr with the underlying (120) planes in Bi2O3 can reduce the electron–hole pair recombination more effectively than the loosely formed junctions between the components in the mechanical mixture.
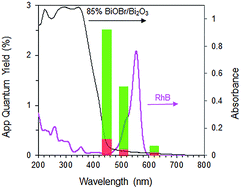
Interestingly, when a mixture containing 20 ppm RhB and 24 ppm of p-cresol was used as substrate, the rate of p-cresol photodegradation increased while that of RhB decreased (Fig. 8). 94% of p-cresol was degraded after only 6 h instead of 14 h. In contrast, RhB required 8 h instead of 1 h to reach >99% degradation efficiency. Similar results were observed when the p-cresol/RhB mixture was illuminated with blue, green and red LED light (Fig. S4†). With the blue LED light (wavelength of 430–470 nm), there should be no dye sensitization as the RhB does not absorb in this range (Fig. 9). Nevertheless, the apparent quantum yield for p-cresol degradation in the mixture was again substantially enhanced over that in the pure solution (2.53 vs. 0.31%).
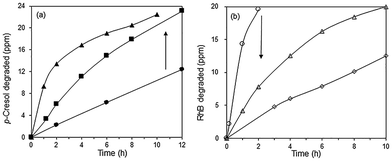
The effect of RhB on the photodegradation of p-cresol was further investigated using blue LED illumination. Addition of 10 and 20 ppm of RhB increased the rate of p-cresol photodegradation so that >95% of p-cresol was degraded after 10–12 h (Fig. 10a). In contrast, the photoactivity for RhB degradation was adversely affected by the simultaneous presence of p-cresol (Fig. 10b). Without added p-cresol, complete degradation of RhB occurred within 2 h but in the presence of 24 ppm p-cresol, it required 10 h. With 48 ppm p-cresol, even after 10 h, only 62% of RhB was photodegraded.
To understand the interactive effect of p-cresol and RhB, we examined the equilibrium surface concentrations after adsorption in the dark. Individually, the amount of adsorbed p-cresol and RhB on 85 wt% BiOBr/Bi2O3 was calculated to be 1.0 and 1.9 μmol m−2, respectively (Table 1). Hence, despite a 5× lower molar concentration (42 μM RhB vs. 222 μM p-cresol), the equilibrium surface concentration for RhB is higher than for p-cresol. This can be explained by the electrostatic attraction between the negatively charged BiOBr/Bi2O3 surface, which has a point of zero charge at pH 6.1 (Fig. S5†), and the positively charged amino groups of RhB. At a solution pH of 5, RhB exists in the deprotonated form and cannot adsorb via the carboxylic acid group. In the mixed p-cresol–RhB solutions, the decreased rate of RhB photodegradation in the mixture cannot be explained by competitive adsorption between the two molecules as the adsorbed p-cresol and RhB at the surface fell by only ∼2 and 5%, respectively. Moreover, the rate of p-cresol photodegradation was enhanced rather than decreased.
Some insights into the underlying interaction may be deduced from the spectral changes of the RhB UV-vis spectra during photodegradation over 85% BiOBr/Bi2O3. RhB shows an intense absorption band at 554 nm which decreased by ∼40% due to adsorption at the surface of the photocatalyst (Fig. 11a). Upon visible light irradiation, the absorption decreased, accompanied by a shift of the peak maximum to shorter wavelengths. This hypsochromic shift has been associated with the stepwise removal of ethyl groups from RhB (N,N,N′,N′-tetraethylated rhodamine) to form rhodamine (λmax ∼ 498 nm).43 After 60 min, the peak intensity decreased without any further shift in the wavelength as the ring structure of the RhB chromophore is degraded. However, in the presence of p-cresol, the absorbance initially decreased without any shift in the wavelength indicating that degradation occurred at the aromatic RhB chromophore.
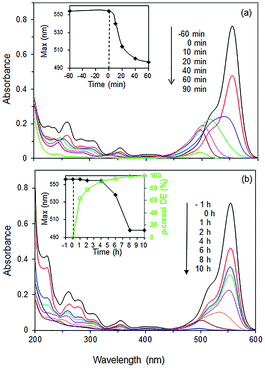 | ||
Fig. 11 UV spectra of (a) pure RhB solution and (b) mixture of RhB and p-cresol (20![[thin space (1/6-em)]](https://www.rsc.org/images/entities/char_2009.gif) : :![[thin space (1/6-em)]](https://www.rsc.org/images/entities/char_2009.gif) 24 ppm) under visible light irradiation as a function of time. Photocatalyst: 85% BiOBr/Bi2O3. 24 ppm) under visible light irradiation as a function of time. Photocatalyst: 85% BiOBr/Bi2O3. | ||
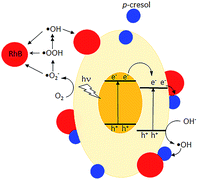
De-ethylation of RhB is a surface process that requires the molecule to be adsorbed on the photocatalyst. Photodegradation is initiated by injection of an electron from an excited RhB into the conduction band of the photocatalyst or the adsorbed RhB molecule traps a photogenerated hole and is converted to RhB+.43 In contrast, the aromatic ring structure is cleaved by photogenerated ·OH, ·OOH and ·O2− in the solution phase away from the surface.43–45 The presence of ·OH was detected by its reaction with terephthalic acid, forming 2-hydroxyterephthalic acid which gave an intense fluorescence at 425 nm (Fig. S6†).46 Use of scavengers showed that superoxide and especially holes also participated in the photodegradation (Fig. S7†).47,48 However, due to their low concentrations in bulk solution, this degradative route is slower than de-ethylation. The UV-vis spectra indicate that the former occurred when p-cresol was added. However, electrons, holes, ·OH, and ·OOH are generated at a rate that does not depend on whether p-cresol or RhB is present singly or in a mixture. The changes in their degradation rates suggest RhB forms an effective conduit to transfer the surface photogenerated electrons or holes to p-cresol (Fig. 12). Co-adsorption at the surface of the photocatalyst is necessary to bring the molecules close enough for excitation transfer from RhB to p-cresol. As a result, the rate at which RhB is N-dealkylated is decreased while simultaneously the rate of p-cresol degradation is increased. Without the solid photocatalyst, no degradation was observed, showing that RhB does not act as a photosensitizer.
To confirm that in the presence of p-cresol, the predominant pathway for RhB degradation is via photogenerated oxidant species in the bulk solution, Fe3+ was added to a mixture of p-cresol and RhB. When a photoelectron reacts with oxygen, H2O2 is formed together with OH·:
| e− + O2 → ·O2− |
| ·O2− + H2O → HOO· + OH− |
| HOO· + H2O → HO· + H2O2 |
Although H2O2 is relatively unreactive, Fe3+ can catalyse the decomposition of H2O2 to generate more ·OH radicals in the bulk solution via:
| Fe3+ + H2O2 → Fe2+ + ·OOH + H+ |
| Fe3+ + ·OOH → Fe2+ + H+ + O2 |
| Fe2+ + H2O2 → Fe3+ + ·OH + OH− |
A substantial acceleration of the RhB degradation was indeed observed when Fe3+ was added (Fig. 13) with the rate increasing with Fe3+ concentration. The degradation occurred via cleavage at the aromatic chromophore as no shift in the wavelength of RhB absorption peak at 554 nm was observed (Fig. S8†).
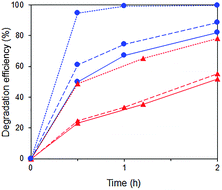 | ||
Fig. 13 Photocatalytic degradation of p-cresol ( ) and RhB ( ) and RhB ( ) in mixtures with no Fe3+ ( ) in mixtures with no Fe3+ ( ) and in the presence of 0.016 mM ( ) and in the presence of 0.016 mM ( ) and 2.5 mM ( ) and 2.5 mM ( ) Fe3+. ) Fe3+. | ||
The stability of the photocatalyst was tested by adding fresh RhB solution after each batch reaction (Fig. S9a†). There was no significant change in the degradation efficiency over four cycles. The X-ray diffractogram of the used catalyst was similar to that of the fresh catalyst, indicating its stability against photocorrosion (Fig. S9b†).
4. Conclusion
The reaction of hydrobromic acid with Bi2O3 forms heterojunctioned composites of BiOBr and Bi2O3. Because of the similarity in the atomic arrangement of the (120) plane of Bi2O3 and the (110) plane of BiOBr, a tightly connected interface can form between the growing BiOBr overlayer and the underlying Bi2O3 substrate. SEM micrographs showed that the composites consisted of BiOBr platelets arranged in whorls perpendicular to the Bi2O3 surface. The density and thickness of these nanosized platelets increased with BiOBr content. The 85% BiOBr/Bi2O3 composite developed the highest photocatalytic activity for p-cresol and RhB. The photoactivity of the composite catalyst was much higher than that of a mechanical mixture with the same composition, supporting the concept that the interfaces are important to separate the photogenerated charge carriers. In a mixture of p-cresol and RhB, the photodegradation of p-cresol was accelerated whereas that of RhB was hindered. UV-vis studies showed that in the presence of p-cresol, de-ethylation of RhB was inhibited, leaving degradation of the aromatic chromophore by active species from the bulk solution.Acknowledgements
A. Han gratefully acknowledges the support of the Singapore-Peking-Oxford Research Enterprise (SPORE) for a research assistantship. This work was supported by Ministry of Education ARC Tier 1 grants R-143-000-550-112 and R-143-000-603-112.References
- X. Chen and S. S. Mao, Chem. Rev., 2007, 107, 2891–2959 CrossRef CAS PubMed.
- I. Sesenoglu, O. E. Kartal, H. Oguz, M. Erol and A. Calimli, Rev. Chem. Eng., 1999, 15, 223–232 CAS.
- A. G. Agrios and P. Pichat, J. Appl. Electrochem., 2005, 35, 655–663 CrossRef CAS.
- K. L. Zhang, C. M. Liu, F. Q. Huang, C. Zheng and W. D. Wang, Appl. Catal., B, 2006, 68, 125–129 CrossRef CAS.
- J. Zhang, F. Shi, J. Lin, D. Chen, J. Gao, Z. Huang, X. Ding and C. Tang, Chem. Mater., 2008, 20, 2937–2941 CrossRef CAS.
- X. Xiao and W. Zhang, J. Mater. Chem., 2010, 20, 5866–5870 RSC.
- X. Chang, M. A. Gondal, A. A. Al-Saadi, M. A. Ali, H. Shen, Q. Zhou, J. Zhang, M. Du, Y. Liu and G. Ji, J. Colloid Interface Sci., 2012, 377, 291–298 CrossRef CAS PubMed.
- J. Hu, S. Weng, Z. Zheng, Z. Pei, M. Huang and P. Liu, J. Hazard. Mater., 2014, 264, 293–302 CrossRef CAS PubMed.
- K. Yu, S. Yang, H. He, C. Sun, C. Gu and Y. Ju, J. Phys. Chem. A, 2009, 113, 10024–10032 CrossRef CAS PubMed.
- X. Chang, J. Huang, C. Cheng, W. Sha, X. Li, G. Ji, S. Deng and G. Yu, J. Hazard. Mater., 2010, 173, 765–772 CrossRef CAS PubMed.
- X. Chang, G. Ji, Q. Sui, J. Huang and G. Yu, J. Hazard. Mater., 2009, 166, 728–733 CrossRef CAS PubMed.
- T. Kako, Z. Zou, M. Katagiri and J. Ye, Chem. Mater., 2007, 19, 198–202 CrossRef CAS.
- S. Kohtani, S. Makino, A. Kudo, K. Tokumura, Y. Ishigaki, T. Matsunaga, O. Nikaido, K. Hayakawa and R. Nakagaki, Chem. Lett., 2002, 7, 660–661 CrossRef.
- J. Yu and A. Kudo, Adv. Funct. Mater., 2006, 16, 2163–2169 CrossRef CAS.
- W. Yin, W. Wang, L. Zhou, S. Sun and L. Zhang, J. Hazard. Mater., 2010, 173, 194–199 CrossRef CAS PubMed.
- X. Zhang, X. Quan, S. Chen and Y. Zhang, J. Hazard. Mater., 2010, 177, 914–917 CrossRef CAS PubMed.
- N. M. Leonard, L. C. Wieland and R. S. Mohan, Tetrahedron, 2002, 58, 8373–8397 CrossRef CAS.
- X. Chang, G. Yu, J. Huang, Z. Li, S. Zhu, P. Yu, C. Cheng, S. Deng and G. Ji, Catal. Today, 2010, 153, 193–199 CrossRef CAS.
- T. B. Li, G. Chen, C. Zhou, Z. Y. Shen, R. C. Jin and J. X. Sun, Dalton Trans., 2011, 40, 6751–6758 RSC.
- X. Xiao, R. Hao, M. Liang, X. Zuo, J. Nan, L. Li and W. Zhang, J. Hazard. Mater., 2012, 233, 122–130 CrossRef PubMed.
- Y. Liu, W. J. Son, J. Lu, B. Huang, Y. Dai and M. H. Whangbo, Chem.–Eur. J., 2011, 17, 9342–9349 CrossRef CAS PubMed.
- S. Shenawi-Khalil, V. Uvarov, Y. Kritsman, E. Menes, I. Popov and Y. Sasson, Catal. Commun., 2011, 12, 1136–1141 CrossRef CAS.
- H. Gnayem and Y. Sasson, ACS Catal., 2013, 3, 186–191 CrossRef CAS.
- J. Zhang, J. Xia, S. Yin, H. Li, H. Xu, M. He, L. Huang and Q. Zhang, Colloids Surf., A, 2013, 420, 89–95 CrossRef CAS.
- B. Zhang, G. Ji, Y. Liu, M. A. Gondal and X. Chang, Catal. Commun., 2013, 36, 25–30 CrossRef CAS.
- X. Zhang, G. Ji, Y. Liu, X. Zhou, Y. Zhu, D. Shi, P. Zhang, X. Cao and B. Wang, Phys. Chem. Chem. Phys., 2015, 17, 8078–8086 RSC.
- J. Eberl and H. Kisch, Photochem. Photobiol. Sci., 2008, 7, 1400–1406 CAS.
- K. Barrera-Mota, M. Bizarro, M. Castellino, A. Tagliaferro, A. Hernandez and S. E. Rodil, Photochem. Photobiol. Sci., 2015, 14, 1110–1119 CAS.
- L. Zhou, W. Wang, H. Xu, S. Sun and M. Shang, Chem.–Eur. J., 2009, 15, 1776–1782 CrossRef CAS PubMed.
- S. J. A. Moniz, C. S. Blackman, C. J. Carmalt and G. Hyett, J. Mater. Chem., 2010, 20, 7881–7886 RSC.
- P. Riente, A. M. Adams, J. Albero, E. Palomares and M. A. Pericàs, Angew. Chem., Int. Ed., 2014, 126, 9767–9770 CrossRef.
- S. Y. Chai, Y. J. Kim, M. H. Jung, A. K. Chakraborty, D. Jung and W. I. Lee, J. Catal., 2009, 262, 144–149 CrossRef CAS.
- Y. Li, J. Wang, H. Yao, L. Dang and Z. Li, Catal. Commun., 2011, 12, 660–664 CrossRef CAS.
- S. H. Hsieh, G. J. Lee, C. Y. Chen, J. H. Chen, S. H. Ma, T. L. Horng, K. H. Chen and J. J. Wu, Top. Catal., 2013, 56, 623–629 CrossRef CAS.
- X. Liu, L. Pan, T. Lv, Z. Sun and C. Q. Sun, J. Colloid Interface Sci., 2013, 408, 145–150 CrossRef CAS PubMed.
- S. Shamaila, A. K. L. Sajjad, F. Chen and J. Zhang, Appl. Catal., B, 2010, 94, 272–280 CrossRef CAS.
- J. Xu, Y. Ao, D. Fu and C. Yuan, Appl. Surf. Sci., 2008, 255, 2365–2369 CrossRef CAS.
- A. Hameed, T. Montini, V. Gombac and P. Fornasiero, J. Am. Chem. Soc., 2008, 130, 9658–9659 CrossRef CAS PubMed.
- Q. Wang, D. Jiao, J. Lian, Q. Ma, J. Yu and H. Huang, J. Alloys Compd., 2015, 649, 474–482 CrossRef CAS.
- M. A. Butler and D. S. Ginley, J. Electrochem. Soc., 1978, 125, 228–232 CrossRef CAS.
- Agency for Toxic Substances and Disease Registry (ATSDR), Toxicological Profile for Cresols, Public Health Service, U.S. Department of Health and Human Services, Atlanta, GA, 1990 Search PubMed.
- R. A. Smith, Semiconductors, Cambridge University Press, Cambridge, 2nd edn, 1978 Search PubMed.
- T. Wu, G. Liu, J. Zhoa, H. Hidaka and N. Serpone, J. Phys. Chem. B, 1998, 102, 5845–5851 CrossRef CAS.
- X. Li and J. Ye, J. Phys. Chem. C, 2007, 111, 13109–13116 CAS.
- O. Merka, V. Yarovyi, D. W. Bahnemann and M. Wark, J. Phys. Chem. C, 2011, 115, 8014–8023 CAS.
- C. Karunakaran and P. Anilkumar, J. Mol. Catal. A: Chem., 2007, 265, 153–158 CrossRef CAS.
- S. H. Yoon and J. H. Lee, Environ. Sci. Technol., 2005, 39, 9695–9701 CrossRef CAS PubMed.
- H. Zhang, R. Zong, J. Zhao and Y. Zhu, Environ. Sci. Technol., 2008, 42, 3803–3807 CrossRef CAS PubMed.
Footnote |
| † Electronic supplementary information (ESI) available. See DOI: 10.1039/c6ra24852g |
| This journal is © The Royal Society of Chemistry 2017 |

