Direct visualization and real-time monitoring of dissipative self-assembly by synchronously coupled aggregation-induced emission†
Wen-Chao
Geng
a,
Yan-Cen
Liu
a,
Zhe
Zheng
a,
Dan
Ding
 b and
Dong-Sheng
Guo
 *ac
*ac
aDepartment of Chemistry, State Key Laboratory of Elemento-Organic Chemistry, Key Laboratory of Functional Polymer Materials, Ministry of Education, Nankai University, Tianjin 300071, China. E-mail: dshguo@nankai.edu.cn
bKey Laboratory of Bioactive Materials, Ministry of Education, College of Life Sciences, Nankai University, Tianjin 300071, China
cCollaborative Innovation Center of Chemical Science and Engineering, Nankai University, Tianjin 300071, China
First published on 10th October 2017
Abstract
Dissipative self-assembly is a chemical process ubiquitous in and essential to living systems. Its dynamic nature makes it quite appealing to directly visualize and monitor in real-time, thus facilitating the understanding of this phenomenon. Herein, we have demonstrated for the first time a dissipative self-assembling system that in situ exhibits intrinsic fluorescence only in the assembly state by the employment of AIEgens, enabling its direct visualization and real-time monitoring using fluorescence microscopy and spectroscopy, respectively. Fluorescence assay, as a non-invasive and real-time monitoring technique with high sensitivity and resolution, represents a privileged way to disclose the kinetics of dissipative systems, which is on demand on account of their dynamic feature. Furthermore, transient Förster resonance energy transfer was validated as a proof-of-principle function and also to afford dual-channel monitoring.
Introduction
Biological systems rely on various types of self-assemblies to perform complex functions1 that are spatially and temporally programmed, such as cell division,2 active transport3 and signal transduction.4 The structural basis for such functions is essentially an open system that operates far from chemical equilibrium through a continuous exchange of materials and energy with the external environment,2b,5 also known as dissipative self-assembly.6 While nature provides ample examples of dissipative supramolecular organization, most artificial self-assemblies are in static states of global or local minima in the free energy landscape, resulting in structures that are stable in time,7 limiting their abilities to merge with other chemical processes.In recent years, there has been increasing interest in constructing artificial dissipative self-assembly systems, including gels,8 vesicles,9 nanoparticles,5b and so on.10 These reported examples have displayed unique dynamic properties, provided insight into the adaptivity of biological systems and opened opportunities for developing active functional materials.11 Noting its dynamic nature, direct visualization and real-time monitoring of the dissipative self-assembling process are highly desirable as they can provide “movies” and not merely “snapshots” to better understand the kinetic aspects. However, the common ways for tracing dissipative self-assembly, such as dynamic light scattering (DLS),10a electron microscopy12 and rheological methods,13 have some drawbacks, including signal delay, low sensitivity and low spatial and temporal resolution.
The fluorescence technique is suitable to address these concerns due to its low cost, ease of use, high sensitivity, and real-time and non-invasive monitoring capability.14 It is therefore highly on-demand to directly visualize and monitor the dissipative kinetics in real time using a high-contrast fluorescence imaging method. In particular, light-up fluorescence imaging of the self-assembly is desirable for tracing the out-of-equilibrium state with high accuracy. However, the main obstacle to constructing fluorescent dissipative self-assembling systems is that conventional dyes exhibit partially or completely quenched emissions in assembling states, known as the aggregation-caused quenching (ACQ) effect.15 Fortunately, the ACQ problem can be addressed in a straightforward manner by recently emerging fluorogens capable of aggregation-induced emission (AIEgens).15 AIEgens are non-emissive in dilute solutions but are luminous upon aggregate formation.16 Therefore, AIEgens are unique candidates to realize the direct visualization and real-time monitoring of dissipative self-assembly. Moreover, AIEgens are very resistant to photobleaching under excitation, facilitating long-term tracing of dissipative processes.17
Herein, we report a dissipative self-assembly system composed of a water-soluble tetraphenylethylene-based AIEgen with cationic side chains (TQA-TPE) with DNA as the energy source (Scheme 1). TPE dyes usually show high fluorescence quantum yields when their intramolecular rotation is restricted.15,18 TQA-TPE and DNA can form transient aggregates driven by multiple electrostatic interactions, turning on AIE fluorescence simultaneously. The hydrolysis of DNA leads to the loss of multivalent binding, and, consequently, spontaneous disassembly of the formed nanoparticles, accompanied by fluorescence quenching. The dissipation process is therefore visualized by monitoring the fluorescence in real time.
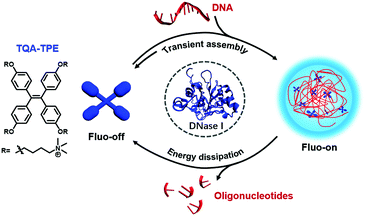 | ||
| Scheme 1 Schematic illustration of the dissipative self-assembly showing AIE fluorescence only in the assembled state. | ||
Moreover, the true important implication of dissipative assembly is that it can provide functions coupled to and dependent on the energy consumption process, which is rare for artificial dissipative assembly systems.9,19 We further incorporate acridine orange (AO), a nucleic acid dye, into the dissipative system to demonstrate transient Förster resonance energy transfer (FRET) as a proof-of-principle function, as long as DNA is present to keep the system in the out-of-equilibrium state. We envisage that the present FRET relies on the dissipative process due to its high sensitivity to the distance and orientation between the donor and acceptor fluorophores.6b Actually, natural photosynthetic systems can appropriately organize chromophores using supramolecular interactions to achieve efficient energy transfer,20 and, more importantly, to regulate the FRET to adapt to different conditions.21 Fabricating artificial dissipative systems with transient FRET would facilitate the development of smart optical materials with adaptive functions like nature.
Results and discussion
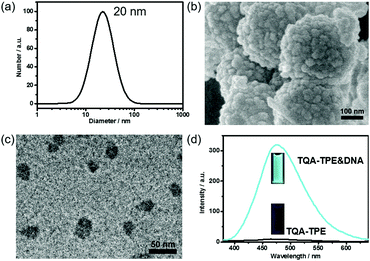
TQA-TPE was prepared according to our previous studies and its critical micelle concentration (CMC) was determined to be 90 μM.22 At a concentration below the CMC ([TQA-TPE] = 10 μM), addition of DNA led to the formation of TQA-TPE&DNA aggregates with a hydrodynamic diameter of 20 nm, identified by the DLS measurement (Fig. 1a). Scanning electron microscopy (SEM) and transmission electron microscopy (TEM) measurements revealed the spherical morphology of the aggregates, and sizes comparable to those measured using DLS (Fig. 1b and c). The larger aggregates in the SEM image are probably due to the hierarchical aggregation of smaller spheres (20 nm) in the drying process. Under the same experimental conditions, free TQA-TPE did not show any appreciable DLS signal. The TQA-TPE&DNA nanoparticles are one class of polyion complex micelles. When flexible polyions are mixed with oppositely charged surfactants, the formation of self-assembled aggregates can be detected at concentrations well below the CMC because of the electrostatic interaction.5a,22,23More importantly, the TQA-TPE&DNA aggregates were highly fluorescent due to the AIE feature of TPE (Fig. 1d).22 The aggregation restricts the intramolecular rotation of the TPE backbone, resulting in strongly enhanced emission. Upon addition of 26.7 μg mL−1 DNA to a solution containing 10 μM TQA-TPE, the emission intensity reached the maximum (Fig. S1 and S2, ESI†), which is 33-fold higher than free TQA-TPE at 470 nm. The fluorescence contrast of TQA-TPE under UV light (handlamp, 365 nm) in the absence and presence of DNA is distinguishable by the naked eye (Fig. 1d). Moreover, free TQA-TPE had a fluorescence lifetime of 0.24 ns, while the TQA-TPE&DNA aggregate had a prolonged lifetime of 2.35 ns (Fig. S3, ESI†) because the aggregation blocks the non-radiative relaxation pathways.15 This AIE feature gives us an opportunity to construct the dissipative self-assembly that exhibits intrinsic fluorescence only in the assembly state.
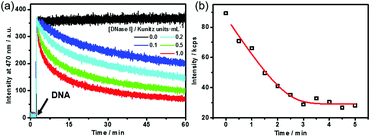
Dissipative self-assembly requires an additional process to utilize the chemical energy stored in fuels and then make the assembly state far from equilibrium.24 For this purpose, we added deoxyribonuclease I (DNase I), an endonuclease that cleaves DNA to oligonucleotides,25 to the dissipative system to consume the DNA fuel (Fig. S4, ESI†). DNase I has no influence on the fluorescence of TQA-TPE (Fig. S4, ESI†). The kinetics of the self-assembling and dissipative processes can be monitored using fluorescence in real time (Fig. 2a). The addition of the DNA fuel to a solution containing TQA-TPE and DNase I led to an immediate increase in fluorescence, followed by a gradual decay with time (Fig. 2a). The instantaneous surge in fluorescence indicates the fast kinetics for the formation of TQA-TPE&DNA aggregates. In dissipative systems, the activation to the form assemblies must be faster than deactivation to ensure the substantial existence of out-of-equilibrium self-assembling states. The fast supramolecular assembly process enables a much higher rate of non-covalent activation than that of enzymatic deactivation. The rate of fluorescence intensity decay depended on the enzymatic activities, displaying half-life times ranging from 15 to 58 min in the presence of different concentrations of DNase I (0.1–1.0 Kunitz units mL−1). Moreover, the fluorescence remained the same in the measured time scale both in the absence of DNase I and in the presence of denatured DNase I (heated at 80 °C for 1 h) (Fig. 2a and Fig. S5, ESI†). All these observations demonstrate that the hydrolysis of DNA by DNase I dissipates the fuels and disperses the TQA-TPE&DNA aggregates and that the dissipative kinetics could be finely tuned by the enzymatic activity.
The dissipative kinetics were further evaluated using DLS, which is a powerful tool for detecting the assembly/disassembly. No appreciable change in scattering intensity can be detected when assuming the same concentration (10 μM TQA-TPE) with fluorescence measurements, probably because of the lower sensitivity of DLS than fluorescence. We therefore implemented DLS monitoring at seven times higher concentration (70 μM TQA-TPE). The scattering intensity gradually decreased upon incubation with DNase I (Fig. 2b), also indicating the disassembly of the TQA-TPE&DNA aggregates. The kinetic data of fluorescence and DLS scattering intensity were fitted with the DynaFit program (see the ESI†).26 Interestingly, the dissipating rate constant obtained by DLS was 6.5 times higher than that obtained by fluorescence. The inconsistency probably stems from the different signal rationales between DLS and fluorescence. Light scattering is inherently biased to larger entities because the scattering intensity of a small object is proportional to the sixth power of its diameter.27 The fluorescence intensity of AIEgens showed a linear relationship with the aggregation performance, which has been widely engaged in various quantitative detections.28 Such a demonstration was further validated by the titration of DNA with TQA-TPE that the fluorescence intensity of TQA-TPE increased linearly with the DNA concentration up to 26.7 μg mL−1 (the left-hand portion of inflexion in Fig. S2 (ESI†), excess DNA would lead to a plateau and even some slight decrease in the fluorescence intensity, which is common in polyion complex micelles22). Consequently, we reasonably envisage that fluorescence represents a more sensitive and convincible approach to monitor the dissipative kinetics than DLS.
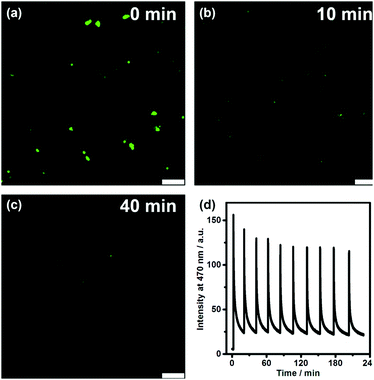
We further directly visualized the dissipative self-assembling process through video recording (Video S1, the movie is played at a 20× speed for the convenience of the observation, ESI†) and laser scanning confocal microscopy (Fig. 3a–c and Fig. S7, S8, ESI†). In the absence of DNA, no distinguishable fluorescent entity can be observed. After addition of DNA, fluorescent objects emerged and gradually diminished not only in number but also in size, also indicating that DLS monitoring may give false results about the dissipative kinetics.
To investigate the repeatability of the transient self-assembly, the same amount of DNA fuel was added to the TQA-TPE solution containing DNase I at intervals of 20 min (Fig. 3d). The system can be effectively refueled for at least ten cycles. There was a slight damping of reversibility, probably because of the accumulation of waste products in the reaction system, which is often encountered in dissipative systems.29 Self-cleaning the waste products to compensate for their side effect is another challenge worthy to be addressed in dissipative systems. The repeatability of the present system was obviously better than the reported examples,9,10e,30 probably because we employed a relatively low concentration. Even at low concentrations, the dissipative self-assembly could be well monitored by fluorescence because of its high sensitivity.
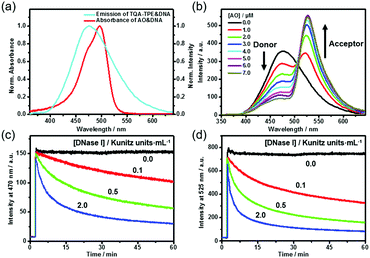
DNA can not only induce the fluorescence of TQA-TPE by aggregation but also concurrently encapsulate another nucleic acid dye into its grooves, bringing the two dyes in close proximity. The DNA-directed juxtaposition of two spectrum-overlapping chromophores promises feasible FRET, which endows the present dissipative system with transient FRET function. By assuming TQA-TPE as the donor, AO was selected as the acceptor because it strongly intercalates into DNA accompanied by a remarkable fluorescence enhancement (Fig. S9, ESI†), and its absorption overlaps well with the emission of TQA-TPE (Fig. 4a). Both the scattering intensity and hydrodynamic diameter given by DLS did not change appreciably upon intercalating AO into DNA (Fig. S10, ESI†), indicating that the intercalation of AO is orthogonal to the electrostatic assembly between DNA and TQA-TPE. It is a compatible process to generate the ternary TQA-TPE&DNA&AO assembly.
Titration of TQA-TPE&DNA solution with AO gradually quenched the donor emission at 470 nm but enhanced the acceptor emission at 525 nm when the donor is selectively excited at 330 nm (Fig. 4b). The part of TQA-TPE absorption at 330–370 nm remained nearly constant upon the addition of AO, indicating the absence of ground-state interactions between donor and acceptor molecules (Fig. S11, ESI†). In the absence of TQA-TPE, excitation of AO&DNA at 330 nm yielded much lower emission than in the presence of TQA-TPE (Fig. S12, ESI†). Additional evidence for the energy transfer was obtained from the excitation spectra of TQA-TPE&AO in the presence or absence of DNA (Fig. S13, ESI†). The intensity at 330–370 nm increased drastically with the addition of DNA. Furthermore, the fluorescence lifetime of TQA-TPE&DNA decreased from 2.35 ns to 1.33 ns upon adding AO (Fig. S3, ESI†). All these results verify FRET from TQA-TPE to AO in the ternary TQA-TPE&DNA&AO ensemble.
By implanting FRET into the dissipative system, we observed the transient FRET as expected. The hydrolysis by DNase I dissipated the DNA fuel, leading to the dispersion of the TQA-TPE&DNA&AO assembly and the disappearance of FRET (Fig. 4c and d). During the dissipative process, both TQA-TPE and AO are released into bulk water in individually diffused states, and then FRET ceases because the donor/acceptor pairs are spatially separated and the donor fluorescence is quenched. The transient FRET not only represents a proof-of-principle function of the dissipative system but also affords dual-channel monitoring of the dissipative kinetics by fluorescence by detecting the emission of TQA-TPE and AO in parallel (Fig. 4c and d).
Conclusions
In conclusion, we demonstrate the direct visualization and real-time monitoring of dissipative self-assembly by using an AIEgen as a building block. Compared with DLS that is widely used in monitoring the assembling process, fluorescence represents a refined approach to monitor the dissipative kinetics with higher sensitivity and better reliability. The AIE fluorescence also promises the direct visualization of dissipative self-assembly by the naked eye or at higher resolution using optical microscopy. Moreover, transient FRET is validated not only as a proof-of-principle function but also to afford dual-channel monitoring. The present study not only represents an avant-garde design of dissipative self-assembly, but also provides a fluorescence approach based on AIEgens that may be amendable to any other dissipative systems, especially with regard to kinetic profiling in real time.Conflicts of interest
There are no conflicts to declare.Acknowledgements
This work was supported by the NSFC (21672112), the Fundamental Research Funds for the Central Universities and the Program of Tianjin Young Talents, which are gratefully acknowledged.Notes and references
- D. J. Kushner, Bacteriol. Rev., 1969, 33, 302–345 CAS.
- (a) A. K. Dambenieks, P. H. Q. Vu and T. M. Fyles, Chem. Sci., 2014, 5, 3396–3403 RSC; (b) E. Karsenti, Nat. Rev. Mol. Cell Biol., 2008, 9, 255–262 CrossRef CAS PubMed.
- C. G. Pappas, I. R. Sasselli and R. V. Ulijn, Angew. Chem., Int. Ed., 2015, 54, 8119–8123 CrossRef CAS PubMed.
- S. O. Rizzoli, EMBO J., 2014, 33, 788–822 CrossRef CAS PubMed.
- (a) C. Wang, Q. Chen, Z. Wang and X. Zhang, Angew. Chem., Int. Ed., 2010, 49, 8612–8615 CrossRef CAS PubMed; (b) B. G. P. van Ravensteijn, W. E. Hendriksen, R. Eelkema, J. H. van Esch and W. K. Kegel, J. Am. Chem. Soc., 2017, 139, 9763–9766 CrossRef CAS PubMed; (c) E. Mattia and S. Otto, Nat. Nanotechnol., 2015, 10, 111–119 CrossRef CAS PubMed.
- (a) G. M. Whitesides and R. F. Ismagilov, Science, 1999, 284, 89–92 CrossRef CAS PubMed; (b) H. Q. Peng, L. Y. Niu, Y. Z. Chen, L. Z. Wu, C. H. Tung and Q. Z. Yang, Chem. Rev., 2015, 115, 7502–7542 CrossRef CAS PubMed.
- (a) E. J. Kim, R. Kumar, A. Sharma, B. Yoon, H. M. Kim, H. Lee, K. S. Hong and J. S. Kim, Biomaterials, 2017, 122, 83–90 CrossRef CAS PubMed; (b) T. Aida, E. W. Meijer and S. I. Stupp, Science, 2012, 335, 813–817 CrossRef CAS PubMed.
- (a) G. Ragazzon, M. Baroncini, S. Silvi, M. Venturi and A. Credi, Nat. Nanotechnol., 2015, 10, 70–75 CrossRef CAS PubMed; (b) S. Debnath, S. Roy and R. V. Ulijn, J. Am. Chem. Soc., 2013, 135, 16789–16792 CrossRef CAS PubMed; (c) S. O. Rizzoli, EMBO J., 2014, 33, 788–822 CrossRef CAS PubMed; (d) C. G. Pappas, I. R. Sasselli and R. V. Ulijn, Angew. Chem., Int. Ed., 2015, 54, 8119–8123 CrossRef CAS PubMed; (e) R. F. Service, Science, 2005, 309, 95 CrossRef CAS PubMed.
- S. Maiti, I. Fortunati, C. Ferrante, P. Scrimin and L. J. Prins, Nat. Chem., 2016, 8, 725–731 CrossRef CAS PubMed.
- (a) J. Boekhoven, Angew. Chem., Int. Ed., 2010, 49, 4825–4828 CrossRef CAS PubMed; (b) T. Heuser, A. K. Steppert, C. Molano Lopez, B. Zhu and A. Walther, Nano Lett., 2015, 15, 2213–2219 CrossRef CAS PubMed; (c) G. Ragazzon, M. Baroncini, S. Silvi, M. Venturi and A. Credi, Nat. Nanotechnol., 2015, 10, 70–75 CrossRef CAS PubMed; (d) T. Hayashi, S. Chiba, Y. Kaneta, T. Furuta and M. Sakurai, J. Phys. Chem. B, 2014, 118, 12612–12620 CrossRef CAS PubMed; (e) S. Dhiman, A. Jain and S. J. George, Angew. Chem., Int. Ed., 2017, 56, 1329–1333 CrossRef CAS PubMed; (f) S. Dhiman, A. Jain, M. Kumar and S. J. George, J. Am. Chem. Soc., 2017 DOI:10.1021/jacs.7b07469; (g) K. Jalani, S. Dhiman, A. Jain and S. J. George, Chem. Sci., 2017, 8, 6030–6036 RSC.
- S. A. P. van Rossum, M. Tena-Solsona, J. H. van Esch, R. Eelkema and J. Boekhoven, Chem. Soc. Rev., 2017, 46, 5519–5535 RSC.
- J. K. Sahoo, C. G. Pappas, I. R. Sasselli, Y. M. Abul-Haija and R. V. Ulijn, Angew. Chem., Int. Ed., 2017, 56, 6828–6832 CrossRef CAS PubMed.
- J. Boekhoven, W. E. Hendriksen, G. J. M. Koper, R. Eelkema and J. H. van Esch, Science, 2015, 349, 1075–1079 CrossRef CAS PubMed.
- (a) K. P. Carter, A. M. Young and A. E. Palmer, Chem. Rev., 2014, 114, 4564–4601 CrossRef CAS PubMed; (b) J. Chan, S. C. Dodani and C. J. Chang, Nat. Chem., 2012, 4, 973–984 CrossRef CAS PubMed; (c) X. Li, X. Gao, W. Shi and H. Ma, Chem. Rev., 2014, 114, 590–659 CrossRef CAS PubMed; (d) J. Liu, Z. Cao and Y. Lu, Chem. Rev., 2009, 109, 1948–1998 CrossRef CAS PubMed.
- J. Mei, N. L. Leung, R. T. Kwok, J. W. Lam and B. Z. Tang, Chem. Rev., 2015, 115, 11718–11940 CrossRef CAS PubMed.
- (a) J. D. Luo, Z. L. Xie, J. W. Y. Lam, L. Cheng, H. Y. Chen, C. F. Qiu, H. S. Kwok, X. W. Zhan, Y. Q. Liu, D. B. Zhu and B. Z. Tang, Chem. Commun., 2001, 1740–1741 RSC; (b) Y. Hong, J. W. Lam and B. Z. Tang, Chem. Soc. Rev., 2011, 40, 5361–5388 RSC.
- J. Qian and B. Z. Tang, Chem, 2017, 3, 56–91 CAS.
- (a) W. Guan, W. Zhou, C. Lu and B. Z. Tang, Angew. Chem., Int. Ed., 2015, 54, 15160–15164 CrossRef CAS PubMed; (b) W. Guan, S. Wang, C. Lu and B. Z. Tang, Nat. Commun., 2016, 7, 11811 CrossRef PubMed.
- A. K. Dambenieks, P. H. Q. Vu and T. M. Fyles, Chem. Sci., 2014, 5, 3396–3403 RSC.
- (a) Y. H. Lee, Y. Tang, P. Verwilst, W. Lin and J. S. Kim, Chem. Commun., 2016, 52, 11247–11250 RSC; (b) F. Zhang, Y. Sun, D. Tian, W. S. Shin, J. S. Kim and H. Li, Chem. Commun., 2016, 52, 12685–12693 RSC.
- M. H. Lee, N. Park, C. Yi, J. H. Han, J. H. Hong, K. P. Kim, D. H. Kang, J. L. Sessler, C. Kang and J. S. Kim, J. Am. Chem. Soc., 2014, 136, 14136–14142 CrossRef CAS PubMed.
- Y.-C. Liu, Y.-Y. Wang, H.-W. Tian, Y. Liu and D.-S. Guo, Org. Chem. Front., 2016, 3, 53–61 RSC.
- N. Basilio, B. Gomez, L. Garcia-Rio and V. Francisco, Chem. – Eur. J., 2013, 19, 4570–4576 CrossRef CAS PubMed.
- M. Fialkowski, J. Phys. Chem. B, 2006, 110, 2482–2496 CrossRef CAS PubMed.
- J. H. Kwak, Y. He, B. Yoon, S. Koo, Z. Yang, E. J. Kang, B. H. Lee, S. Y. Han, Y. C. Yoo, K. B. Lee and J. S. Kim, Chem. Commun., 2014, 50, 13045–13048 RSC.
- P. Kuzmic, Anal. Biochem., 1996, 237, 260–273 CrossRef CAS PubMed.
- Y. Li, V. Lubchenko and P. G. Vekilov, Rev. Sci. Instrum., 2011, 82, 053106 CrossRef PubMed.
- C. W. Leung, Y. Hong, J. Hanske, E. Zhao, S. Chen, E. V. Pletneva and B. Z. Tang, Anal. Chem., 2014, 86, 1263–1268 CrossRef CAS PubMed.
- G. Ashkenasy, T. M. Hermans, S. Otto and A. F. Taylor, Chem. Soc. Rev., 2017, 46, 2543–2554 RSC.
- C. S. Wood, C. Browne, D. M. Wood and J. R. Nitschke, ACS Cent. Sci., 2015, 1, 504–509 CrossRef CAS PubMed.
Footnote |
| † Electronic supplementary information (ESI) available. See DOI: 10.1039/c7qm00407a |
| This journal is © the Partner Organisations 2017 |

