 Open Access Article
Creative Commons Attribution 3.0 Unported Licence
Solid-state photoelectrochemical cell with TiO2 nanotubes for water splitting
Kaiqi
Xu
,
Athanasios
Chatzitakis
and
Truls
Norby
*
University of Oslo, Department of Chemistry, Centre for Materials Science and Nanotechnology, Oslo, Norway. E-mail: truls.norby@kjemi.uio.no
First published on 6th September 2016
Abstract
We have fabricated and tested a photoelectrochemical (PEC) cell where the aqueous electrolyte has been replaced by a proton conducting hydrated Nafion® polymer membrane. The membrane was sandwiched between a TiO2-based photoanode and a Pt/C-based cathode. The performance was tested with two types of photoanode electrodes, a thermally prepared TiO2 film on Ti foil (T-TiO2) and a nanostructured TiO2 films in the form of highly ordered nanotubes (TNT) of different lengths. Firstly, photovoltammetry experiments were conducted under asymmetric conditions, where the anode was immersed in deionized water, while the cathode was kept in ambient air. The results showed a high incident photon-to-current efficiency (IPCE) of 19% under unassisted conditions (short-circuit, 0 V vs. cathode) with short TNT (ca. 1 μm) under 4 mW cm−2 illumination with UV-A rich light. Secondly, the deionized water was replaced by 0.5 M Na2SO4 and now the performance was higher with longer nanotubes, assigned to increased ionic conductivity inside the tubes. An unassisted (0 V) IPCE of 33% was achieved with nanotubes of ca. 8 μm. The presented solid-state PEC cell minimizes the electrode distance and volume of the device, and provides a way towards compact practical applications in solar water splitting.
1. Introduction
Since Fujishima and Honda1 reported the photoelectrochemically assisted water splitting using TiO2, considerable interest in the use of photosensitive semiconducting electrodes has been spawned. Such a system offers efficient and inexpensive production of hydrogen based on renewable energy conversion. Since then, the vast majority of research is conducted with liquid electrolytes, in which photo-corrosion of the photoelectrode and bulky and inefficient photoelectrocatalytic reactors are severe drawbacks2,3 for practical applications. Solid state electrolytes, apart from the direct separation of the evolved H2 and O2 gases, have potential advantages over liquid ones, such as operation at more elevated temperatures, prevention of photo-corrosion, and simpler and more robust device design. A few reports employing PEC water splitting cells with PEM-electrolyser-like device designs exist. Ichikawa et al.4,5 employed a Nafion® membrane as the solid electrolyte and performed water photo-oxidation on the anode and CO2 reduction at the cathode. Georgieva et al.6 have demonstrated the decomposition of organic vapours on an all-solid PEC cell under UV and visible illumination. Further examples of water splitting have been demonstrated with acid solutions,7 alkaline solutions,8 and pure water,9,10 while Iwu et al. were the first to report all-solid-state PEC H2 generation from water vapour.11 Such a PEC cell design minimizes the distance between the electrodes, makes the cell robust and integral, and avoids gas mixing. The use of water vapour has potential advantages, as it allows the cell to heat up by the sunlight and utilize the purification of the water inherent to vaporization. It has also been shown that a PEM electrolyser operating under water vapour can be more efficient than in liquid water, when it comes to the current density range that the future PEC cells are expected to operate in ref. 12. Recently, Brunauer et al.13 demonstrated a high-temperature photoelectrochemical cell, which potentially can be used for water splitting from steam.In this work we test and compare the photoelectrochemical performance of two types of TiO2 photoanodes, a thermally prepared TiO2-coated electrode (T-TiO2) and a high surface area TiO2 photoelectrode in the form of TiO2 nanotubes (TNT)14–16 in a solid-state PEC cell. The anode and cathode are adhered to either side of the polymer electrolyte by Nafion® and the photo-oxidation of water under asymmetric conditions, is investigated.
The choice of TNT is based on the fact that one-dimensional TiO2 nanostructured films, aligned perpendicular to the substrate (Ti foil), provide high internal surface area17,18 and unidirectional electron migration between the film and the substrate,19 thus limiting their recombination with the photogenerated electron holes that move towards the surface of the nanotube.16 In addition, the simplicity in preparation and control over their geometrical factors, i.e. pore diameter, wall thickness, and nanotube length, makes them an attractive, self-ordered material with a potential for scale-up applications.20 Historically, the first generation TNT were formed by Zwilling et al. in 199915 from the anodization of Ti foil in aqueous solutions containing HF. In the third generation TNT, the introduction of organic electrolytes allows the formation of long, smooth and uniformly shaped TNT.21 Here, the TNT films are prepared in organic-based electrolytes containing small amounts of NH4F and H2O, and a two-step anodization process is adapted.
2. Experimental
2.1. Chemicals
Ti foil (0.25 mm thick, 99.7% purity, Sigma-Aldrich) was used as substrate for the growth of both the thermally prepared TiO2-coated electrode and the TNT with the anodic oxidation method. Nafion® perfluorinated resin solution 5 wt% in lower aliphatic alcohols and 15–20% water (Nafion5), Nafion® perfluorinated resin solution 20 wt% in lower aliphatic alcohols and 34% water (Nafion20), ethylene glycol (EG), ammonium fluoride (NH4F), isopropanol, acetone and anhydrous sodium sulphate (Na2SO4) were all of analytical grade from Sigma-Aldrich. Pt–C (Pt/Vulcan XC-72R, 10 wt% Pt) and Toray™ C-paper U1 with thickness of 0.19 mm were obtained from Quintech. Deionized water (18.2 MΩ cm) was used throughout the work. All chemicals were used as received without further purification.2.2. Photoelectrode preparation (photoanode)
Before use the Ti foil substrate was ultrasonically cleaned in isopropanol for 30 min followed by 30 min in acetone. Thermally prepared TiO2-coated photoelectrodes (T-TiO2) were fabricated by direct heat treatment of the Ti foil in air at 500 °C, for 2 hours, with a heating and cooling rate of 2 °C min−1. TiO2 nanotube (TNT) photoelectrodes were prepared in a two-step anodization process, in which two Ti foils served as anode and cathode. Typically, the electrodes were immersed in an EG solution containing 0.25 wt% of NH4F and 2 vol% of H2O at a distance of 2 cm. During the first anodization process, 60 V was applied for 2 h. Then, the anode was rinsed with water and dried in air, during which the oxide layer peels off spontaneously. In this way a mould (hexagonal patterns) for the second step TiO2 nanotubes was left on the Ti substrate. In the second step, anodization was performed again at 60 V for 5, 20 and 30 min and the corresponding electrodes are referred to as TNT5, TNT20 and TNT30, respectively. As in the case of the T-TiO2 electrodes, the annealing was carried out at 500 °C in air for 2 h, with a heating and cooling rate of 2 °C min−1. All electrodes were placed inside an alumina crucible with an alumina cover to avoid particle contamination from the furnace.2.3. Cathode preparation
The cathode was prepared by drop-casting the Pt–C electrocatalyst on the C-paper from an isopropanol suspension, containing 7/3 weight ratio of Pt/Nafion. The concentration of the suspension was 10 mg Pt–C per ml isopropanol, while the loading of the electrocatalyst on the C-paper was kept at 1 mg cm−2.2.4. Preparation of the solid polymer electrolyte and PEC cell assembly
As shown in Fig. 1 (left), the solid polymer electrolyte was prepared by drop-casting 600 μL Nafion5 solution onto Millipore Prefilter paper (pore size 5 μm) and left to dry overnight. The anode was adhered to the membrane by 20 μL Nafion20 solution, and similarly, the cathode was adhered to the opposite side by applying 10 μL Nafion5 solution, and having the Pt–C side facing towards the membrane. Afterwards, about 13 kPa pressure was applied to the stack for 12 h at room temperature to fabricate a compact three-layer membrane. Therefore, Nafion® is at the same time the proton conducting polymer membrane and the adhesive agent for the fastening of the anode and cathode electrodes. | ||
| Fig. 1 Preparation process of the three-layer membrane (left) and PEC cell set-up using a Zahner PECC-2® cell (right). | ||
Then, the three-layer membrane was mounted in a commercially available PEC cell, as shown in Fig. 1 (right). Two O-rings were used in order to fix the three-layer membrane gas tight between the two compartments of the Zahner PECC-2® cell. The anode side was exposed to deionized water (18.2 MΩ cm) or 0.5 M Na2SO4(aq), while the cathode was kept in ambient air.
2.5. Characterization
The morphological characterization of the T-TiO2, TNT and cathode electrodes was observed by scanning electron microscopy (SEM) using a FEI Quanta 200F FEG-ESEM microscope. The crystal structure of the films was determined by X-ray diffraction (XRD) in a Bruker D8 Discover diffractometer using Cu Kα-filtered radiation (λ = 1.5406 Å), step 0.02° (2θ), while count time was 1 s per step. An Omnicure S2000 UV-vis light source, with a UV-rich total light intensity of 4 mW cm−2 in total, was used in all PEC experiments. The light source was equipped with a filter in the 320–500 nm range and its light intensity was calibrated as described by Iwu et al.22 Current–voltage measurements were conducted in a two-electrode configuration, hence without reference electrode. A three-electrode configuration was used only in order to measure the open circuit photovoltage (OCP) of the photoelectrodes. In this case an aqueous solution containing 0.5 M Na2SO4 was employed, together with a Ag/AgCl/Sat. KCl (+0.197 V vs. NHE) as the reference electrode. The applied potential was obtained by a PARSTAT 2273 (Princeton Applied Research) potentiostat, equipped with a built-in frequency response analyzer.3. Results and discussion
Fig. 2a presents a SEM micrograph of the T-TiO2 photoelectrode showing a normal surface with some micro-roughness, while 2b–2d show TNT of different length. The TNT photoelectrodes prepared by the two-step anodization method show a uniform coverage of nanotubes formed in a closed-pack configuration. The different geometrical factors of the prepared TNT electrodes are given in Table 1. The roughness factor has been calculated according to the following equation: | (1) |
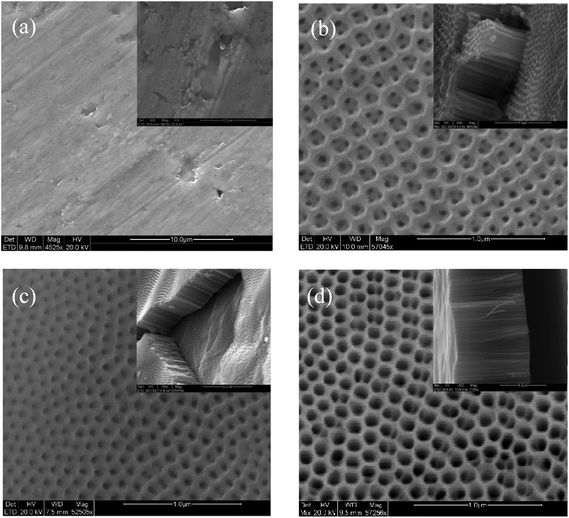 | ||
| Fig. 2 SEM micrographs of T-TiO2 (a), TNT5 (b), TNT20 (c) and TNT30 (d), with the corresponding TNT cross-sections and higher T-TiO2 magnification in the insets. | ||
| Tube length (μm) | Inner pore diameter ±10% (nm) | Wall thickness ±10% (nm) | Aspect ratio | Roughness factor | |
|---|---|---|---|---|---|
| TNT5 | 0.8 | 116 | 63 | ∼4.5![[thin space (1/6-em)]](https://www.rsc.org/images/entities/char_2009.gif) : :![[thin space (1/6-em)]](https://www.rsc.org/images/entities/char_2009.gif) 1 1 |
∼28 |
| TNT20 | 1.2 | 53 | 55 | ∼11.1![[thin space (1/6-em)]](https://www.rsc.org/images/entities/char_2009.gif) : :![[thin space (1/6-em)]](https://www.rsc.org/images/entities/char_2009.gif) 1 1 |
∼61 |
| TNT30 | 8.1 | 119 | 36 | ∼51.6![[thin space (1/6-em)]](https://www.rsc.org/images/entities/char_2009.gif) : :![[thin space (1/6-em)]](https://www.rsc.org/images/entities/char_2009.gif) 1 1 |
∼336 |
XRD (Fig. 3) showed that the main phase in the case of the T-TiO2 was mainly rutile, while the nanostructured photoanodes were anatase, with the TNT5 and TNT20 containing small amounts of rutile. It has been shown that the rutile phase is forming most probably in the interface between the oxide layer and the substrate.18 For the anatase phase, the main peaks were indexed according to the ICDD-JCPD file 21-1272 at 2θ values of 25.1, 37.7, 48.1 and 53.8°, representing the Miller indices of (101), (004), (200) and (105) planes, respectively. Similarly, the main rutile peaks according to the ICDD-JCPD file 21-1276 were at 2θ values of 27.6 and 54.3°, representing the Miller indices of (110) and (211), respectively.
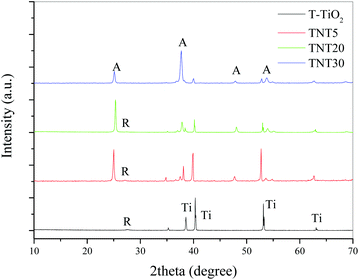 | ||
| Fig. 3 XRD diffractograms of T-TiO2 and TNT electrodes of different nanotube lengths after annealing at 500 °C. | ||
The surface morphology of the cathode is presented in Fig. 4 (left), where it can be seen that the Pt/C catalyst has partially filled the C-paper. This is particularly important when hydrogen production is considered, as the porosity of the electrocatalyst ensures the release of the gas through its pores. The pores are of the order of a few tens to hundreds micrometers.
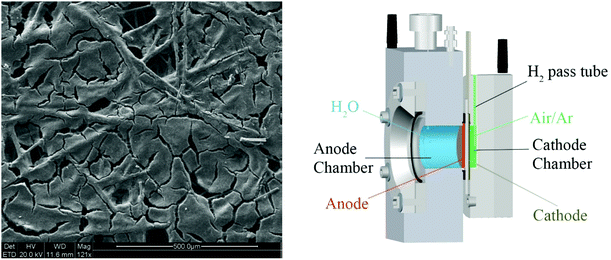 | ||
| Fig. 4 SEM micrographs of the Pt/C carbpn fiber cathode electrode (left) and the cross section of the Zahner PECC-2® cell under operating conditions (right). | ||
Fig. 4 (right) shows a cross sectional image of PEC assembly under operating conditions, using the Zahner PECC-2® cell. The image emphasizes the asymmetric conditions chosen for the performance of the PEC measurements. Deionized water was the only reactant present in the anode compartment, while the cathode was kept under ambient air, leading most probably to the generation of water and thereby humidifying the electrolyte and the air, according to the following general reaction:
| O2 + 4H+ + 4e− → 2H2O | (2) |
One can change the cathode atmosphere to an inert gas (Ar, N2) and should expect that the protons generated from water splitting in the anode will be reduced to form hydrogen in the cathode, as shown earlier by Iwu et al.11
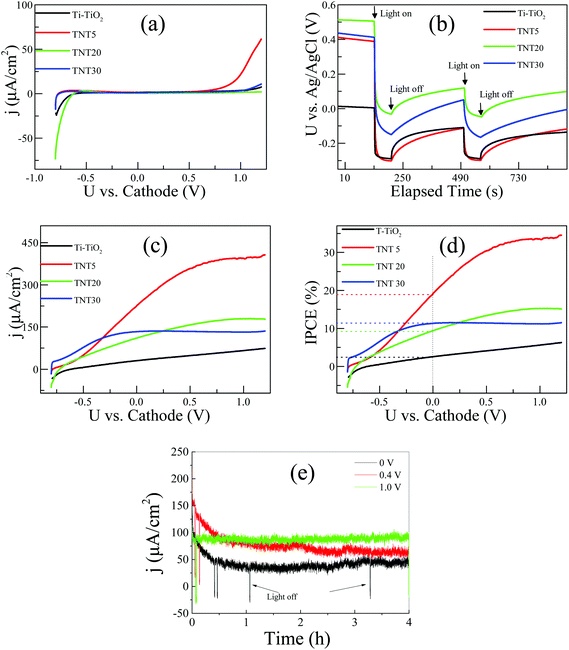
Fig. 5a shows the polarization curves of the different types of electrodes under dark conditions. In all cases, the electrodes are essentially blocking in the applied voltage range of ca. −0.5 V to +0.6 V vs. cathode. The cathodic currents observed in the potential region below −0.5 V vs. cathode, can be assigned to the reduction of Ti4+ to Ti3+, while the anodic ones (from +0.6 V vs. cathode) to the oxidation of water.23 As the applied potential gets more positive values, the semiconductor reaches inversion, where free electron holes (h+) are created and water is oxidized on the surface of the photoelectrode. It is interesting to observe that the TNT5 electrode shows a ca. 400 mV negative shift in the oxygen evolution onset potential in relation to the rest of the electrodes. This result can be correlated with the relative flat band position of the TNT5 electrode in comparison to the other nanotube electrodes, as given in Fig. 5b, where the open circuit potential in a three-electrode configuration was recorded. In all cases, the OCP shifts upon illumination to more negative potentials, which is expected for an n-type semiconductor. Under illumination its Fermi level moves towards more negative potentials and at sufficiently high illumination intensities its value is expected to reach the flat band potential.24 Therefore, the TNT5 electrode has the most negative relative flat band potential followed closely by T-TiO2, while TNT30 and TNT20 appear at less negative ones, agreeing with the polarization curves of Fig. 5a. On the other hand, it is evident that the T-TiO2 and TNT5 electrodes have similar relative flat band potentials, thus the inversion layer is expected in less positively applied voltages. The high anodic current in the case of the TNT5, as opposed to the T-TiO2, is probably due to the former's higher surface area and better electron mobility, as expected for highly ordered and high aspect ratio materials.25
Fig. 5c shows the polarization curves of the electrodes under the same conditions as those in Fig. 5a, but under illumination. It should be highlighted that 0 V applied voltage implies unassisted water splitting conditions and a 230 μA cm−2 short-circuit photocurrent output was recorded for the TNT5 sample. The longer TNT and T-TiO2 exhibit considerably lower photocurrents with pure water.
In the case of the nanotube electrodes, photocurrent saturation is observed with positively shifting applied voltages. This is attributed to the formation of fully depleted nanotube walls and it is evident that the TNT30 electrode with the thinner walls (∼36 nm), reaches photocurrent saturation earlier than the TNT20 (∼55 nm) and TNT5 (∼63 nm) ones. The thermally treated photoelectrode did not reach limiting photocurrent densities in the recorded potential range, which implies a growing depletion zone following Gärtner's model for a semiconductor under illumination.26
The incident photon-to-current efficiency (IPCE) was calculated according to:
 | (3) |
The stability of the three-layer membrane was tested under three different applied voltages vs. cathode, as given in Fig. 5e. As an example, the TNT30 electrode was chosen and three experiments at 0 V, 0.4 V and 1.0 V vs. cathode for 4 h each were conducted, successively. It can be seen that the three-layer membrane is stable for at least 12 h of continuous operation. In the case of 0 V and 0.4 V vs. cathode, a deterioration of the photocurrent is observed for the first hour of operation, but then the photocurrent stabilises for the rest of the experiment. In the 1.0 V the photocurrent stays constant from the very beginning, a fact that can be attributed to the bigger band bending and more efficient charge separation due to the higher applied voltage.
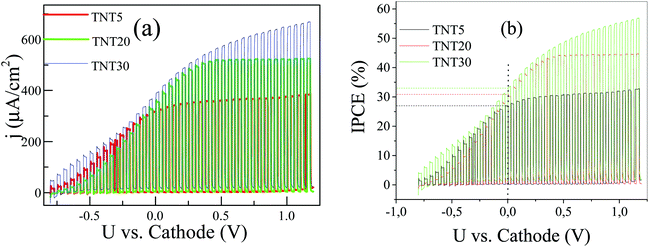
In order to investigate the effect of a supporting electrolyte, we performed the same measurements in the presence of 0.5 M Na2SO4 (Fig. 6a and b). Interestingly, the performances of the TNT of different lengths are largely reversed; now the TNT30 sample appears with the highest photocurrent density in the whole voltage range, followed by TNT20. The overall response of the system is similar to the one under pure water and at 0 V vs. cathode, but the TNT30 reaches approximately 400 μA cm−2 photocurrent density, which is around 3 times higher than in pure water. Similar enhancements are observed for the TNT20 and the TNT5 electrodes. The increase of the photocurrent density is also reflected in the IPCE at 0 V vs. cathode, where 33%, 30% and 27% were recorded for TNT30, TNT20 and TNT5, respectively. It is reasonable to assume that the ionic conductivity – at least locally in and near the electrode structure – is greatly improved in the presence of the supporting electrolyte, therefore the field assisted ionic current towards the cathode is facilitated. These findings suggest that water splitting may take place inside the nanotubes and not only near the outer rim. This is also in agreement with the limited photocurrent densities observed in the polarization curves, suggesting fully depleted nanotube walls.27
4. Conclusions
In conclusion, we have demonstrated a facile fabrication of a thin solid-state PEC cell, in which the anode and cathode are attached to either side of a proton conducting polymer membrane. We investigated the performance of the PEC cell under asymmetric conditions, in which different photoanode electrodes were compared by exposure to pure water and the cathode to ambient air. At 0 V vs. cathode, the PEC cell produced a short-circuit photocurrent density of 230 μA cm−2, using a photoelectrode of short TiO2 nanotubes (TNT). This corresponds to an incident-photon-to current efficiency of 19%. On the other hand, when pure water was replaced with 0.5 M Na2SO4(aq), a photocurrent density of 400 μA cm−2 at 0 V vs. cathode was achieved by using longer TNT, corresponding to an incident-photon-to current efficiency of 33%, assigned to higher ionic conductivity provided by the salt solution inside the tube. Further studies and developments will comprise visible light activated photoanodes, optimization of the solid electrolyte, and production of H2 into a hydrogen atmosphere in the cathode chamber.Acknowledgements
We are grateful to Idun R. Skarbø Osnes who helped conduct the stability tests. The work is partially funded by the Research Council of Norway under the NANO2021 program, project PH2BioCat (239211).References
- A. Fujishima and K. Honda, Electrochemical Photolysis of Water at a Semiconductor Electrode, Nature, 1972, 238(5358), 37–38 CrossRef CAS PubMed.
- R. van de Krol and M. Grätzel, Photoelectrochemical Hydrogen Production, in Electronic Materials: Science & Technology, ed. H. L. Tuller, 2012, Springer, New York, Dordrecht, Heidelberg, London Search PubMed.
- B. A. Pinaud, et al., Technical and economic feasibility of centralized facilities for solar hydrogen production via photocatalysis and photoelectrochemistry, Energy Environ. Sci., 2013, 6(7), 1983–2002 CAS.
- S. Ichikawa and R. Doi, 1st World Conference Environmental Catalysis For a Better World and LifeHydrogen production from water and conversion of carbon dioxide to useful chemicals by room temperature photoelectrocatalysis, Catal. Today, 1996, 27(1), 271–277 CrossRef CAS.
- S. Ichikawa, Chemical conversion of carbon dioxide by catalytic hydrogenation and room temperature photoelectrocatalysis, Energy Convers. Manage., 1995, 36(6–9), 613–616 CrossRef CAS.
- J. Georgieva, et al., An all-solid photoelectrochemical cell for the photooxidation of organic vapours under ultraviolet and visible light illumination, Electrochem. Commun., 2009, 11(8), 1643–1646 CrossRef CAS.
- B. Seger and P. V. Kamat, Fuel Cell Geared in Reverse: Photocatalytic Hydrogen Production Using a TiO2/Nafion/Pt Membrane Assembly with No Applied Bias, J. Phys. Chem. C, 2009, 113(43), 18946–18952 CAS.
- Y. Li, et al., A novel photoelectrochemical cell with self-organized TiO2 nanotubes as photoanodes for hydrogen generation, Int. J. Hydrogen Energy, 2011, 36(22), 14374–14380 CrossRef CAS.
- R. Marschall, et al., Composite proton-conducting polymer membranes for clean hydrogen production with solar light in a simple photoelectrochemical compartment cell, Int. J. Hydrogen Energy, 2012, 37(5), 4012–4017 CrossRef CAS.
- K.-T. Jeng, et al., Membrane electrode assembly-based photoelectrochemical cell for hydrogen generation, Int. J. Hydrogen Energy, 2010, 35(20), 10890–10897 CrossRef CAS.
- K. O. Iwu, et al., Effects of temperature, triazole and hot-pressing on the performance of TiO2 photoanode in a solid-state photoelectrochemical cell, Electrochim. Acta, 2014, 115, 66–74 CrossRef CAS.
- J. M. Spurgeon and N. S. Lewis, Proton exchange membrane electrolysis sustained by water vapor, Energy Environ. Sci., 2011, 4(8), 2993–2998 CAS.
- G. C. Brunauer, et al., UV-Light-Driven Oxygen Pumping in a High-Temperature Solid Oxide Photoelectrochemical Cell, Adv. Funct. Mater., 2016, 26(1), 120–128 CrossRef CAS.
- S. P. Albu, et al., 250 μm long anodic TiO2 nanotubes with hexagonal self-ordering, Phys. Status Solidi RRL, 2007, 1(2), R65–R67 CrossRef CAS.
- V. Zwilling, M. Aucouturier and E. Darque-Ceretti, Anodic oxidation of titanium and TA6 V alloy in chromic media. An electrochemical approach, Electrochim. Acta, 1999, 45(6), 921–929 CrossRef CAS.
- C. A. Grimes and G. K. Mor, TiO2 Nanotube Arrays: Synthesis, Properties and Applications, Springer Science + Business Media, New York, 2009 Search PubMed.
- K. Zhu, et al., Removing Structural Disorder from Oriented TiO2 Nanotube Arrays: Reducing the Dimensionality of Transport and Recombination in Dye-Sensitized Solar Cells, Nano Lett., 2007, 7(12), 3739–3746 CrossRef CAS PubMed.
- D. Kowalski, D. Kim and P. Schmuki, TiO2 nanotubes, nanochannels and mesosponge: Self-organized formation and applications, Nano Today, 2013, 8(3), 235–264 CrossRef CAS.
- F. Fabregat-Santiago, et al., High Carrier Density and Capacitance in TiO2 Nanotube Arrays Induced by Electrochemical Doping, J. Am. Chem. Soc., 2008, 130(34), 11312–11316 CrossRef CAS PubMed.
- G. K. Mor, et al., A review on highly ordered, vertically oriented TiO2 nanotube arrays: Fabrication, material properties, and solar energy applications, Sol. Energy Mater. Sol. Cells, 2006, 90(14), 2011–2075 CrossRef CAS.
- J. M. Macak, et al., Smooth Anodic TiO2 Nanotubes, Angew. Chem., Int. Ed., 2005, 44(45), 7463–7465 CrossRef CAS PubMed.
- K. O. Iwu, et al., Solid-state photoelectrochemical H2 generation with gaseous reactants, Electrochim. Acta, 2013, 97, 320–325 CrossRef CAS.
- A. K. Seferlis and S. G. Neophytides, On the kinetics of photoelectrocatalytic water splitting on nanocrystalline TiO2 films, Appl. Catal., B, 2013, 132–133, 543–552 CrossRef CAS.
- R. Beranek, (Photo)electrochemical Methods for the Determination of the Band Edge Positions of TiO2-Based Nanomaterials, Adv. Phys. Chem., 2011, 2011, 20 Search PubMed.
- Y. Ma, et al., Titanium Dioxide-Based Nanomaterials for Photocatalytic Fuel Generations, Chem. Rev., 2014, 114(19), 9987–10043 CrossRef CAS PubMed.
- W. W. Gärtner, Depletion-Layer Photoeffects in Semiconductors, Phys. Rev., 1959, 116(1), 84–87 CrossRef.
- L. V. Taveira, et al., Impedance Behavior of TiO2 Nanotubes Formed by Anodization in NaF Electrolytes, J. Electrochem. Soc., 2008, 155(6), C293–C302 CrossRef CAS.
| This journal is © The Royal Society of Chemistry and Owner Societies 2017 |

