Effects of morphology on the mechanical properties of heterogeneous polymer-grafted nanoparticle networks†
Tao
Zhang
 ,
Badel L.
Mbanga
,
Victor V.
Yashin
and
Anna C.
Balazs
,
Badel L.
Mbanga
,
Victor V.
Yashin
and
Anna C.
Balazs
 *
*
Chemical Engineering Department, University of Pittsburgh, Pittsburgh, Pennsylvania 15261. E-mail: balazs@pitt.edu
First published on 12th September 2017
Abstract
Using computational modeling, we examine how varying the arrangement of binary mixtures of polymer grafted nanoparticles (PGNs) in a network affects the mechanical properties of the composite. The free ends of the grafted chains on the PGNs contain reactive groups that can form labile bonds with reactive ends on nearby PGNs, and thereby form extensive networks. This bond formation is reversible, with the bonds breaking and reforming at a specified rate. The two types of particles in the network differ in the strength of the labile bonds that they form with their neighbors, forming both relatively strong and weak interconnections. We examine the response of this dynamic network to tensile deformation when the binary PGNs are arranged in an alternating, layered structure or a random mixture. We determine the ultimate tensile properties (strength, toughness), the strain recovery and behavior under cyclic loading for samples with the layered and random architectures. We demonstrate that the layered structures display self-healing behavior and exhibit enhanced mechanical properties relative to the random system. Using our model, we can tune both the spatial and temporal characteristics of the hybrid material. Thus, the approach provides a useful tool for determining how to tailor these parameters to achieve superior mechanical behavior in PGN networks.
Design, System, ApplicationUsing computer modeling, we vary the structure of networks formed from two types of polymer grafted nanoparticles (PGNs). The PGNs are interconnected by dynamic, reversible bonds that break and reform at a specified rate. The binary PGN network is arranged in a layered or random structure. Hence the design space characterizing this system involves both temporal and spatial components. Using the simulations, we probe regions of this design space to facilitate the fabrication of composites with valuable mechanical properties. In particular, we model the response of the layered and mixed structures to a tensile deformation and thus, isolate effects of molecular architecture on the mechanical behavior of the composite. We found that the layered binary PGN networks exhibit superior tensile properties (strain-at-break, toughness) and remarkable resilience in comparison with those of the random binary mixtures. The mechanical properties of the layered networks are attributed to the formation of a new, stable ordered structure when the material is deformed. Overall, our studies indicate how design approaches that explicitly consider the coupling between the temporal and spatial characteristics of the network can facilitate the creation of composites with improved materials properties. |
Introduction
Polymer grafted nanoparticles (PGN) networks combine the flexibility of polymeric chains and the indispensable opto-electronic and mechanical properties of solid nanoparticles. Each PGN encompasses a rigid, spherical core that is decorated with a corona of end-grafted polymers. The free ends of the grafted chains contain reactive functional groups that enable neighboring coronas to form bonds, which crosslink the particles into extensive networks. If these inter-connecting chemical bonds are re-formable (i.e., labile) and the material is subjected to mechanical deformation, then the particles can be “reshuffled” as broken bonds form new connections with new neighbors. In this way, the dynamic, re-formable bonds allow the material to undergo self-healing in response to an applied force and delay the eventual fracture of a sample under deformation.1–5The behavior of dynamic, reversible bonds within PGN networks is now receiving considerable experimental scrutiny.6–9 In particular, researchers are introducing and tailoring the nature of the labile bonds in PGN nanocomposites10 to achieve the unique mechanical properties previously seen only in biological networks.11–15 Interest in such hybrid materials has also inspired researchers to assemble multi-component PGNs into ordered hierarchical structures.16–18 In essence, the nature of the dynamic bonds and the arrangement of the different PGNs in a network provide two distinct design variables for controlling the global properties of the system. Herein, we use computational modeling to determine how the structural arrangement of two different types of polymer grafted nanoparticles within a network, which is interconnected by dynamic bonds, affects the mechanical response of the system. The studies reveal that design on the molecular scale can be harnessed to regulate the overall performance of composite materials. Moreover, the studies indicate how design approaches that explicitly consider the coupling between the temporal and spatial characteristics of the network can facilitate the creation of composites with improved materials properties.
In our previous computational studies,19–24 we investigated the mechanical behavior of networks formed from identical, “I-type” PGNs. We extend our model to simulate the response of networks formed from binary mixtures of “I” and “II”-type PGNs to tensile deformation. The two types of particles differ in the strength of the labile bonds that they form with their neighbors. Hence, the network now encompasses I–I, II–II and I–II types of reversible bonds.
Using computer simulations, we model tensile deformation of samples with different arrangements of the binary particles and thereby attempt to isolate effects of molecular architecture on the mechanical properties of the composite. Herein, we focus on two exemplar arrangements to gain insight into potential effects that the structural arrangement of the components can have on the mechanical behavior. Namely, we compare the behavior of systems containing ordered, layered arrangements of the binary particles to those that encompass a random arrangement of these particles. We quantify the response of the system by calculating the ultimate tensile properties (strain-at-break and toughness), characterizing the structural changes that are induced by deformation, and measuring the response of the system to cyclic loading.
Our simulations indeed show that the different arrangements of the particles play a significant role in the macroscopic performance of the system. In particular, we find that the layered binary PGN networks exhibit superior tensile properties and resilience in comparison with those of the random binary mixtures. Below, we begin by briefly describing the computational model that allowed us to obtain these results.
Methodology
Computational model
We model PGN networks composed of PGNs interlinked through labile chemical bonds. Each PGN consists of a rigid spherical nanoparticle of radius r0 and f polymer chains, which are grafted uniformly to the particle's surface. The system is swollen in a good solvent, and is kept under ambient conditions. The polymers chains are assumed to be in the semi-dilute regime, and form a corona of thickness H = qr0 around the nanoparticle. We use r0 as the unit of length in the simulations, so the corona thickness is q in these units. The free ends of the corona chains contain a functional group. If two PGNs are sufficiently close and their coronas overlap, the functional groups react to form chemical bonds, which interlink the two neighboring particles. The chemical bonds are labile, i.e., they can re-form after rupture.In this study, we consider heterogeneous PGN networks formed with binary mixtures of the PGNs, which differ in the type of reactive functional groups located at the free ends of the grafted polymer chains. PGNs of types I and II are assumed to form the weaker and stronger labile bonds, respectively. Specifically, the bond energy of the weaker labile bonds between PGNs of type I is U(w)0 = 37kBT, and the energy of the stronger labile bonds between PGNs of type II is U(s)0 = 45kBT. The energy of labile bonds formed between PGNs of different types is assumed to be U(w)0 = 37kBT, i.e., type I and type II PGNs are interlinked by the weaker bonds. We study the effects of varying the morphology of such heterogeneous PGN networks on the mechanical properties of the system. Notably, the bond energies considered here lie within the range of energies characteristic of thiol/disulfide exchange reactions25,26 and supramolecular interactions27 that are used for fabricating self-healing polymers.28–30
Interactions between PGNs in the network are assumed to be pairwise. The energy of interaction between two nanoparticles is comprised of the following three distinct contributions: Uint = Urep + Ucoh + Ulink. The first term is the steric repulsion between the coronas described by the potential31–33
 | (1) |
| Ucoh(R) = −U(0)coh{1 + exp[(R − A)/B]}−1 | (2) |
Here, U(0)coh sets the energy scale, and the parameters A and B are the position and width of the attractive well, respectively. This cohesive attraction balances the steric repulsion at the corona edges and hence, allows sufficient overlap between the two coronas that bond formation can occur. The last term, Ulink, is the attractive interaction between the pair of nanoparticles linked by one or more chemical bonds. The force of attraction between the two linked particles is
| Flink(r) = Nbκ(r) r. | (3) |
Here, r = R − 2 is the end-to-end distance of the polymer chains that connect the particles, Nb is the number of bonds linking the two particles, and κ(r) is the stiffness of the spring-like force resulting from chain extension. The stiffness is calculated according to the wormlike chain model35
| κ(r) = kBTR−20{1 + 2[1 − r2(2L)−2]−2}, | (4) |
The number of bonds between the two particles, Nb, that controls the spring-like attraction, eqn (3), changes in time due to the rupture and formation of the labile bonds in the network. The rates of the latter processes, in turn, depend on the inter-particle distance, R. The evolution of the number of bonds is described by the following kinetic equation:
 | (5) |
In eqn (5), kr is the rate constant for the rupture of a labile bond that depends on the force F, which acts on the bond, according to the Bell model,36kr = k(0)r exp(γ0F). Here, k(0)r is the rupture rate constant at zero force, and γ0 is the force sensitivity of the bond. The force acting on the bond is due to extension of the polymer chain and is, therefore, calculated as F(r) = κ(r)r (see eqn (3)). Hence, the rupture rate constant is a function of the inter-particle distance R, and is given as: kr(R) = k(0)r exp[γ0F(R − 2)]. The value of k(0)r depends on the type of bond (i.e., weaker or stronger) because it is determined by the bond energy U0; namely, k(0)r = v0 exp(−U0/kBT), where v0 is the characteristic frequency of the molecular vibration.36 The second term on the right-hand side of eqn (5) describes the bond formation, where kf is the formation rate constant, which is assumed to be independent of the force and the type of bond. The rate of bond formation depends on R though the probability of contact between two chain ends, Pc(R), and the maximal number of chain ends that could be found in the overlap volume of the two coronas, Nmax(R).19 The two coronas overlap at R ≤ (1 + q), and the value is found using purely geometric considerations.19 Finally, the probability of contact, Pc(R), is determined numerically as detailed in ref. 19.
The dynamic behavior of the PGN network in the course of deformation is described by the equations of motion in the overdamped regime. For each particle, the time, t, dependent coordinates x evolve as dx/dt = μFtot, where μ is the mobility, and Ftot = −∂Uint/∂x + Fext is the net force acting on the particle. The equations of motion depend on the numbers of bonds between pairs of particles and, therefore, are coupled to eqn (5), which describes the evolution of the number of bonds for each pair of interlinked PGNs. In turn, the relative motion of two interlinked particles changes the inter-particle distance R and hence, deformation of the sample affects the kinetics of bond rupture and formation, eqn (5).
We employ a two-step procedure to numerically simulate the system's behavior. First, we use the Euler scheme to update the number of bonds between each pair of interlinked particles according to eqn (5). We obtain a real number for this quantity, which is converted to an integer value using a probabilistic procedure,19 and then is used to calculate the spring-like attraction force between the particles according to eqn (3). During the second step, the total force acting on each particle is calculated, and the spatial coordinates of the particles are updated by applying the Euler scheme to the equations of motion. The numerical simulations are performed at a time step of 10−2T0, where T0 is the unit of time specified in Table 1, along with other dimensional units used in this study.
| Length: nanoparticle radius | r 0 = 50 nm |
|---|---|
| Time, t | T 0 = 1.41 × 10⁻² s |
| Velocity, v | v 0 = r0T0−1 = 3.55 μm s−1 |
| Force, F | F 0 = 2.98 pN |
| Toughness, W | F 0 r 0 = 89.74 kJ mol−1 |
The dimensional units, characteristics of PGNs, and parameters of the labile bonds used in the simulations are presented in Tables 1–3, respectively. The values of the model parameters in Tables 1 and 2, and that of γ0 and kf in Table 3 are the same as used in our previous studies, and are typical for PGN networks in a good solvent.19–24 Note that except for the two types of functional groups, all PGNs are identical. In particular, each PGN encompasses a rigid core of radius r0 = 50 nm and has f = 156 grafted chains that form a corona of thickness H = 37.5 nm. The contour and Kuhn lengths of the polymer chains are L ≈ 445 nm and lp = 1 nm, respectively. The mobility of the PGNs is calculated as the inverse of the Stokes drag, μ = [6πηr0(1 + q)]−1, experienced by a particle of radius (1 + q)r0 in a fluid with viscosity η = 0.894 Pa s (viscosity of glycerol). The description of the cohesive attraction through the pseudopotential Ucoh, eqn (2), is purely phenomenological. The cohesive interaction parameters were chosen to attain ∼1% corona overlap at the equilibrium distance between an isolated pair of PGNs without bonds. Finally, the unit of time used in the simulations is T0 = 1.41 × 10⁻² s.
| Corona thickness, q | 0.75 |
| Kuhn length, lp | 1 nm |
| Number of grafted arms, f | 156 |
| Arm contour length, L | 8.89r0 |
| Chain spring constant, κ0 | 7.81 × 10⁻²F0r0−1 |
| Repulsion parameter, σ | 3.02r0 |
| Cohesion parameters | U (0)coh = 60kBT; A = 1.15σ; B = 0.08σ |
| Mobility of PGN, μ | 0.57v0F0−1 |
| Pulling velocity, vp | 10−3v0 |
| Bond parameters | Weaker bond | Stronger bond |
|---|---|---|
| Bond energy, U0 | 37kBT | 45kBT |
| Rupture rate at F = 0, k(0)r | 1.20 × 10⁻⁵T0−1 | 4.03 × 10⁻⁹T0−1 |
| Bond sensitivity, γ0 | 6F0−1 | 6F0−1 |
| Formation rate, kf | 30T0−1 | 30T0−1 |
Computer simulations
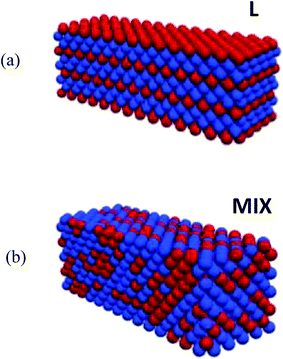
The samples of PGN networks that we model in this study consist of N = 1400 particles. During initialization, the particles are arranged into a face-centered cubic (FCC) lattice structure, and form a rectangular parallelepiped, with the size 14 × 10 × 10 particles along the length, height, and width of the sample, respectively. There are two types of the PGNs in the system, as described above. The samples contain 60% of type I particles that form the weaker labile bonds, and 40% of type II particles that form the stronger labile bonds.In order to uncover the effects of heterogeneity on the mechanical properties of the PGN networks, we consider two types of initial spatial distributions of type I and type II particles within a sample. These two initial structures are shown schematically in Fig. 1, where type I and type II particles are marked with the blue and red colors, respectively. First, we consider the initially ordered PGN networks that are composed of the alternating layers of type I or type II particles as shown in Fig. 1a; this configuration is referred to as “L”. Specifically, in the L samples, there are four 14 × 10 × 1 layers of type II particles (forming the stronger bonds) that span the samples lengthwise. The second initial morphology considered here is a random mixture of the two types of PGNs and is referred to as “MIX” in Fig. 1b. In the MIX samples, the stronger bonds form an irregular cluster that percolates throughout the entire network (the fraction of stronger bonds is approximately 0.26 in our MIX samples, whereas the bond percolation threshold is 0.12 for FCC lattices37). By modeling the L and MIX samples, we can elucidate how the structure of the clusters formed by the stronger bonds (ordered vs. irregular) affects the mechanical properties of the heterogeneous PGN networks.
After placing the PGNs into the initial structure of a sample, the particles are held immobile for a period of time equal to 4 × 10³T0; during this time period, the labile bonds are formed between the PGNs. Then, the mobility of the particles is “switched on”, and the PGN network is equilibrated (with no applied external force) for a period of time equal to 1.6 × 10⁴T0. Upon equilibration, the system is subjected to a strain-controlled tensile deformation. In particular, the right end of sample is held fixed, and the left end is pulled at a constant velocity of v = 3.55 nm s−1 along the long axis of the sample. The latter value of the pulling velocity is comparable to those used in single molecule pulling experiments.38 The values characterizing the mechanical properties of the PGN networks are determined by averaging over eight independent runs of the simulations. Note that due to finite size effects, the mechanical properties depend on the size and shape of a sample. Therefore, the simulations are used to compare samples of the same initial geometry.
The strain at break and toughness are determined from the simulations by stretching a sample until it breaks. The toughness is defined as the work to break (area under the force-strain curve) per one particle. The strain recovery in the PGN networks is determined by applying the strain-controlled tensile deformation up to the maximal strain of εmax = 0.6, after which the force is released at a linear rate during a time 104T0. The residual strain is recorded at the moment of time when the force is reduced to zero. The subsequent strain relaxation is monitored during 2.5 × 10⁵T0 at zero force.
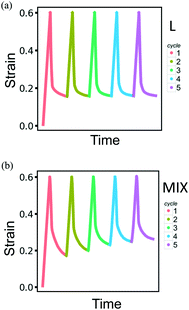
The behavior of the PGN networks under cyclic loading and unloading is studied using the following protocol. Each cycle consists of the consecutive strain-controlled deformation up to the maximal strain εmax = 0.6 at the velocity of pulling vp (Table 2), force-controlled unloading at a constant rate during 104T0, and relaxation at zero force during 7.5 × 10⁴T0. The values of the strain at break and toughness of the PGN networks are determined after each cycle of loading and unloading.
Results and discussion
Mechanical behavior
We first perform simulations of the strain-controlled tensile deformation of the heterogeneous PGN networks. Fig. 2 shows the force-strain curves obtained for L (cyan) and MIX (pink) networks that are deformed until breakage, i.e., until a network fractures into two disjoint parts. The strain ε is defined as the ratio of elongation to the initial length of a sample. The values of the strain at break, εb, and toughness, W, determined by this ultimate elongation test for the two types of networks are presented in Table 4.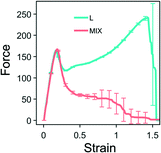 | ||
| Fig. 2 Force-strain curves for the layered (cyan) and randomly mixed (pink) samples. Averaged values are calculated based on eight runs of simulations. The unit of force is F0 = 2.98 pN – see Table 1. | ||
| Morphology | Strain at break, εb | Toughness, W |
|---|---|---|
| MIX | 1.101 ± 0.195 | 0.056 ± 0.008 |
| L | 1.519 ± 0.038 | 0.172 ± 0.007 |
Fig. 2 demonstrates that the two heterogeneous networks, which have the identical overall compositions and differ in morphologies, exhibit the same tensile behavior only until they reach the yield point at the strain of approximately 0.2. After yielding, the behaviors of the layered and randomly mixed networks are qualitatively different. The networks composed of random mixtures of PGNs behave like ductile solids. After the yield point, the force decreases monotonically with further elongation until breakage (see the pink-colored line in Fig. 2). The MIX samples fail within the range of strain from 0.8 to 1.5, and averaging gives the strain at break at εb ≈ 1.1.
In contrast, the layered PGN networks soften after the yield point only up to the strain of ε ≈ 0.25; after that point, the force increases monotonically with strain until the sample breaks (see the cyan-colored line in Fig. 2). The fracture of the L networks occurs at the strain of εb ≈ 1.52. Hence, we observe that the strain at break of the L samples is greater than that of the MIX samples, whereas the variability in εb is lower for the ordered material than the random samples. Because of the stiffening at higher strains and the greater strain at break, the toughness, W, of L networks is three times greater than W for the MIX networks (Table 4).
The difference between the ultimate tensile properties of the MIX and L networks is due to the different spatial arrangements of the stronger and weaker labile bonds within the samples. In the randomly mixed samples, the stronger bonds form an irregularly-shaped percolation cluster, with an uneven density of stronger bonds. It is evident from the simulations that the MIX samples tend to break through regions having a low density of the stronger bonds (not shown). In the layered networks, however, the stronger bonds are arranged in layers parallel to the direction of pulling. Hence, all the stronger bonds participate equally in supporting the integrity of a sample at higher strains. Hence, the L networks exhibit better tensile properties than the MIX ones.
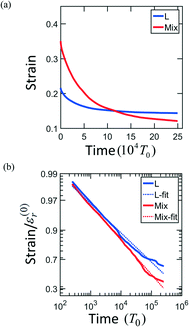
The strain recovery behaviors are also different in L and MIX networks. In order to determine how the PGN networks behave upon release of the tensile load, the samples are stretched up to the maximal strain εmax = 0.6, and then the force is reduced to zero at a constant rate. The networks of the L and MIX structures exhibit the residual strains (recorded at the moment of complete force release) of 0.22 and 0.37, respectively. The relaxation processes continue in the networks at zero force. Fig. 3a shows that after relaxation for a period 2.5 × 10⁵T0, the strains in the L and MIX networks decrease to the respective values of approximately 0.15 and 0.13. The strain relaxation is slow, and the relaxation kinetics can be approximately described by the stretched exponential functions of time shown in Fig. 3b.
Deformation-induced restructuring
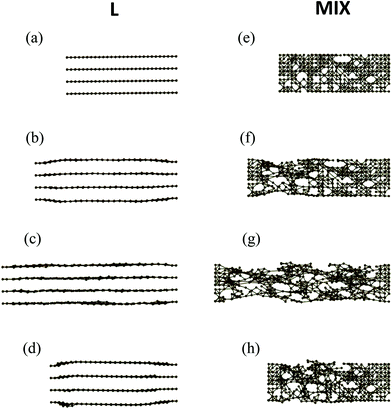
An inspection of the morphology of the PGN networks in the course of tensile deformation reveals that after the yield point, the structural evolutions of the L and MIX networks are qualitatively different. Fig. 4 shows the snapshots of clusters (side view) formed by the stronger bonds in the two types of heterogeneous networks as obtained during the simulations of strain recovery (see above).Before deformation (ε = 0), the stronger bonds form four flat layers parallel to the direction of pulling in the L network (Fig. 4a), and an irregular cluster that percolates throughout the entire sample in the MIX network (Fig. 4e). After the yield point, at the strain of ε = 0.3, the stronger layers in the L network are no longer flat as the inter-layer distance increases in the middle of the sample (Fig. 4b). Note that the strain ε = 0.3 corresponds to the position of the minimum in the force-strain curve for L samples (see cyan-colored curve in Fig. 2). In contrast to the L sample, the percolation cluster in the middle of the MIX sample is deformed uniformly in the transverse direction at ε = 0.3 (Fig. 4f). At the maximal strain εmax = 0.6 (Fig. 4c), the stronger layers in the L network are unbroken and almost flat. The percolation cluster in MIX sample is also unbroken at εmax = 0.6 but exhibits voids that have grown where the network lacks the stronger bonds (Fig. 4g). Finally, upon force release and relaxation, the distance between the stronger layers in the middle of the L sample (Fig. 4d) is again greater than that before deformation (Fig. 4a), whereas the percolation cluster relaxes, albeit partially, towards the initial one in the MIX sample (Fig. 4h).
The more striking effect of tensile deformation on the morphology of the L networks is seen in Fig. 5a and b, which show the top views of two midsection layers in a sample before and after the deformation and relaxation, respectively. One of the layers consists of particles forming the stronger labile bonds (marked by red), and the other layer consists of PGNs that form the weaker bonds (marked by blue). The slice of un-deformed L sample exhibits two staggered square lattices of the red- and blue-colored particles, and the latter arrangement is due to the initial FCC structure and regular placement of the two types of particles (Fig. 5a). After extension up to εmax = 0.6, force release, and relaxation, the red- and blue-colored particles in the middle part of the sample are seen to be arranged into hexagonal lattices, which are shifted relative to each other (Fig. 5b). Furthermore, the width of the sample is lower in the middle than near the ends (Fig. 5b). Hence, the tensile deformation causes an anisotropic change of the sample shape, as the expansion in the layers along the pulling direction (Fig. 4d) is accompanied by a narrowing of the layers normal to this direction (Fig. 5b).
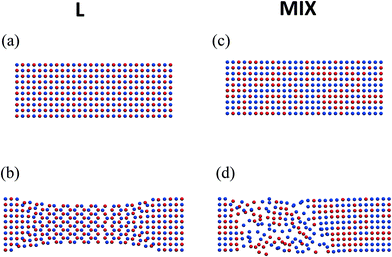 | ||
| Fig. 5 Top view on two layers in the middle of the layered (left column) mixed (right column) PGN networks (a) and (c) before deformation, and (b) and (d) after deformation followed by relaxation. Coloring of particles is the same as in Fig. 1. | ||
The randomly mixed binary PGN networks do not exhibit the change of structure described above. Fig. 5c and d show the respective top views of two layers taken from the midsection of a MIX sample before and after deformation and relaxation. Stretching up to εmax = 0.6 and the subsequent relaxation transform the initial regular, rectangular-shaped square lattice with a random distribution of red- and blue-colored particles (Fig. 5c) into a distorted lattice (Fig. 5d). The area on the right in Fig. 5d retains the same local structure upon relaxation as in the un-deformed sample. On the hand, the area on the left (closer to the end that is pulled) contains defects that have not healed upon relaxation. Thus, it is evident from a comparison of Fig. 5b and d that the evolution of structure caused by tensile deformation is qualitatively different in the ordered (L) and disordered (MIX) binary PGN networks.
We demonstrated previously that in PGN networks encompassing just one type of particle, the tensile deformation induces re-structuring of the metastable hexagonal close packed (HCP) system into the more stable FCC structure.24 Here, persistence of the regular morphology shown in Fig. 4d and 5b signifies that the tensile deformation of L binary PGN network induces a transformation of the initial, metastable FCC lattice into some other ordered structure.
In order to characterize the newly formed structure, we first determine the radial distribution functions (RDF) for the PGN networks in the un-deformed state and after deformation at εmax = 0.6 and relaxation. The procedure for computing the RDF is detailed in our previous work.24Fig. 6a shows the RDFs, ρ(r), for the un-deformed L and MIX networks, i.e., after initialization in the FCC configuration followed by equilibration. The two RDFs coincide with each other and correspond to the FCC structure of the PGN networks (Fig. 6a). After deformation and relaxation, the RDF of the L network exhibits two new distinctive peaks, which indicate the formation of a new spatial order (Fig. 6b). For the MIX network, however, the RDF after deformation and relaxation exhibits the same FCC peaks, which have now broadened; this broadening indicates a distortion of the original structure (Fig. 6c).
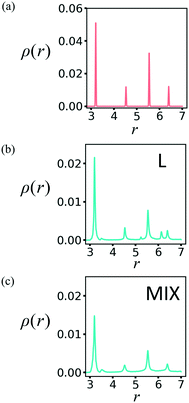 | ||
| Fig. 6 Radial distribution function in the PGN networks (a) before deformation, and after deformation and relaxation of the (b) layered and (c) mixed samples. | ||
More detailed information about the short-range order in the PGN networks is provided by the so-called “bond-orientational order parameters”, which are used extensively for studying phase transitions in liquids and ordering in particle assemblies.39–41 A bond-orientational order parameter is a rotationally-invariant scalar quantity, which characterizes the spatial orientation of the line segments (“bonds”) that connect a given particle to its neighbors. Specifically, for particle i connected to n neighbors, the “bond” between particle i and the neighboring particle j is characterized by the spherical angles θij and φij. The order parameter ql, where l is a positive integer, for the particle i is calculated as
 | (6) |
Here, N(i) is the neighborhood of particle i, and Ylm are the spherical harmonics.
We employ the bond-orientational order parameters q4 and q6 to characterize the local structure in the PGN networks. To calculate the two bond-orientational order parameters, we select a region of size 8 × 8 × 8 = 512 PGNs located in the middle of a sample where the edge effects are minimal. The neighborhood of a particle is defined as the particles located at the distance r ≤ 4. The values of q4 and q6 are calculated using eqn (6) for each particle in the selected region for eight independent runs of the simulation, and then the corresponding histograms are generated using a bin size of 0.005.
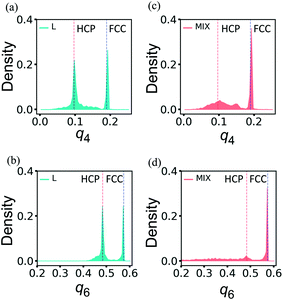
The distributions of q4 and q6 obtained for un-deformed L and MIX samples exhibit narrow single peaks at q4 ≈ 0.190 and q6 ≈ 0.575 (not shown here) that are the known values for the perfect FCC structure.39–41 After the deformation up to εmax = 0.6 followed by the force release and relaxation, the distributions of the order parameters q4 and q6 widen and become quite different in L and MIX networks (Fig. 7).
As seen in Fig. 7a and b, the distributions of the respective order parameters q4 and q6 in the L samples have two peaks of about the same height. One of the two peaks is located at the position characteristic for the FCC ordering, i.e., q4 ≈ 0.190 in Fig. 7a and q6 ≈ 0.575 in Fig. 7b, as in the un-deformed networks. The newly formed peaks are located at q4 ≈ 0.097 in Fig. 7a and q6 ≈ 0.484 in Fig. 7b, and the latter values of the order parameters are characteristic of the HCP ordering.39–41 Hence, analysis of the bond-orientational order parameters reveals that the tensile deformation of the L network leads to formation of a complicated structure, which is a mixture of the HCP and FCC local orderings. Visual inspection of the PGN network images suggests that the particles forming the stronger bonds tend to maintain the FCC local ordering in the re-ordered L networks, and the particles forming the weaker bonds exhibit the FCC or HCP ordering, depending on the particular run of the simulation (see the ESI†).
In contrast to the L networks, the short-range order in the MIX networks after deformation and relaxation shows deviations that are centered about the original FCC structure. The latter observation is evident from Fig. 7c and d, which show that the distributions of the respective order parameters q4 and q6 are dominated by peaks that are characteristic of local order in the FCC structure.
In the section below, we show that the different deformation-induced changes in the structures of the layered and randomly mixed binary PGN networks leads to distinctive behavior of these systems when they are subjected to repetitive loading and unloading.
Cyclic loading
Modeling the behavior of the binary PGN networks under cyclic loading and unloading allows us to uncover the effects of network morphology on the formation and healing of defects. The accumulation of defects that are formed during deformation causes a deterioration of the mechanical properties of the networks. The resilience of the networks depends on the extent to which the defects are healed during the relaxation at zero force between two consecutive cycles of deformation.For both L and MIX networks, we performed simulations of five cycles of loading and unloading. Each cycle consists of strain-controlled loading up to εmax = 0.6 at the velocity of pulling νp, force-controlled unloading at a constant rate during a time period of 104T0, and relaxation at zero force during 7.5 × 10⁴T0. Fig. 8 shows strain as a function of time for L (Fig. 8a) and MIX (Fig. 8b) samples; the curves are obtained by averaging over eight independent runs of the simulations. At the end of each cycle, the L networks exhibit almost the same value of strain (Fig. 8a), whereas the value of the residual strain increases from cycle to cycle in the MIX networks (Fig. 8b). The latter observation indicates that the layered binary networks are more resilient than the randomly mixed ones.
The resilience of the L networks is better seen in Fig. 9, which shows the force-strain curves obtained from the above simulations for the L (Fig. 9a) and MIX (Fig. 9b) networks. The force-strain loops overlap after the first cycle of loading and unloading for the L networks, with the tensile strength (maximal force) being comparable to that of the initial network (Fig. 9a). No further increase in the residual strain is observed in L networks, as can be seen through the cyan-colored line in Fig. 10a.
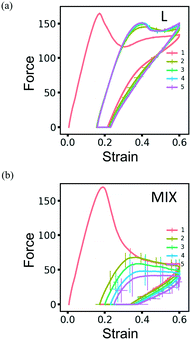 | ||
| Fig. 9 The force-strain curves obtained during simulations of cyclic loading of the (a) layered and (b) mixed PGN networks. The consecutive cycles are marked by color as in Fig. 8. The shown curves are obtained by averaging over eight runs of simulations. The unit of force is F0 = 2.98 pN – see Table 1. | ||
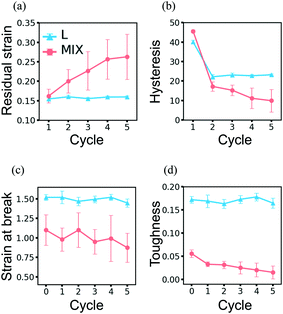 | ||
| Fig. 10 Evolution of properties of the layered (cyan) and mixed (pink) PGN networks under the cyclic deformations. (a) Residual strain. (b) Hysteresis. (c) Strain-at-break. (d) Toughness. In (c) and (d), cycle 0 represents the initial network properties shown in Table 4. | ||
The networks of randomly mixed particles exhibit inferior resilience in comparison to the L samples. Fig. 9b shows that the defects created in MIX networks during the first cycle of loading do not relax, so the tensile strength during the second loading is almost three times lower than during the first one. The tensile strength continues to decrease with every consecutive cycle (Fig. 9b); simultaneously, there is a gradual increase in the residual strain, as shown by the pink-colored line in Fig. 10a.
Another measure of the extent of damage that occurs in a PGN network is provided by the hysteresis, ΔW, i.e., the amount of energy dissipated in the course of one cycle of loading and unloading (Fig. 10b). The hysteresis does not change for a network that does not experience permanent structural change and therefore recovers perfectly. Fig. 10b shows that the hysteresis of the L networks does not change after cycle 2 (cyan-colored line), i.e., after the restructuring of the network during the first cycle. In contrast, the hysteresis of the MIX networks decreases from cycle to cycle as damage is accumulated (see the pink-colored line in Fig. 10b).
The superior resilience of the layered binary PGN networks is due to the deformation-induced restructuring of the PGN network discussed above. During the cyclic loading, the restructuring occurs during the first cycle. The newly formed structure is stable and can withstand further cycles of deformation without degradation. Fig. 11 shows the distributions of the bond-orientational q4 and q6 order parameters in L samples after the first (Fig. 11a and b) and fifth (Fig. 11c and d) cycles of deformation. At the end of the first cycle, the initial FCC-ordered network is transformed to a mixture of the FCC and HCP structures (Fig. 11a and b). The distributions of q4 and q6 after the fifth cycle in Fig. 11c and d, respectively, are very close to those in Fig. 7a and b, which are obtained after one cycle of deformation followed by relaxation for a long period of time (see above).
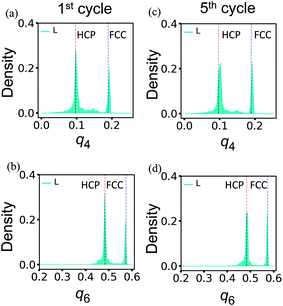 | ||
| Fig. 11 The bond-orientational distribution functions (a) and (c) q4, and (b) and (d) q6 for the layered PGN networks after the first (left column) and fifth (right column) cycles of deformation. Other notations are as in Fig. 7. | ||
Due to the stability of the newly formed structure, the ultimate tensile properties of L networks do not change noticeably in the course of cycling loading. Fig. 10c and d show the respective strain-at-break and toughness of L and MIX samples obtained after a given number of deformation cycles. The data points at cycle 0 present the properties of the initial samples shown in Table 4. It is evident in Fig. 10c and d (cyan-colored lines) that the L networks exhibit the same strain-at-break and toughness before and after loading. The toughness of MIX networks, however, decreases after each cycle of deformation; this behavior indicates the progressive deterioration of the samples (pink-colored lines in Fig. 10d). Although the strain-at-break of the MIX networks remains almost the same (pink-colored lines in Fig. 10c), the noticeably high scattering of data suggests the presence of a large number of defects.
Conclusions
We used 3D computer simulations to study the behavior of binary PGN networks under tensile deformations. The two types of PGNs differ in the strength of labile chemical bonds that they form with neighboring particles. We compare the mechanical behavior of the binary PGN networks, in which the particles forming the stronger labile bonds are either arranged in layers or randomly distributed throughout a sample. We demonstrate that in comparison with the randomly mixed networks, the PGN networks having the layered morphology exhibit the superior tensile properties (strain-at-break, toughness) and remarkable resilience under cyclic loading.We showed that the local ordering in the layered PGN networks changes under the extension. Namely, after yielding, the initial FCC lattice transforms into a mixture of the FCC and HCP structures. The newly formed structure is stable, and no further re-ordering takes place in the course of repetitive deformations. Thus, the observed remarkable mechanical behavior of the layered PGN networks could be attributed to the formation of this new structure.
The computational framework developed in this study allows us to tune both the spatial and temporal characteristics of the hybrid material. Namely, we can vary the bond energies and hence, the rates of bond formation and rupture. Thus, the model provides a useful tool for determining how to tune these parameters to achieve superior mechanical behavior in PGN networks. Our approach allows one to generate phase maps where the temporal and spatial coordinates form different axes of the phase space; such studies are beyond the scope of the present work, but will form the basis of future studies. Finally, we note that methods have emerged to fabricate PGN networks with a range of ordered, heterogeneous structures16–18 and relevant interaction energies.10 Hence, our results can provide useful guidelines for tailoring the strength and resilience of such nanocomposites.
Conflicts of interest
There are no conflicts to declare.Acknowledgements
ACB gratefully acknowledges financial support from the Air Force Office of Scientific Research through Award FA9550-15-1-0316.References
- K. E. Mueggenburg, X.-M. Lin, R. H. Goldsmith and H. M. Jaeger, Nat. Mater., 2007, 6, 656–660 CrossRef CAS PubMed.
- P. Akcora, H. Liu, S. K. Kumar, J. Moll, Y. Li, B. C. Benicewicz, L. S. Schadler, D. Acehan, A. Z. Panagiotopoulos, V. Pryamitsyn, V. Ganesan, J. Ilavsky, P. Thiyagarajan, R. H. Colby and J. F. Douglas, Nat. Mater., 2009, 8, 354–359 CrossRef CAS PubMed.
- M. McEwan and D. Green, Soft Matter, 2009, 5, 1705–1716 RSC.
- P. Voudouris, J. Choi, N. Gomopoulos, R. Sainidou, H. Dong, K. Matyjaszewski, M. R. Bockstaller and G. Fytas, ACS Nano, 2011, 5, 5746–5754 CrossRef CAS PubMed.
- J. Choi, C. M. Hui, J. Pietrasik, H. Dong, K. Matyjaszewski and M. R. Bockstaller, Soft Matter, 2012, 8, 4072–4082 RSC.
- G. A. Williams, R. Ishige, O. R. Cromwell, J. Chung, A. Takahara and Z. Guan, Adv. Mater., 2015, 27, 3934–3941 CrossRef CAS PubMed.
- K. Haraguchi, K. Uyama and H. Tanimoto, Macromol. Rapid Commun., 2011, 32, 1253–1258 CrossRef CAS PubMed.
- T. Engel and G. Kickelbick, Polym. Int., 2014, 63, 915–923 CrossRef CAS.
- R. Vaiyapuri, B. W. Greenland, H. M. Colquhoun, J. M. Elliott and W. Hayes, Polym. Chem., 2013, 4, 4902 RSC.
- Q. Li, D. G. Barrett, P. B. Messersmith and N. Holten-Andersen, ACS Nano, 2016, 10, 1317–1324 CrossRef CAS PubMed.
- D. G. Barrett, D. E. Fullenkamp, L. He, N. Holten-Andersen, K. Y. C. Lee and P. B. Messersmith, Adv. Funct. Mater., 2013, 23, 1111–1119 CrossRef CAS PubMed.
- N. Holten-Andersen, M. J. Harrington, H. Birkedal, B. P. Lee, P. B. Messersmith, K. Y. C. Lee and J. H. Waite, Proc. Natl. Acad. Sci. U. S. A., 2011, 108, 2651–2655 CrossRef CAS PubMed.
- A. Hagenau, H. A. Scheidt, L. Serpell, D. Huster and T. Scheibel, Macromol. Biosci., 2009, 9, 162–168 CrossRef CAS PubMed.
- R. A. Burton, M. J. Gidley and G. B. Fincher, Nat. Chem. Biol., 2010, 6, 724–732 CrossRef CAS PubMed.
- J. Wang, Q. Cheng and Z. Tang, Chem. Soc. Rev., 2012, 41, 1111–1129 RSC.
- I. Kosif, K. Kratz, S. S. You, M. K. Bera, K. Kim, B. Leahy, T. Emrick, K. Y. C. Lee and B. Lin, ACS Nano, 2017, 11, 1292–1300 CrossRef CAS PubMed.
- D. Y. Lee, J. T. Pham, J. Lawrence, C. H. Lee, C. Parkos, T. Emrick and A. J. Crosby, Adv. Mater., 2013, 25, 1248–1253 CrossRef CAS PubMed.
- H. S. Kim, C. H. Lee, P. K. Sudeep, T. Emrick and A. J. Crosby, Adv. Mater., 2010, 22, 4600–4604 CrossRef CAS PubMed.
- B. V. S. Iyer, I. G. Salib, V. V. Yashin, T. Kowalewski, K. Matyjaszewski and A. C. Balazs, Soft Matter, 2013, 9, 109–121 RSC.
- M. J. Hamer, B. V. S. Iyer, V. V. Yashin, T. Kowalewski, K. Matyjaszewski and A. C. Balazs, Soft Matter, 2014, 10, 1374–1383 RSC.
- B. V. S. Iyer, V. V. Yashin and A. C. Balazs, New J. Phys., 2014, 16, 75009 CrossRef.
- B. V. S. Iyer, V. V. Yashin, M. J. Hamer, T. Kowalewski, K. Matyjaszewski and A. C. Balazs, Prog. Polym. Sci., 2015, 40, 121–137 CrossRef CAS.
- B. V. S. Iyer, V. V. Yashin, T. Kowalewski, K. Matyjaszewski and A. C. Balazs, Polym. Chem., 2013, 4, 4927–4939 RSC.
- M. J. Hamer, B. V. S. Iyer, V. V. Yashin and A. C. Balazs, Nano Lett., 2014, 14, 4745–4750 CrossRef CAS PubMed.
- J. Liang and J. M. Fernández, ACS Nano, 2009, 3, 1628–1645 CrossRef CAS PubMed.
- P. Nagy, Antioxid. Redox Signaling, 2013, 18, 1623–1641 CrossRef CAS PubMed.
- D. B. Varshey, J. R. G. Sander, T. Friscic and L. R. MacGillivray, in Supramolecular chemistry: from molecules to nanomaterials, ed. P. A. Gale and J. W. Steed, John Wiley & Sons, Ltd, Chichester, UK, 2012, pp. 9–24 Search PubMed.
- J. A. Yoon, J. Kamada, K. Koynov, J. Mohin, R. Nicolaÿ, Y. Zhang, A. C. Balazs, T. Kowalewski and K. Matyjaszewski, Macromolecules, 2012, 45, 142–149 CrossRef CAS.
- T. Rossow and S. Seiffert, Adv. Polym. Sci., 2015, 268, 1–46 CrossRef CAS.
- M. Enke, D. Döhler, S. Bode, W. H. Binder, M. D. Hager and U. S. Schubert, Adv. Polym. Sci., 2016, 273, 59–112 CrossRef CAS.
- C. N. Likos, H. Löwen, M. Watzlawek, B. Abbas, O. Jucknischke, J. Allgaier and D. Richter, Phys. Rev. Lett., 1998, 80, 4450 CrossRef CAS.
- A. Jusufi, M. Watzlawek and H. Löwen, Macromolecules, 1999, 32, 4470–4473 CrossRef CAS.
- M. Daoud and J. P. Cotton, J. Phys., 1982, 43, 531–538 CAS.
- F. Lo Verso, C. N. Likos and L. Reatto, Prog. Colloid Polym. Sci., 2006, 133, 78–87 CAS.
- A. V. Dobrynin and J.-M. Y. Carrillo, Macromolecules, 2010, 44, 140–146 CrossRef.
- G. I. Bell, Science, 1978, 200, 618–627 CAS.
- C. D. Lorenz and R. M. Ziff, Phys. Rev. E: Stat. Phys., Plasmas, Fluids, Relat. Interdiscip. Top., 1997, 57, 230–236 CrossRef.
- A. P. Wiita, S. R. K. Ainavarapu, H. H. Huang and J. M. Fernandez, Proc. Natl. Acad. Sci. U. S. A., 2006, 103, 7222–7227 CrossRef CAS PubMed.
- P. J. Steinhardt, D. R. Nelson and M. Ronchetti, Phys. Rev. B: Condens. Matter Mater. Phys., 1983, 28, 784–805 CrossRef CAS.
- W. Lechner and C. Dellago, J. Chem. Phys., 2008, 129, 114707 CrossRef PubMed.
- K. Kawasaki, H. Katsuno and M. Sato, J. Phys. Soc. Jpn., 2017, 86, 64601 CrossRef.
Footnote |
| † Electronic supplementary information (ESI) available. See DOI: 10.1039/c7me00071e |
| This journal is © The Royal Society of Chemistry 2017 |

