Molecular dynamics study of CO2 absorption and desorption in zinc imidazolate frameworks†
Min
Gao‡
a,
Alston J.
Misquitta
a,
Chenxing
Yang§
a,
Ilian T.
Todorov
b,
Andreas
Mutter¶
c and
Martin T.
Dove
*a
aSchool of Physics and Astronomy, and Materials Research Institute, Queen Mary University of London, Mile End Road, London, E1 4NS, UK. E-mail: martin.dove@qmul.ac.uk
bScientific Computing Department, STFC Daresbury Laboratory, Sci-Tech Daresbury, Keckwick Lane, Daresbury, Cheshire WA4 4AD, UK
cDepartment of Earth Sciences, University of Cambridge, Downing Street, Cambridge, CB2 3EQ, UK
First published on 19th July 2017
Abstract
We report a study of the absorption of CO2 into a number of zinc imidazolate framework structures, and subsequent desorption, using the molecular dynamics simulation method with force fields partly developed by ourselves. The simulations primarily give results concerning the mechanism of CO2 absorption under conditions likely to be found in industrial waste gas streams. In particular we compare the rate of uptake of CO2 for different ZIFs. We also show that it is possible to observe desorption by reduced pressure and high temperature. These characteristics confirm that ZIFs might be suitable for CO2 absorption within an industrial capture and sequestration process.
Design, System, ApplicationZIFs have been proposed as materials for CO2 gas capture. We have developed a new simulation model and strategy to study CO2 absorption in such materials, including a new model for CO2 that works in both gas and condensed phases. This method can be adopted to study all kinds of gas absorption in ZIFs and other metal–organic-frameworks. It can also be used to study gas selectivity of MOF membranes. CO2 absorption and de-absorption in a number of ZIFs have been studied. The results help us to understand the mechanism of the interaction between CO2 and the ZIF structure, and to predict the absorption storage for similar structures. We show that ZIFs have great potential for CO2 capture. For future application, a) our work shows that ZIFs have great potential for CO2 capture; b) our method can be more widely used for many future applications. It can speed up studies of gas absorption, gas selection and storage by screening. This helps choosing appropriate MOFs for particular purposes such as toxic gas absorption in power plant, and hydrogen storage and transport for clean power, etc. |
1 Introduction
The problem of the rapid increase of carbon dioxide in the atmosphere is well known, and in order to reduce releases from industrial processes capture and storage solutions have been proposed. One aspect of active consideration is to use porous crystalline materials to absorb CO2 directly from gas streams. Metal–organic framework (MOF) materials1,2 – porous crystalline materials formed as network structures where metal cations are linked together by organic ligands – have attracted a lot of interest in this regard. Their porous structures give the possibility of high molecular absorption capacity,3,4 coupled with a high stability at different temperatures and pressures.In this paper we study the absorption and desorption of CO2 in one class of MOFs, namely the materials with the generic name zeolitic imidazolate frameworks (ZIFs).5 These have the chemical formula Zn(im)2, where im = C3N2H3− or a related ligand. These materials form as networks of zinc cations linked by the im ligands. The angle subtended by the metal–im–metal vectors in many ZIFs (ca. 145°) is very similar to the Si–O–Si angle in silica, SiO2, meaning that the networks are able to form structures whose topologies are either direct analogues of, or related to, siliceous zeolites. Furthermore, the structures formed by these materials can be tailored by changing the metal cation, tuning the exact imidazolate linkage ligands,6 and growing from different solvents. This has led to at least 100 types of ZIFs being found.6,7 Their various porous structures offer the prospect of being exploited for applications in areas such as catalysis, storing gases such as H2, and capture of gases such as CO2.6,8–13
Our approach is to use the molecular dynamics simulation method using empirical force fields, focussing on the ZIFs identified in the first report of these materials.6 In the work reported here we started with a pristine slab of a ZIF in contact with CO2 gas, and applied an appropriate temperature and pressure. The pressure had the effect of pushing the CO2 molecules into the ZIF slab. In this paper we report our observations on the processes by which the CO2 can enter the ZIF slabs from the gas phase, and how the molecules move within the ZIF. Here we will also report the structures formed once maximum capacity has been more-or-less reached. We have performed simulations at different pressures, and we compare the results for the different ZIF systems. We have also investigated the desorption process induced by reduced pressure and increased temperature, but because of technical issues this proved to be rather harder.
In the next section we describe the methods used in this work, including details of the force fields we have developed, and the way we have used the molecular dynamics method in this work. Our simulation results are reported in the subsequent sections. The first set of results concerns the absorption of CO2 into slabs of a range of different ZIFs, looking at both the time scales for absorption and then the CO2 density profiles through the slab. Results are presented for two gas pressures. In order to understand the absorption process the section after considers in more detail the interactions between imidazolate ligands and CO2 molecules. In the penultimate section we discuss the process of de-absorption with reduced pressure and increased temperature, with some conclusions presented in the final section. The ESI† presents more results than can be accommodated in the main paper.
2 Force fields
2.1 Ab initio calculations for parameter fitting
Because of the system sizes and time scales involved in our simulations, this work is only made feasible by using empirical force fields to describe the interactions between atoms. Some aspects of our force fields have been discussed previously.14 Briefly reviewing the ZIF model from our earlier work,14 we note that the force field we have used is a combination of new components based on ab initio calculations and previous highly-successful empirical inter-atomic potentials for organic molecules.15Ab initio DFT calculations for small clusters of zinc cations and ligands were performed using the quantum chemistry program NWChem16,17 with the standard PBE functional,18 and using either aug-cc-pVDZ or aug-cc-pVTZ basis sets depending on system size and following convergence tests. We used the distributed multipole analysis (DMA) method19 as performed by the program CamCASP20 to calculate atomic multipole moments from the electronic wave functions, from which we obtained values for atomic point charges using program MULFIT.21,22
The new interatomic potentials for our force fields were obtained by fitting to the energies for a large suite of atomic configurations obtained from ab initio calculations, also performed using the program NWChem,16,17 but this time using the Møller–Plesset perturbation theory MP2 approximation. As for the DFT calculations, we used aug-cc-pVDZ and aug-cc-pVTZ basis sets. Values for the parameters in the force field equations (see immediately below) were obtained using the fitting procedure with the code GULP.23
2.2 Basic equations in our force field
We used a number of different types of force-field functions to represent different facets of the set of interactions. For interactions between two bonded atoms we used the Morse potential:E(r) = ε(exp(2α(r − r0)) − 2![[thin space (1/6-em)]](https://www.rsc.org/images/entities/char_2009.gif) exp(α(r − r0))) exp(α(r − r0))) | (1) |
| E(θ) = (k/2)(θ − θ0)2 | (2) |
E(ϕ) = A(1 − cos![[thin space (1/6-em)]](https://www.rsc.org/images/entities/char_2009.gif) ϕ) ϕ) | (3) |
For non-bonded interactions, such as between the atoms of different imidazolate ligands for example, we used the standard Buckingham form to represent both the long-range dispersion interaction and the short-range repulsion:
E(rij) = −(Cij/rij6) + Bij![[thin space (1/6-em)]](https://www.rsc.org/images/entities/char_2009.gif) exp(−rij/ρij) exp(−rij/ρij) | (4) |
2.3 Force field models for the zinc imidazolate frameworks
The model for the interactions between the zinc atoms and the imidazolate molecular anions has been described in detail in our previous publication.14 In this work we treat the imidazolate ion as a rigid object with the atoms acting as interaction centres. Charges on both the imidazolate anion and zinc cation were assigned on the basis of DMA calculations of clusters. Similarly cluster calculations were used to parameterise the force fields involving the zinc cation and imidazolate anion. These included a Morse potential to describe the Zn–N bond (eqn (1)), a bond bending potential to describe flexing of the tetrahedral N–Zn–N and the Zn–N–C bond angles (eqn (2)), and an inversion potential (eqn (3)) to align the Zn–N bond within the plane of the imidazolate ligand. The development of these potential functions has been described in detail in our previous paper,14 where the parameters are listed.For interactions between the imidazolate ligands we used the Buckingham potentials (eqn (4)), with parameters taken from the work of Williams.24
2.4 Development and validation of a new force field model for CO2 molecules in condensed and fluid phases
Values for the parameters in the Buckingham potential were obtained by fitting to a mixture of data. We used a suite of ab initio energies calculated for a large number of configurations of pairs of molecules of orientations as shown in Fig. 1. These ab initio energies were calculated using the MP2 method with aug-cc-pVTZ basis sets. We also made use of the crystal structure and phonon dispersion curves of solid CO2 in the fitting procedure, which was carried out using the code GULP.23 We also used Grand Canonical Monte Carlo (GCMC) simulations of the fluid phase diagram to help tune and constrain parameter models.
By this route we were able to tune values for all the parameters. The final set of parameters for our new CO2 model are given in Table 1. Part of this work was briefly described in an earlier paper on fluid CO2,26 but here parameter values have been slightly refined.
| Atom pair | B (kJ mol−1) | ρ (Å) | C (kJ mol−1 Å−6) |
|---|---|---|---|
| C–O | 190![[thin space (1/6-em)]](https://www.rsc.org/images/entities/char_2009.gif) 909 909 |
0.2637 | 1216.21 |
| O–O | 203![[thin space (1/6-em)]](https://www.rsc.org/images/entities/char_2009.gif) 567 567 |
0.2659 | 2149.19 |
| C–C | 108![[thin space (1/6-em)]](https://www.rsc.org/images/entities/char_2009.gif) 347 347 |
0.2778 | 0.0 |
A model for CO2 with non-rigid molecules are also developed and tested. A Morse potential was used for the stretching of the C–O bond, and a potential of form E(ϕ) = K(1 + cos![[thin space (1/6-em)]](https://www.rsc.org/images/entities/char_2009.gif) θ) was used to describe flexing of the O–C–O angle θ; parameter values were tuned to give best agreement with the oft-reported frequencies of the internal molecular vibrations. The highest frequency vibration of the CO2 molecule, namely the asymmetric C–O stretching mode, has a frequency of 70.5 Hz, which is much higher than CO2 intermolecular vibration frequency (4 THz) as shown in Fig. 2, and higher than the highest network flexing frequency of the ZIFs of 14 THz.14 If we scale the timestep by the ratio of frequencies, 14/70.5 ≃ 0.2, we would require computational resources five times greater than we used for the rigid molecule model; given the very large cost of computer time incurred in this work, such an overhead would need significant justification. In the event our tests on the fluid phase diagram showed that the rigid and flexible molecule models gave the same results. Hence only the rigid body model was used here.
θ) was used to describe flexing of the O–C–O angle θ; parameter values were tuned to give best agreement with the oft-reported frequencies of the internal molecular vibrations. The highest frequency vibration of the CO2 molecule, namely the asymmetric C–O stretching mode, has a frequency of 70.5 Hz, which is much higher than CO2 intermolecular vibration frequency (4 THz) as shown in Fig. 2, and higher than the highest network flexing frequency of the ZIFs of 14 THz.14 If we scale the timestep by the ratio of frequencies, 14/70.5 ≃ 0.2, we would require computational resources five times greater than we used for the rigid molecule model; given the very large cost of computer time incurred in this work, such an overhead would need significant justification. In the event our tests on the fluid phase diagram showed that the rigid and flexible molecule models gave the same results. Hence only the rigid body model was used here.
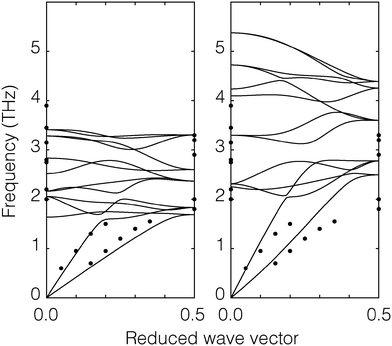 | ||
| Fig. 2 Phonon dispersion curves of CO2. The diagram on the left shows the calculation of our model (continuous curves) and the diagram on the right shows the corresponding calculations using the Potoff and Siepmann model.27 The filled black circles are experiment data from inelastic neutron scattering.29 | ||
| Atom pair | ε (K) | σ (Å) |
|---|---|---|
| C–C | 27.0 | 2.80 |
| O–O | 79.0 | 3.05 |
| C–O | 46.18 | 2.92 |
The crystal structure was taken from the X-ray refinement of Simon and Peters.28 CO2 has Pc3 space group symmetry, with the lattice parameter a = 5.624 ± 0.002 Å. The C–O distance is 1.15 Å. Our structure optimisation performed using GULP gave a lattice parameter 5.624 Å in perfect agreement with the experimental result, whereas the optimised lattice parameter for the Potoff and Siepmann model is 4.998 Å with 11% difference from the experiment. Typically we expect a good empirical model to have an accuracy for the lattice parameters of up to 2% (perfect agreement with experimental data should not be taken too seriously), and so we feel that the Potoff and Siepmann model has too poor level of agreement with experimental data in the crystalline phase.
To test the CO2 model of the solid phase further, the phonon dispersion curves have been calculated using GULP23 and compared with the inelastic neutron scattering data of Dolling et al.29 (phonon measurements were performed for wave vectors along the [1,1,1] direction). Calculated phonon dispersion curves for both the model developed here and from that of Potoff and Siepmann are compared with the experimental data in Fig. 2. The calculations were performed with the relaxed structure. The experimental results were obtained by inelastic neutron scattering. From the figure we can see that our calculated dispersion curves show a good agreement with the experimental data. The results for the two acoustic modes and the range of optical phonon frequencies at wave vectors [0,0,0] and  of our model are close to the experimental data. On the other hand, the phonon frequencies calculated using the Potoff and Siepmann model are systematically too high.
GCMC simulations were performed for a range of temperatures from 200 K to 300 K, using the constant pressure and temperature Gibbs ensemble. The temperature and pressure coexistence lines are shown in Fig. 3 together with the density at the co-existence line. The simulation results show a satisfying agreement with the experiments. Detailed results for the vapour–liquid coexistence point are given in Table 3 and compared with results for the Potoff and Siepmann model. The accuracy of our model is comparable with that of Potoff and Siepmann for the fluid phase diagram, and has the advantage of also handling the crystalline phase much better.
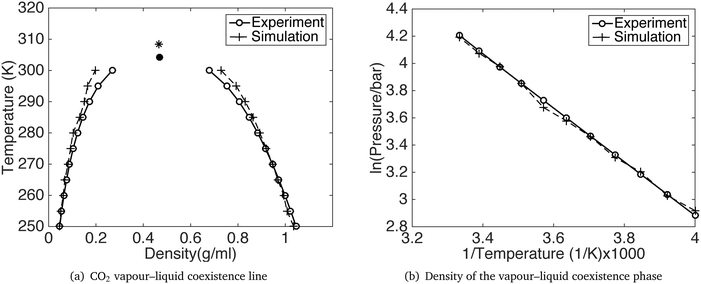 | ||
| Fig. 3 CO2 vapour–liquid coexistence line. The black dot and star is the critical point from experiment30 and our simulation respectively. | ||
| Temperature (K) | Pressure (bar) | Vapour density (g ml−1) | |
|---|---|---|---|
| Experiment | 304.1 | 73.8 | 0.4676 |
| Our model | 308.4 | 80.8 | 0.4670 |
| PS model | 306.2 | 77.7 | 0.4649 |
2.5 Model of inter-molecular forces between CO2 and the ZIF crystal
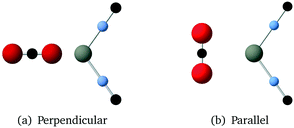
The values for the B and C parameters in the atom–atom Buckingham potentials (eqn (4)) used to describe the interaction between the CO2 molecules and the Zn cations and ZIF ligands were obtained using again the procedure of fitting to a set of ab initio energies for a suite of configuration, as we described for the CO2 molecules. The total energies of the system with different distances were calculated using the MP2 method with aug-cc-pVDZ basis sets (the aug-cc-pVTZ basis sets gave convergence problems). As shown in Fig. 4, one ZIF cluster and one CO2 molecule were placed in different positions, then a set of configurations defined by moving the CO2 molecule away from the ZIF cluster along a parallel direction. This time in the fitting we did not adjust the values of the ρ parameters but instead took these from the transferable potentials of Williams.24 The final fitted parameters in Buckingham potential are given in Table 4.| Atom pair | B (kJ mol−1) | ρ (Å) | C (kJ mol−1 Å−6) |
|---|---|---|---|
| CCO2–CZIF | 106996.4 | 0.278 | 1487.38 |
| CCO2–H | 60![[thin space (1/6-em)]](https://www.rsc.org/images/entities/char_2009.gif) 683 683 |
0.2793 | 713.33 |
| CCO2–N | 103![[thin space (1/6-em)]](https://www.rsc.org/images/entities/char_2009.gif) 366 366 |
0.282 | 1473.04 |
| CCO2–Zn | 1![[thin space (1/6-em)]](https://www.rsc.org/images/entities/char_2009.gif) 417 417![[thin space (1/6-em)]](https://www.rsc.org/images/entities/char_2009.gif) 347 347 |
0.290 | 38015.38 |
| O–CZIF | 163![[thin space (1/6-em)]](https://www.rsc.org/images/entities/char_2009.gif) 495 495 |
0.265 | 1394.10 |
| O–H | 57![[thin space (1/6-em)]](https://www.rsc.org/images/entities/char_2009.gif) 298 298 |
0.266 | 613.98 |
| O–N | 157![[thin space (1/6-em)]](https://www.rsc.org/images/entities/char_2009.gif) 948 948 |
0.269 | 1380.67 |
| O–Zn | 274![[thin space (1/6-em)]](https://www.rsc.org/images/entities/char_2009.gif) 353 353 |
0.275 | 11435.99 |
3 Molecular dynamics simulations
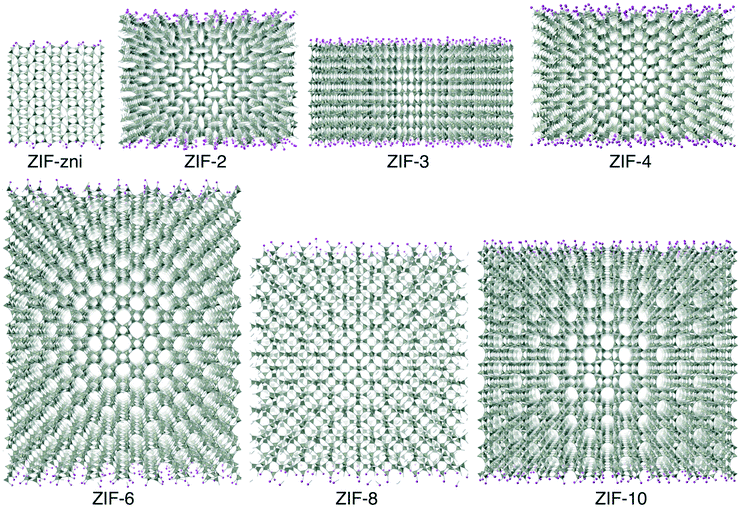
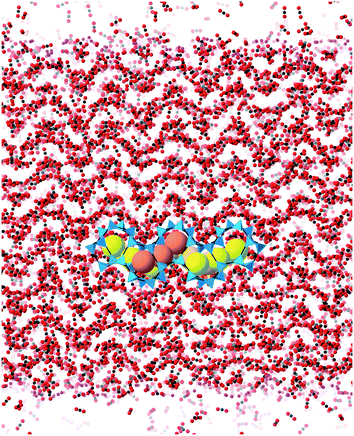
Molecular dynamics (MD) simulations were performed using the DL_POLY code (version 4.06),32 running on the UK's Archer national high-performance computers. We used an ensemble with constant temperature and pressure controlled using the Nosé–Hoover thermostat and barostat, with a constraint to maintain 90° angles between the three axes of the atomic configuration. The simulations used time steps of 0.003 ps.The simulation configurations consisted of slabs of the ZIF structures with three-dimensional periodic boundaries, with the space between the slabs filled with CO2 molecules. The slabs were created always with the crystal [001] axis normal to slab surface, cutting the Zn–N bonds at a position designed to minimise the number of bonds to be cut. We always therefore align the normal to the slab with the sample Z axis, which will be denoted as such in the rest of this paper. The thickness of the slab was chosen to contain 10 cavities, and the lateral dimensions were chosen to be around twice the thickness. The thickness thus depended on the specific ZIF, and varied from 75 Å for ZIF-zni to 211 Å for ZIF-6. To make the system electrically neutral, we attached a hydrogen atom to each open nitrogen atom, as shown in Fig. 5.
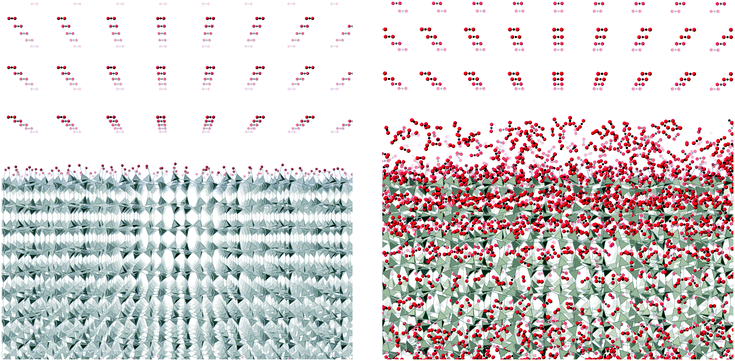
The simulations were performed under pressures and temperatures corresponding to the conditions that might be found in a typical industrial process. The plan with the simulations was that the pressure would force the CO2 molecules to enter the ZIF slab. This would result in the volume occupied by the gas to be continuously decreasing, until almost all the molecules in that particular stage of the simulation were inside the slab. Typically the height of the gas column at the start of the simulation was around 800–1000 Å. After one simulation, which will have ended when most of the CO2 molecules had entered the slab, we added a new column of CO2 on top of the ZIF slabs once the CO2 molecules get into the slab, as shown in Fig. 6. The left pane of the figure shows the start of the first stage simulation, and the right pane shows start of the second stage simulation with newly added CO2 position above the slab and with CO2 absorbed within the slab from the first stage simulation. We define one complete absorption process as the suite of simulations to the saturation state where no more molecules are easily absorbed. For one complete absorption process, several stage simulations are needed. The onset to saturation was most easily monitored through the rate of change of volume with time.
To perform the task of adding CO2 molecules to the new DL_POLY configuration file and increase the dimension of the simulation box at each new stage during the absorption process we used a self-written Python script. During the simulation, the coordinates of the system shift along the Z axis when a large amount of CO2 been pushed in, and this shift cannot be predicted, which means that the boundary of the simulation box might cut through the middle of the solid absorbent or the CO2 gas. Due to this shift, any bonds that cross the periodic boundary along the normal axis would be elongated when the length of this axis be increased. Our python script was also used to divide the CO2 gas by a given plane normal to the Z axis and reset this plane as the new periodic boundary.
For the data analysis, we wrote one Python script for extracting the output data from the file generated by DL_POLY that contains a set of data for each time step to be recorded (called STATIS), and another Python script to calculate the atom density profiles along the three axes. The visualisation software CrystalMaker33 was used to produce snapshot images and movies to provide additional information.
In addition to the absorption simulation, reverse desorption simulations were also performed. These started with the configurations for which absorption had reached their equilibrium state, but the configuration was set to atmospheric pressure.
It is useful to note that the large volume changes that occur with out approach to study absorption and desorption are not really compatible with the way that the architecture of the MD software is optimised for parallel computing architectures. In particular it proved impossible to run desorption simulations with DL_POLY4, so for these simulations it was necessary to use the older DL_POLY Classic software, which uses a different parallelisation strategy more suitable for smaller samples. The computational overhead limited the extent to which it was possible to study the desorption process, so the results presented here are rather more limited than for the studies of absorption.
4 Simulations of the CO2 absorption process
4.1 Absorption condition
Temperatures of 200 °C and 400 °C, and pressures of 25 bar and 30 bar, have been chosen as the absorption conditions use here following the information provided in two reports prepared for the International Energy Agency on oxy-combustion capture in power plants.34,35 There are several temperatures and pressures used within the entire combustion process. Before combustion, high-pressure steam may be generated at pressures around 290 bar and temperatures around 600 °C. After combustion, the CO2-rich gas may leave the heat recovery system at a temperature of 110 °C. The gas will then be compressed to 30 bar, half of which may be cooled to −55 °C for further compression for pipeline transmission, and the other half cooled to 35 °C to be recycled into the boiler. Considering the supercritical pressure of CO2 is 75 bar rather than steam pressure, we chose to use pressure ranges from 25–30 bar for our simulations of the post-combustion absorption process. To represent the absorption under different temperatures, temperature ranges from 200 °C to 400 °C were chosen for our simulations. Based on the methods and results reported here, both the pressure and the temperature can be decreased or increased in future studies to represent the different operating conditions as desired.4.2 Absorption at 25 bar and 200 °C
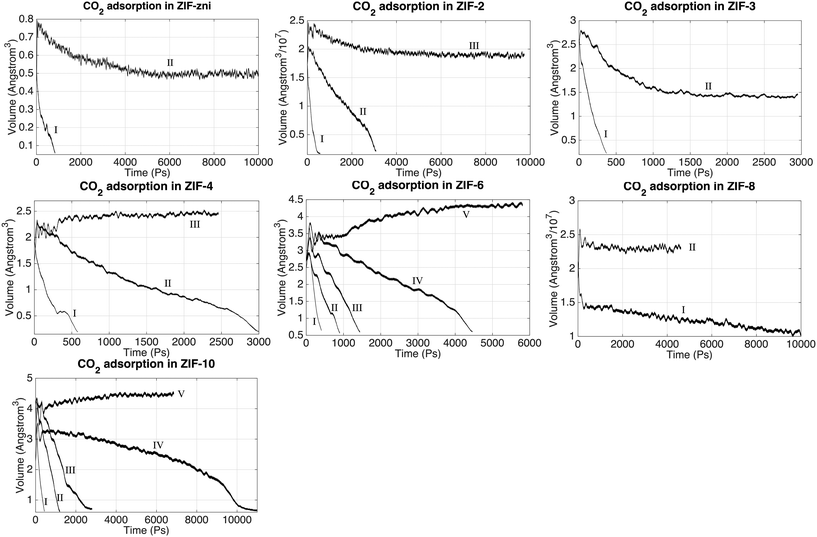
The absorption of CO2 can be monitored through the system volume, since the simulation box will shrink along the Z axis as the gas molecule are pushed into the slab. We have performed a systematic study of CO2 absorption in several ZIFs at a temperature of 200 °C and pressure of 25 bar. The variations with time of the volumes of several ZIFs during the absorption processes are shown in Fig. 7. In this figure, the Roman numerals against each curve denote the particular stage of the simulation. For example, in the case of ZIF-zni, the gas volume during stage I – the first stage starting with no CO2 within the ZIF – decreased rapidly as CO2 is pushed into the ZIF until almost all the CO2 in the gas had been absorbed. Stage II then represents a re-start of the simulation from the end of stage I but with a new volume of gas added to the top. From the results we can see generally, and this is exemplified by the example of ZIF-zni, that the absorption process slows down as more CO2 is pushed into the slab. ZIF-6 is an example that required more stages, with each stage taking longer than the previous stage; in this case stage I took around 500 ps, stage II took around 1000 ps, and later stages took even longer. When comparing results in Fig. 7 it should be noted that the same height and density of CO2 molecules was added above every ZIF shown in Fig. 7. One exception to the general trends was ZIF-8, in that the volume change with time in ZIF-8 appears to have been almost linear, and within reasonable simulation time scales it was not possible to reach the equilibrium state. This appears to be due to the interaction between CO2 molecules and imidazolate ligands; we will discuss this in more detail in a separate paper (manuscript in preparation).The absorption results are summarised in Table 5, which characterises each ZIF in terms of the number of atoms in each simulation and the density of Zn atoms, and then comparing the number of CO2 molecules absorbed in the simulation and the density of absorbed CO2 molecules. For each case Table 5 also gives the time required to reach saturation in the simulation. The pore (or channel) density is inversely proportional to the density of Zn atoms, with a higher Zn density indicating a smaller pore structure and hence smaller pore surface areas. We might have expected to find a higher CO2 gas capacity in the ZIFs with higher pore surface areas, but the simulation results in Table 5 show no simple link between the Zn density and CO2 uptakes. The results implies that the uptake capacity is decided by more factors rather than just the Zn density.
| N ZIF | N CO2 | D Zn | D CO2 | Time (ps) | |
|---|---|---|---|---|---|
| ZIF-zni | 28![[thin space (1/6-em)]](https://www.rsc.org/images/entities/char_2009.gif) 008 008 |
1455 | 7.26 | 6.64 | 4859 |
| ZIF-2 | 86![[thin space (1/6-em)]](https://www.rsc.org/images/entities/char_2009.gif) 112 112 |
9781 | 5.35 | 10.64 | 6656 |
| ZIF-3 | 80![[thin space (1/6-em)]](https://www.rsc.org/images/entities/char_2009.gif) 896 896 |
11![[thin space (1/6-em)]](https://www.rsc.org/images/entities/char_2009.gif) 464 464 |
4.30 | 10.69 | 1369 |
| ZIF-4 | 80![[thin space (1/6-em)]](https://www.rsc.org/images/entities/char_2009.gif) 896 896 |
9241 | 5.22 | 10.45 | 4029 |
| ZIF-6 | 180![[thin space (1/6-em)]](https://www.rsc.org/images/entities/char_2009.gif) 992 992 |
25![[thin space (1/6-em)]](https://www.rsc.org/images/entities/char_2009.gif) 487 487 |
4.12 | 9.97 | 8205 |
| ZIF-8 | 147![[thin space (1/6-em)]](https://www.rsc.org/images/entities/char_2009.gif) 584 584 |
3553 | 4.06 | 2.30 | 21![[thin space (1/6-em)]](https://www.rsc.org/images/entities/char_2009.gif) 085 085 |
| ZIF-10 | 230![[thin space (1/6-em)]](https://www.rsc.org/images/entities/char_2009.gif) 496 496 |
34![[thin space (1/6-em)]](https://www.rsc.org/images/entities/char_2009.gif) 701 701 |
4.18 | 10.86 | 16![[thin space (1/6-em)]](https://www.rsc.org/images/entities/char_2009.gif) 508 508 |
We remark that the density of the CO2 gas outside the slab in our simulations after saturation with pressure of 25 bar and temperature of 200 °C is approximately 34 kg m−3. This is higher than both the experiment value of 29 kg m−3 at the same condition, which in turn is consistent with our own MD simulations of the gas state showing a density of 28.5 kg m−3 at the same conditions. We speculate that the increased density is associated with attractions due to the surfaces, although if this is the explanation it was not possible to test this because the whole sample size was not large enough to observe the expected gradient in the density in the direction between the surface of one slab and the closest surface of its periodic image.
4.3 CO2 density profile
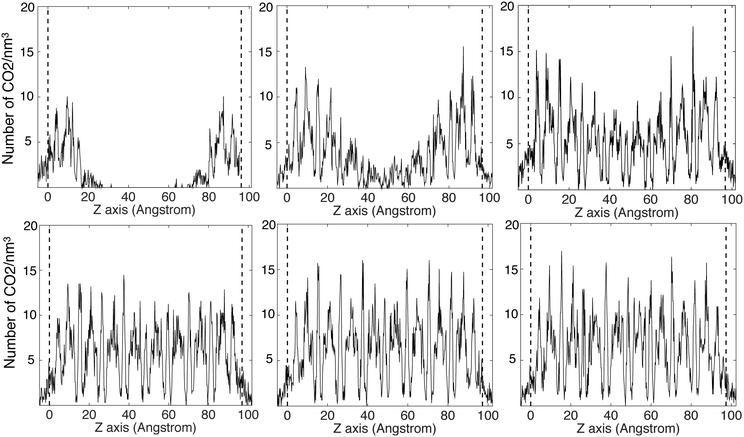
The CO2 density profiles for the directions normal to the slab surfaces at different stage during the absorption process indicate that the gas molecules always accumulated in the surface layers at first and were then pushed further into the slabs by the accumulating gas molecules. We show this process for ZIF-2 in Fig. 8, In the first view, at 243 ps (first pane in the top row Fig. 8), the CO2 molecules had accumulated in the layers near the surfaces (which are marked by the vertical dashed lines). With more gas molecules having been pushed into the surface, molecules already within the slap have been pushed into the deeper layers, as shown at 1524 ps (second pane in the top row and first in the bottom row in Fig. 8). This trend continues (third pane in the top row in Fig. 8) until the gas is saturated in the slab (the last two panes in Fig. 8). This trend is consistent with the rate of volume change of the gas over time (Fig. 7). From the start, the gas molecules only need to stay near the surface pores, and their capture takes place in short time. Subsequently they will be pushed further into the slab by the pressure from the gas stream, but this happens over a relatively longer period. Most of the other ZIFs we have studied, with the exception of ZIF-8, shown the same trends as ZIF-2, and their density profiles are given in the ESI.†The patterns of CO2 absorbed in different ZIFs also reflect the structures of pores and channels. This is shown for example of ZIF-4 in Fig. 9. The observation of the pattern of pores reflects the high degree of filling that is being achieved in the simulation. The patterns for absorption in other ZIFs are given in the ESI.†
4.4 Absorption at 30 bar
To further understand the absorption dynamics and to explore the CO2 uptake capacity of ZIFs, the absorption process has been investigated by increasing the pressure from 25 bar to 30 bar. This pressure increase is a compromise between being large enough in order to see a difference, but not so large as to significantly increase the computational requirements. The starting configurations were taken from the last MD run at 25 bar in each case (saturation state under 25 bar).The change in volume of the system (slab plus gas) in different ZIFs under increased pressure is illustrated in Fig. 10, where we show the effect of switching instantaneously from 25 bar to 30 bar. It can be seen that the volumes decreased rapidly under the higher pressures. This shrinking process will in part be associated with compression of the gas. However, there is also a higher degree of absorption, as shown by the results given in Table 6. They show that the absorption uptake capacity of most of the ZIFs (ZIF-zni, ZIF-2, ZIF-4, ZIF-6 and ZIF-10) under 30 bar is slightly higher than at 25 bar, by just under 5%. The increase in uptake is much larger in ZIF-3 and ZIF-8 slabs, of 8% for ZIF-3 and 16% for ZIF-8. This mechanism of this high increase can be revealed by the CO2 density profiles within the ZIF. The density profile of absorbed CO2 in the ZIF-3 slab under 30 bar is shown in Fig. 11. It shows that the density peaks for 30 bar are higher than the ones under 25 bar. This shows simply that more CO2 molecules have been pushed in, and that they tend to cluster together in the same sites.
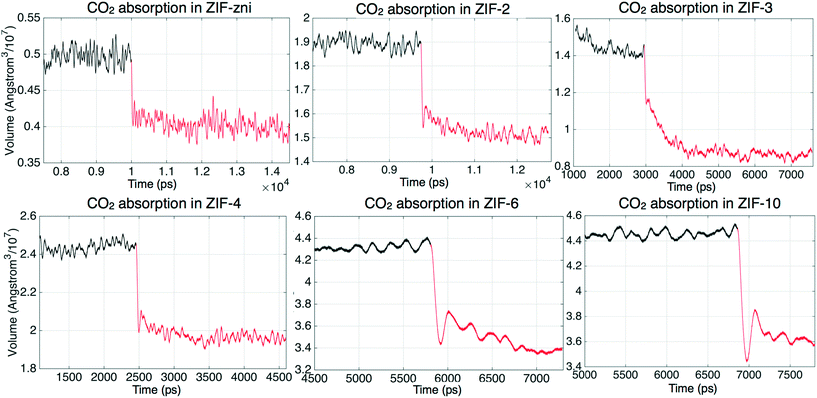 | ||
| Fig. 10 Volume change of CO2 absorption in ZIFs. The black lines represents the adsorption under 25 bar and the red lines represents the adsorption under 30 bar. | ||
| N CO2 (25 bar) | N CO2 (30 bar) | D CO2 (25 bar) | D CO2 (30 bar) | P increase | |
|---|---|---|---|---|---|
| Units: | mol ml−1/kg m−3 | mol ml−1/kg m−3 | |||
| ZIF-zni | 1448 | 1502 | 6.64/278.96 | 6.87/301.97 | 3.43% |
| ZIF-2 | 9739 | 10![[thin space (1/6-em)]](https://www.rsc.org/images/entities/char_2009.gif) 013 013 |
10.64/468.12 | 10.90/479.55 | 2.42% |
| ZIF-3 | 11![[thin space (1/6-em)]](https://www.rsc.org/images/entities/char_2009.gif) 458 458 |
12![[thin space (1/6-em)]](https://www.rsc.org/images/entities/char_2009.gif) 403 403 |
10.69/470.21 | 11.52/506.82 | 7.84% |
| ZIF-4 | 9222 | 9462 | 10.45/459.75 | 10.68/469.87 | 2.22% |
| ZIF-6 | 25![[thin space (1/6-em)]](https://www.rsc.org/images/entities/char_2009.gif) 371 371 |
26![[thin space (1/6-em)]](https://www.rsc.org/images/entities/char_2009.gif) 561 561 |
9.97/438.63 | 10.41/547.99 | 4.47% |
| ZIF-8 | 3552 | 4066 | 2.30/101.19 | 2.63/115.7071 | 14.53% |
| ZIF-10 | 34![[thin space (1/6-em)]](https://www.rsc.org/images/entities/char_2009.gif) 630 630 |
35![[thin space (1/6-em)]](https://www.rsc.org/images/entities/char_2009.gif) 187 187 |
10.86/477.79 | 11.03/485.27 | 1.62% |
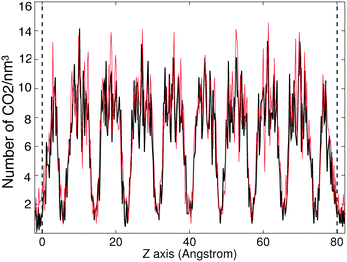 | ||
| Fig. 11 Absorbed CO2 density profile in ZIF-3 slab. The black line represents the adsorption profile for 25 bar, the red lines represents the adsorption profile for 30 bar. | ||
4.5 Interaction between imidazolate ligands and CO2 molecules
We now look at the CO2 absorption sites and consider the attraction between CO2 and the imidizolate ligands. The N atoms in ZIFs are negatively charged,14 and the C atoms in CO2 have positive charge. This leads to a Coulomb attraction between the centre of a CO2 molecule and NZIF. The CCO2–NZIF Coulomb attraction leads to the preferable adsorption sites that are illustrated in Fig. 12. It can be seen that most of the CO2 molecules have become attached to the ligands, with the carbon atom in the CO2 molecule being positioned close to the nitrogen atom in the imidazolate ligand. Inspection of Fig. 12 also shows that the CO2 molecules tend to lie flat parallel to the plane of the imidazolite ligands, and evenly located on both sides.We have also made a animation of CO2 in ZIF-zni at the saturation state, using CrystalMaker, which is provided within the ESI.† The animation shows that the CO2 molecules in saturated ZIF-zni move back and forth with the translational and rotational vibrations of the ligands.
5 CO2 desorption from ZIFs
5.1 Introduction
Having shown that most of the ZIFs (ZIF-8 being the key exception) will absorb CO2 from a gas with a modest pressure until some saturation state, we have next to ask the question as to whether the process can be reversed. For applications of ZIFs for carbon capture, being able to recover the CO2 from the ZIF to enable subsequent storage is essential. Traditionally there are two ways to encourage desorption, namely increasing the temperature or decreasing the pressure. We decrease the pressure from 25 bar to 1 bar whilst maintaining the same temperature of 200 °C, starting with the configuration corresponding to the equilibrium state of saturation absorption. In addition to testing decreasing pressure at the same temperature, we also have tried to simulate the desorption in ZIF-10 by increasing the temperature to 400 °C.The way to handle the desorption simulation is basically a reverse process of absorption simulation. Generally, the simulations have been performed in separate stages similar to absorption simulations. When the gas was released to a certain amount, typically an expansion in the direction of the normal to the slab by a factor of about 4 or 5, the gas molecules were removed from the simulation manually and the volume adjusted accordingly. This new configuration was then the starting point for the subsequent simulation.
The desorption process was initially simulated using the same MD code DL_POLY used for the absorption simulations, but we found that this code gave some problems associated with its use of high-performance computing architectures. We found that the same problems did not arise using a previous version, DL_POLY classic (version Classic 1.9), but this has the disadvantage of not being optimised for large systems in the same way that Version 4 has been. Thus we used version 4.06.1.1 for the initial desorption simulations, and then we switched to DL_POLY classic for further desorption runs. This strategy, however, only allowed us to perform short period simulations of the desorption process.
5.2 Desorption dynamics and mechanisms
As with the absorption studies, in our simulations on the desorption process we monitored the volume as representing the extent of gas release, as shown in Fig. 13. Again, different stages are indicated by Roman numerals. The first stage, denoted by I, corresponds to the start of the desorption process, in which we started with the sample of saturated systems obtained at pressure of 25 bar and temperature of 200 °C and then reduced the pressure to 1 bar. The volume increased as CO2 was released from the slab. Subsequent stages (II, III etc.) follow after the manual removal of molecules from the gas as described above. It can be seen that the volume of the systems expand rapidly at I stage. The desorption process then slows down as the volume expands, which is exactly the opposite to the absorption process. Take the desorption in ZIF-3 for instance; starting from the same volume, the first run (I) took 40 ps, but the second run (II) took approximately 160 ps to expand to the same volume. The desorption processes in ZIF-2, ZIF4 and ZIF-10 have shown the similar trend as ZIF-3. Because of this we have only been able to study the desorption processes at their early stage.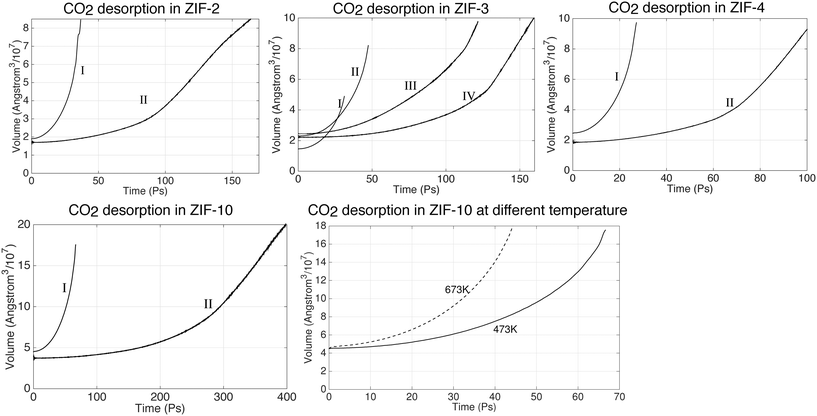 | ||
| Fig. 13 CO2 desorption dynamics in ZIFs at 200 °C under 1 bar. The configuration of the first run (I run) is taken from the last output files of absorption under 25 bar. | ||
The decreased percentage of absorbed CO2 molecules are shown in Table 7. The Table shows that big portions of the gas have been released in ZIF-2, ZIF-3 and ZIF-4 already. It takes longer time to release the gas in ZIF-2. However, their trends in Fig. 13 indicates that the systems are still far away from the equilibrium state which means a larger amount of CO2 can still be released from these ZIFs, including ZIF-10.
| N CO2 (25 bar) | N CO2 (1 bar) | Time (ps) | Decreased percentage | ||
|---|---|---|---|---|---|
| ZIF-2 | 9781 | 8710 | 402 | 16.47% | |
| ZIF-3 | 11![[thin space (1/6-em)]](https://www.rsc.org/images/entities/char_2009.gif) 464 464 |
8547 | 555 | 25.44% | |
| ZIF-4 | 9241 | 6588 | 903 | 28.71% | |
| ZIF-10 | 34![[thin space (1/6-em)]](https://www.rsc.org/images/entities/char_2009.gif) 701 701 |
32![[thin space (1/6-em)]](https://www.rsc.org/images/entities/char_2009.gif) 978 978 |
462 | 5% |
We have also performed a simulation of the desorption process at the higher temperature of 400 °C, with results shown in the last image in Fig. 13. It took approximately 66 ps at 200 °C to expand to the same volume, but only 42 ps at 400 °C. The number of CO2 molecules that came out of the slab further showed that the gas molecules are released quicker at higher temperature. While only 684 CO2 molecules have been released at 200 °C after 66 ps, in the 42 ps to give the same volume the slab released three times the number of molecules, namely 2294 molecules. This means that the absorbed CO2 molecules can be released significantly faster by heating up the system.
6 Conclusion
In this paper we have studied the absorption of CO2 in zeolitic imidazolate framework (ZIF) structures using the molecular dynamics simulation method. In order to do this work, we have built on our prior simulation study of the ZIF structures for which we had developed a significant part of the force field,14 and for the present paper we augmented this with a new force field for CO2 designed to work in both condensed and fluid phases together with new models for the interactions between CO2 and ZIF. The new model for CO2 has been validated with calculations of crystal structure and phonon dispersion curves, and of the liquid–gas coexistence behaviour.Based on these model force fields, a set of systematic MD simulations on CO2 absorption process in ZIF slabs have been presented. The simulations on CO2 absorption in ZIFs have been performed with environments close to those found in industrial power plants. The simulations have produced a large quantity of data, some of which have been reported in this paper but with many results presented in the ESI.† The simulations have given insights into the process of absorption, showing both similarities and differences between the behaviour of different ZIF systems. It is found that it is usually possible to achieve a high filling of the porous structures, as monitored both by calculations of density profiles and visualisations. It has been found that the preferable absorption sites for CO2 molecules are close to the imidazolate ligands due to the CCO2–NZIF Coulomb attraction.
In addition to the absorption simulation, the desorption processes have also been simulated. The desorption simulation results have shown that the CO2 molecules can be taken out by decreasing the pressure or increasing the temperature.
All these results point to the real possibility of using porous structures like ZIFs for capture of CO2 in an industrial environment as part of a strategy to reduce the release of CO2 into the Earth's atmosphere. In a following paper we will discuss some of the details of the processes at the atomic scale, but here our headline results concern the potential of such materials for this application, but with the caveat that different members of the general family of materials may show very different absorption capacity.
In future work it would be useful to work with gas streams containing other molecules, such as N2 and H2O. This will require an extension of our force field model, ideally using the approaches discussed in this paper.
Acknowledgements
This research utilised two high-performance computing facilities. Development of the force field was carried out using Queen Mary's MidPlus computational facilities, supported by QMUL Research-IT and funded by EPSRC grant EP/K000128/1. The molecular dynamics simulations were carried out using the ARCHER UK National Supercomputing Service (http://www.archer.ac.uk), with access made available through our membership of the UK's HEC Materials Chemistry Consortium, which is funded by EPSRC (EP/L000202). MG and CY were supported by both the China Scholarship Council and Queen Mary University of London. AM was supported by a European Union Marie Sklodowska-Curie fellowship.References
- D. Venkataraman, S. Lee, J. Zhang and J. S. Moore, Nature, 1994, 371, 591–593 CrossRef CAS.
- O. M. Yaghi and H. Li, J. Am. Chem. Soc., 1995, 117, 10401–10402 CrossRef CAS.
- J. L. Rowsell and O. M. Yaghi, Chem. Eng. J., 2004, 73, 3–14 CAS.
- K. Sumida, D. L. Rogow, J. A. Mason, T. M. McDonald, E. D. Bloch, Z. R. Herm, T.-H. Bae and J. R. Long, Chem. Rev., 2012, 112, 724–781 CrossRef CAS PubMed.
- K. S. Park, Z. Ni, A. P. Cote, J. Y. Choi, R. Huang, F. J. Uribe-Romo, H. K. Chae, M. O'Keeffe and O. M. Yaghi, Proc. Natl. Acad. Sci. U. S. A., 2006, 103, 10186–10191 CrossRef CAS PubMed.
- R. Banerjee, A. Phan, B. Wang, C. Knobler, H. Furukawa, M. O'Keeffe and O. M. Yaghi, Science, 2008, 319, 939–943 CrossRef CAS PubMed.
- A. Phan, C. J. Doonan, F. J. Uribe-Romo, C. B. Knobler, M. O'Keeffe and O. M. Yaghi, Acc. Chem. Res., 2010, 43, 58–67 CrossRef CAS PubMed.
- Y. Li, F. Liang, H. Bux, W. Yang and J. rgen Caro, J. Membr. Sci., 2010, 354, 48–54 CrossRef CAS.
- Q. Song, S. K. Nataraj, M. V. Roussenova, J. C. Tan, D. J. Hughes, W. Li, P. Bourgoin, M. A. Alam, A. K. Cheetham, S. A. Al-Muhtaseb and E. Sivaniah, Energy Environ. Sci., 2012, 5, 8359–8369 CAS.
- S.-S. Han, S.-H. Choi and W. A. Goddard III, J. Phys. Chem. C, 2011, 115, 3507–3512 CAS.
- U. P. N. Tran, K. K. A. Le and N. T. S. Phan, ACS Catal., 2011, 1, 120–127 CrossRef CAS.
- A. Phan, C. J. Doonan, F. J. Uribe-Romo, C. B. Knobler, M. O'Keeffe and O. M. Yaghi, Acc. Chem. Res., 2010, 43, 58–67 CrossRef CAS PubMed.
- L. T. L. NGuyen, K. K. A. Le and N. T. S. Phan, Chin. J. Catal., 2012, 33, 688–696 CrossRef CAS.
- M. Gao, A. J. Misquitta, L. H. N. Rimmer and M. T. Dove, Dalton Trans., 2016, 45, 4289–4302 RSC.
- S. S.-Y. Chui, S. M.-F. Lo, J. P. H. Charmant, A. G. Orpen and I. D. Williams, Science, 1999, 283, 1148–1150 CrossRef CAS PubMed.
- E. Aprà, E. J. Bylaska, D. J. Dean, A. Fortunelli, F. Gao, P. S. Krstić, J. C. Wells and T. L. Windus, Comput. Mater. Sci., 2003, 28, 209–221 CrossRef.
- M. Valiev, E. J. Bylaska, N. Govind, K. Kowalski, T. P. Straatsma, H. J. J. Van Dam, D. Wang, J. Nieplocha, E. Apra, T. L. Windus and W. de Jong, Comput. Phys. Commun., 2010, 181, 1477–1489 CrossRef CAS.
- J. P. Perdew, K. Burke and M. Ernzerhof, Phys. Rev. Lett., 1996, 77, 3865–3868 CrossRef CAS PubMed.
- A. J. Stone, The Theory of Intermolecular Forces, Oxford University Press, 2nd edn, 2012, pp. 122–140 Search PubMed.
- A. J. Misquitta and A. J. Stone, CamCASP 5.9, 2016, http://www-stone.ch.cam.ac.uk/documentation/camcasp/users_guide.pdf Search PubMed.
- P. J. Winn, G. G. Ferenczy and C. A. Reynolds, J. Phys. Chem. A, 1997, 101, 5437–5445 CrossRef CAS.
- G. G. Ferenczy, P. J. Winn and C. A. Reynolds, J. Phys. Chem. A, 1997, 101, 5446–5455 CrossRef CAS.
- J. D. Gale and A. L. Rohl, Mol. Simul., 2003, 29, 291–341 CrossRef CAS.
- D. E. Williams, J. Comput. Chem., 2001, 22, 1154–1156 CrossRef CAS.
- B. L. Gastaldi and L. Scaramuzza, Acta Crystallogr., Sect. B: Struct. Crystallogr. Cryst. Chem., 1980, 36, 2751–2753 CrossRef.
- D. Bolmatov, D. Zav'yalov, M. Gao and M. Zhernenkov, J. Phys. Chem. Lett., 2014, 5, 2785–2790 CrossRef CAS PubMed.
- J. J. Potoff and J. I. Siepmann, AIChE J., 2001, 47, 1676–1682 CrossRef CAS.
- A. Simon and K. Peters, Acta Crystallogr., Sect. B: Struct. Crystallogr. Cryst. Chem., 1980, 36, 2750–2751 CrossRef.
- G. Dolling, P. Martel, L. Piseri, P. Martel and B. Powell, Bull. Am. Phys. Soc., 1972, 17, 291 Search PubMed.
- E. W. Lemmon, M. O. McLinden and D. G. Friend, Thermophysical Properties of Fluid Systems in NIST Chemistry WebBook, NIST Standard Reference Database Number 69, ed. P. J. Linstrom and W. G. Mallard, National Institute of Standards and Technology, Gaithersburg MD, 20899, DOI:10.18434/T4D303, (retrieved July 21, 2017).
- M. G. Martin, Mol. Simul., 2013, 39, 1212–1222 CrossRef CAS.
- I. T. Todorov, W. Smith, K. Trachenko and M. T. Dove, J. Mater. Chem., 2006, 16, 1911–1918 RSC.
- D. C. Palmer, Z. Kristallogr. - Cryst. Mater., 2015, 230, 559–572 CAS.
- IEA Greenhouse Gas R&D Programme (IEA GHG), Oxy-combustion processes for CO2 capture from power plant, Report number 2005/9, July 2005. http://www.ieaghg.org/docs/General_Docs/Reports/Report%202005-9%20oxycombustion.pdf, retrieved July 2017 Search PubMed.
- IEA Greenhouse Gas R&D Programme (IEA GHG), CO2 capture ready plants, Report number 2007/4, May 2007, https://www.iea.org/publications/freepublications/publication/CO2_Capture_Ready_Plants.pdf, retrieved July 2017 Search PubMed.
Footnotes |
| † Electronic supplementary information (ESI) available. See DOI: 10.1039/c7me00034k |
| ‡ Present address: China Spallation Neutron Source, Institute of High Energy Physics, Chinese Academy of Sciences, 1 Zhongziyuan Road, Dongguan 523803, People's Republic of China, and, Dongguan Institute of Neutron Science, 1 Zhongziyuan Road, Dongguan, 523808, People's Republic of China; E-mail: E-mail: gaomin@ihep.ac.cn |
| § Present address: Institute of Natural Sciences, and, Department of Physics and Astronomy, Shanghai Jiao Tong University, Shanghai 200240, People's Republic of China. |
| ¶ Present address: Fachbereich Physik, Erwin-Schrödinger-Strasse, 67663 Kaiserslautern, Germany. |
| This journal is © The Royal Society of Chemistry 2017 |


