
Characterization of size-dependent mechanical properties of tip-growing cells using a lab-on-chip device†
Chengzhi
Hu
 *a,
Gautam
Munglani
b,
Hannes
Vogler
c,
Tohnyui
Ndinyanka Fabrice
c,
Naveen
Shamsudhin
a,
Falk K.
Wittel
b,
Christoph
Ringli
c,
Ueli
Grossniklaus
c,
Hans J.
Herrmann
b and
Bradley J.
Nelson
*a
*a,
Gautam
Munglani
b,
Hannes
Vogler
c,
Tohnyui
Ndinyanka Fabrice
c,
Naveen
Shamsudhin
a,
Falk K.
Wittel
b,
Christoph
Ringli
c,
Ueli
Grossniklaus
c,
Hans J.
Herrmann
b and
Bradley J.
Nelson
*a
aInstitute of Robotics and Intelligent Systems, ETH Zurich, Tannenstrasse 3, CH-8092 Zurich, Switzerland. E-mail: huc@ethz.ch; bnelson@ethz.ch
bComputational Physics for Engineering Materials, Institute for Building Materials, ETH Zurich, Stefano-Franscini-Platz 3, CH-8093 Zurich, Switzerland
cInstitute of Plant and Microbial Biology & Zurich-Basel Plant Science Center, University of Zurich, Zollikerstrasse 107, CH-8008, Zurich, Switzerland
First published on 16th November 2016
Abstract
Quantification of mechanical properties of tissues, living cells, and cellular components is crucial for the modeling of plant developmental processes such as mechanotransduction. Pollen tubes are tip-growing cells that provide an ideal system to study the mechanical properties at the single cell level. In this article, a lab-on-a-chip (LOC) device is developed to quantitatively measure the biomechanical properties of lily (Lilium longiflorum) pollen tubes. A single pollen tube is fixed inside the microfluidic chip at a specific orientation and subjected to compression by a soft membrane. By comparing the deformation of the pollen tube at a given external load (compressibility) and the effect of turgor pressure on the tube diameter (stretch ratio) with finite element modeling, its mechanical properties are determined. The turgor pressure and wall stiffness of the pollen tubes are found to decrease considerably with increasing initial diameter of the pollen tubes. This observation supports the hypothesis that tip-growth is regulated by a delicate balance between turgor pressure and wall stiffness. The LOC device is modular and adaptable to a variety of cells that exhibit tip-growth, allowing for the straightforward measurement of mechanical properties.
Introduction
Tip growing cells, such as pollen tubes, fungal hyphae, moss protonemata, Acetabularia stalks, and root hairs are ideal model systems to investigate the regulatory mechanisms underlying polarized cell growth. The pollen tube, a significant part of the male gametophyte of flowering plants, is an extremely fast growing cell whose task is to deliver male gametes to the female gametophyte, thereby ensuring double fertilization. Pollen tube cells are optimized for unidirectional growth, allowing them to achieve expansion rates of over 1 cm h−1, reaching lengths of up to 30 cm within 24 hours.1 The elongation of pollen tubes is accomplished through the biosynthesis of cell wall components at the plasma membrane near the tip and the continuous apical fusion of vesicles containing wall precursors into the tip cell wall.2 Tip growth combined with ion flux across the cell membrane, secretion of signaling molecules and differential cell wall assembly results in highly uneven properties along the longitudinal axis of the tube. This spatial variance in properties makes the pollen tube attractive for biomechanical studies. The pollen tube is a single haploid cell that transports the sperm cells and is thus also of great interest for genetic and molecular research.The interplay between cytoplasmic turgor pressure and the cell wall is the basis for cell expansion and growth.3 Turgor pressure is exerted on the cell wall by water entering the cell in response to the differential concentration of ions, sugars and other solutes between the cell and the surrounding medium. The pressure plays a dual role by providing both mechanical support for free-standing structures, and a force to drive cellular expansion, substrate penetration, and movement.4 Although turgor pressure is not directly correlated with growth rate, pollen tube growth has been shown to stop when the turgor pressure falls below a certain threshold level.5 The cell wall is a protective layer surrounding the cell membrane, providing plant cells with mechanical strength and rigidity, while also allowing adhesion between neighboring cells. The primary cell wall is a polymeric network of crystalline cellulose microfibrils, which is interconnected by hemicelluloses and embedded in a hydrophilic pectin matrix.6 It is crucial for cellular morphogenesis and determines when and where cell growth occurs.6,7 Understanding the mechanical aspects of plant cell growth therefore requires the integration of structural cell wall details with quantitative biophysical parameters such as the thickness, the morphological and mechanical properties of the cell wall, and the turgor pressure.8,9 The importance of biomechanics are further evident in cellular processes, such as mechanotransduction of biochemical signals, that are triggered upon mechanical stimulation of the cell. Application of this external stress on different regions of the tube has been shown to cause anisotropic expansion of the cell wall, due to the non-random reorientation of cellulose microfibrils.10
The turgor pressure of pollen tubes and root cells has been measured by piercing the cell wall with a pressure probe filled with oil and measuring the pressure needed to maintain the oil/cytosol meniscus at its original position.11,12 The pressure probe technique is both invasive, thereby preventing repeated measurements, and difficult to perform on smaller cells (less than 20 μm in diameter). Non-invasive techniques include micro-indentation using a cellular force microscope (CFM),13–15 and constant strain rate tensile tests, providing mechanical data at the micro scale.16,17 For highly localized properties at the submicron scale, nano-indentation by atomic force microscopy (AFM) and acoustic microscopy have been used.18 These techniques rely on recording the force resulting from indenting the cell surface with a small probe. Depending on the scale of indentation and the indentor shape, the force-indentation data reveals several parameters such as cell wall elasticity, turgor pressure, and cell geometry. Local indentation techniques generally require the sensor tip to be placed perpendicular to the surface of the pollen tube, which is difficult to achieve due to its cylindrical shape. Recently, lab-on-a-chip (LOC) approaches have also been exploited for studying the biomechanics of pollen tubes in a controlled environment. Properties like the bending stiffness,19 tube penetrative forces and elongation rate have been studied.20 These LOC setups for pollen tube analysis do not target specific pollen grains, and the computer models built so far have not considered the effect of turgor pressure. The deformation of the pollen tube under an externally applied force can be up to one order of magnitude larger when the effect of the turgor pressure is not taken into account,21,22 rendering this parameter essential to characterizing the biomechanical properties of pollen tubes.
In this study, we present a LOC device with integrated microvalves to trap and orient lily (Lilium longiflorum) pollen tubes in a microfluidic channel and exert a controlled uniform external pressure on the pollen tube with a polydimethylsiloxane (PDMS) membrane. The change in the lateral diameter of the tube with increasing pressure is measured, which when combined with finite element modeling, allows for the quantification of the mechanical properties of pollen tubes with different diameters. This soft indentation technique produces a continuous deformation of the pollen tube over a larger area than rigid probes, resulting in a more representative measurement of mechanical properties than localized indentation.
Materials and methods
LOC design and quantification of pollen tube properties
The microfluidic LOC has to meet several design criteria to efficiently trap single pollen tubes and subject them to compressive forces. As the pollen tube is a non-adherent (to PDMS) tip-growing cell, the layout of the microfluidic network has to allow for the injection of a pollen grain suspension, the re-orientation of individual tubes, and finally, the locking of this orientation to prevent pollen tube sliding under compression by the PDMS membrane. The network designed to accomplish this combination of functions is planar and employs microvalves to manipulate the pollen grains with their protruding pollen tubes. The microfluidic chip consists of three modular layers stacked on top of each other (Fig. 1A). The top layer is the control layer responsible for regulating the pneumatic actuation of all microvalves via an external source of compressed air. These microvalves fall into two categories; trapping microvalve and indentation microvalve, which are used to trap pollen tubes and control the deformation of the membrane respectively. The bottom layer is the fluid layer containing the inlet, outlet, compression, and flow control microchannels. These microchannels are filled with culture media to stimulate the pollen tubes to grow. The middle layer consists solely of the PDMS membrane, which acts as a flexible impermeable barrier between the top and bottom layers. The layout of the top and bottom layers are illustrated in Fig. 1B. | ||
| Fig. 1 Lab-on-a-chip (LOC) design for measuring the mechanical properties of pollen tubes. AC: air channel; FCC: flow control channel. (A) 3D design of three PDMS layers: a control layer for air actuation, a fluidic layer for the injection and manipulation of the pollen tubes, and a middle layer consisting of a deformable PDMS membrane for indenting the pollen tube through external pressure. (B) Top view of the LOC device with different layers aligned with markers (microchannels in black are from the control layer; microchannels in yellow are from the fluidic layer). (C) Illustrates the working principle of the device: a pollen tube is trapped inside the compression channel and is indented laterally whilst growing. (D) Scanning electron micrograph of the SU-8 mold for fabricating the fluidic layer of the LOC device. (E) Scanning electron micrograph of the PDMS fluidic layer of the LOC device. (F) Schematic view of the pollen tube cross section pressurized inside the channel. | ||
The pollen grains (mean diameter: 110 μm) are injected into the inlet microchannel dispersed in their optimal growth medium. Upon germination, pollen tubes of sufficient length which exhibit vigorous reverse fountain flow of vesicles are maneuvered towards the compression microchannel by regulating the flow rate in the inlet and outlet microchannels (Movies S1 and S2†). These grains are oriented so that their tubular growth is directed along the central axis of the compression microchannel and then trapped in place by the actuation of the trapping microvalve to prevent sliding. As the pollen tube grows along the compression microchannel, the flow control channels are constantly adjusted to position the pollen tube along the central axis of the microchannel (Fig. 1C). The pollen tube inlet and outlet channel are fabricated with a height of 170 μm to ensure the pollen tube can pass through without stacking in the z direction, while the compression microchannels are 33 μm high (H) and 80 μm wide (W) to allow the PDMS membrane (tM = 8 μm) to reach the top of the pollen tube without significant deformation (Fig. 1D and E). An automated pressure control system is used to regulate the pressure applied on the PDMS membrane (Fig. S1, ESI text and Movie S3†). In the region of the indentation microvalve, the membrane deforms under pressure into the compression microchannel and laterally compresses the pollen tube (Fig. 1F). The extent of pollen tube deformation depends on its internal turgor pressure T, initial diameter D0, wall thickness tW, and its cell wall properties. Two pollen tubes can be trapped simultaneously in the chip (Fig. S2†), and each can be independently compressed at four locations along the tube.
Fabrication of the microfluidic device
The fabrication of the fluidic layer and the control layer follows standard procedures of soft lithography and replica-molding techniques.23 For fabricating the fluidic layer, it begins with the construction of a mold on a SU-8 negative photoresist (MicroChem Corp.) using standard photolithographic techniques. To fabricate the 1st layer of the SU-8 mold, SU-8 2035 is spin-coated on a silicon wafer at 3000 RPM for 30 seconds. The SU-8 is then baked for 1 minute at 65 °C and for 12 minutes at 95 °C on a hotplate. After soft-baking, the resist is cooled down to room temperature naturally and exposed to UV light using a photo mask for 200 mJ cm−2 at i-line. The post-exposure bake step is then carried out by baking the resist for 1 minute at 65 °C and for 5 minutes at 95 °C in order to cross-link the SU-8. For the preparation of the 2nd layer of the SU-8 mold, a layer of SU-8 50 is spin-coated at 1000 RPM for 30 seconds, followed with a soft bake of 15 minutes at 65 °C and 40 minutes at 95 °C. After cooling down, it is exposed to 400 mJ cm−2 from the i-line. The SU-8 layer is then post baked and developed to obtain the SU-8 mold. Alignment of the two exposures is realized by a marker. The microfluidic chip is fabricated by soft lithography of the PDMS compound in the constructed SU-8 mold. The PDMS layer is simply peeled off from the mold after curing.The control layer is used for providing gas actuation to the microvalves. First, SU-8 3025 is spin-coated on the silicon wafer at a speed of 2000 RPM for 30 seconds, resulting in a thickness of 35 μm. After baking at 95 °C for 12 minutes, UV light exposure is conducted under the shadow mask. The SU-8 mold is then developed. Finally, the PDMS is poured on the SU-8 mold and solidified for 24 hours at room temperature. After peeling off the PDMS from the wafer, it is trimmed and cleaned for oxygen plasma bonding.
To achieve an easily deformable thin membrane, we fabricated a PDMS membrane with a 20![[thin space (1/6-em)]](https://www.rsc.org/images/entities/char_2009.gif) :1 weight curing ratio of prepolymer/curing agent with a thickness of approximately 8 μm. The uncured PDMS is spin-coated onto a silanized wafer at a speed of 7000 RPM for 30 seconds. Silanization of the silicon wafer is needed before spinning in order to facilitate the release of the PDMS membrane from the silicon surface. Trimethylchlorosilane is used as the silanizing agent by conducting the chemical vapor treatment of the wafer for 30 minutes before fabrication. The PDMS-coated wafer is then heated at 80 °C for 30 minutes. Following this period, the temperature of the hot plate is decreased naturally to avoid thermal residual stresses from occurring inside the PDMS membrane.
:1 weight curing ratio of prepolymer/curing agent with a thickness of approximately 8 μm. The uncured PDMS is spin-coated onto a silanized wafer at a speed of 7000 RPM for 30 seconds. Silanization of the silicon wafer is needed before spinning in order to facilitate the release of the PDMS membrane from the silicon surface. Trimethylchlorosilane is used as the silanizing agent by conducting the chemical vapor treatment of the wafer for 30 minutes before fabrication. The PDMS-coated wafer is then heated at 80 °C for 30 minutes. Following this period, the temperature of the hot plate is decreased naturally to avoid thermal residual stresses from occurring inside the PDMS membrane.
A biopsy punch is used to generate holes on the air control ports of the control layer. Oxygen plasma treatment is applied to bond the air control layer and PDMS membrane. After bonding, through holes are made on the flow control port, the pollen inlet and the pollen outlet ports. Then the device is bonded with the fluidic layer after plasma treatment of the bonding surface. The alignment among different PDMS layers is conducted under a microscope.
Pollen tube germination
Anthers of lily (Lilium longiflorum) were frozen at −80 °C until use. The frozen pollen grains are brushed onto a glass slide and incubated for 30 minutes in a moisture chamber, which is subsequently filled with growth medium (10% sucrose, 5 mM 2-(N-morpholino) ethanesulfonic acid (MES), 5 mM KNO3, 0.13 mM Ca(NO3)2, 0.16 mM H3BO3, pH: 5.5), and incubated at 22 °C for 1.5–2.0 hours.Light and electron microscopy
Bright field imaging and experiments were conducted under an Olympus IX81 microscope. Pollen tubes were stained with propidium iodide, a fluorescent dye that stains pectin in the cell wall without affecting cytoplasmic streaming, and thus, pollen viability is not affected. Scanning electron micrographs were taken with a Zeiss ULTRA 55 operating at 5 kV.Determination of PDMS properties
PDMS is a hyperelastic material that can be modeled with a Mooney–Rivlin (MR) function. For an isotropic incompressible material, the Mooney–Rivlin strain energy density function may be expressed aswhere

C10 and C01 are empirically determined material constants, κ is the initial bulk modulus, I1, I2, and I3 are the first, second and third invariants of the left Cauchy–Green strain tensor and λ1, λ2 and λ3 are the principal stretches. The Cauchy stress is defined as

where i = 1, 2, 3 represent the principal directions. A uni-axial tensile test is conducted on the PDMS to determine the material parameters C10 and C01. In this case, the principal stretches are λ1 = λ and λ2 = λ3 =

 respectively. The stress then becomes
The parameters in the above equation are determined experimentally by the relations σ = F/A0 and λ = (L0 + ΔL)/L0, where F is the applied force, A0 and L0 are the reference cross-sectional area and length respectively, and ΔL is the change in specimen length under tension. To improve measurement accuracy, the PDMS thickness is measured with a single-axis capacitive MEMS-based microforce sensor which is developed previously and has a force resolution of 20 nN and a positioning resolution of 5 nm.14,15
Finite element modeling
The compression experiment is modeled using FEM. The compression channel is simulated as an extruded rectangle with a deformable top membrane. The hemispherical tip of the tube is not included in the simulation, as compression on the pollen tube occurs far distal to the tip, and the boundary effects are negligible. The top membrane is assigned properties determined from the tensile test on the PDMS. The pollen tube takes the shape of an extruded cylinder placed along the long axis of the channel. The elements used for the PDMS are fully integrated quadratic brick elements (C3D20), while the tube is discretized using quadratic quadrilateral thin shell elements (S8R) with reduced integration from the commercial package, Abaqus.24 The contact model in the simulation is implemented using a frictionless penalty constraint formulation on a surface-to-surface discretization. The time integration scheme used is explicit. The bottom and side walls are assumed to be rigid, with the only elastic to elastic contact occurring between the PDMS membrane and the pollen tube. The boundary conditions were chosen based on the physical working principle of the device. They were verified by calibrating the amount of PDMS deformation between the simulation and experiment under a given applied pressure P without the presence of the pollen tube for differing values of the PDMS membrane thickness (tM), PDMS material properties and compression channel height (H). In this way, sources of potential error in the simulation were reduced.The simulation is performed in two steps – the first corresponds to the stretch ratio experiment, and the second is related to the LOC compression of the pollen tube. The turgid pollen tube with diameter D0 is simulated by internally pressurizing a cylinder with a given E and tW to a specified pressure TL. Laplace's law of pressurized thin-shelled cylindrical vessels

Results
Soft indentation of pollen tubes
The unimpeded growth rate of the lily pollen tubes along the compression microchannels varies between 4–10 μm min−1, which falls in the same range as the growth rate in the conventional in vitro culture assay (Fig. 2A and Movie S3†). Lily pollen tubes with a D0 ranging from 17 μm to 23 μm were compressed in the LOC by a single microvalve at a region ≥100 μm distal from the tip, where the tube properties have been shown to be linearly elastic.27 The compressive force exerted on the pollen tube causes it to flatten. At applied pressures P of 0.05, 0.08, 0.11 and 0.14 MPa, the lateral diameter Dl is recorded (n = 92) using a fluorescent microscope (Fig. 2B–E). The diameter D increases relatively linearly with applied pressure P, regardless of D0 (Fig. 3A). It is therefore sufficient to characterize the properties of the pollen tube by the slope of the diameter-applied pressure curve, defined as k, which is analogous to the apparent stiffness in force-indentation experiments.15 | ||
| Fig. 2 Top view images of the LOC during indentation. MV: microvalve. (A) Bright field micrograph of a pollen tube that is trapped at the inlet of the compression channel and grows along the channel. (B–D) Images of the pollen tube without and with applied pressure to the PDMS membrane. High resolution images of the pollen tube indentation shows the increase of the diameter from D0 to Dl when under applied pressure P. The applied pressure P in (B), (C) and (D) correspond to 0, 0.08 and 0.14 MPa, respectively. (E) Optical image of a pollen tube inside the compression channel with an applied pressure P = 0.14 MPa on the PDMS membrane. | ||
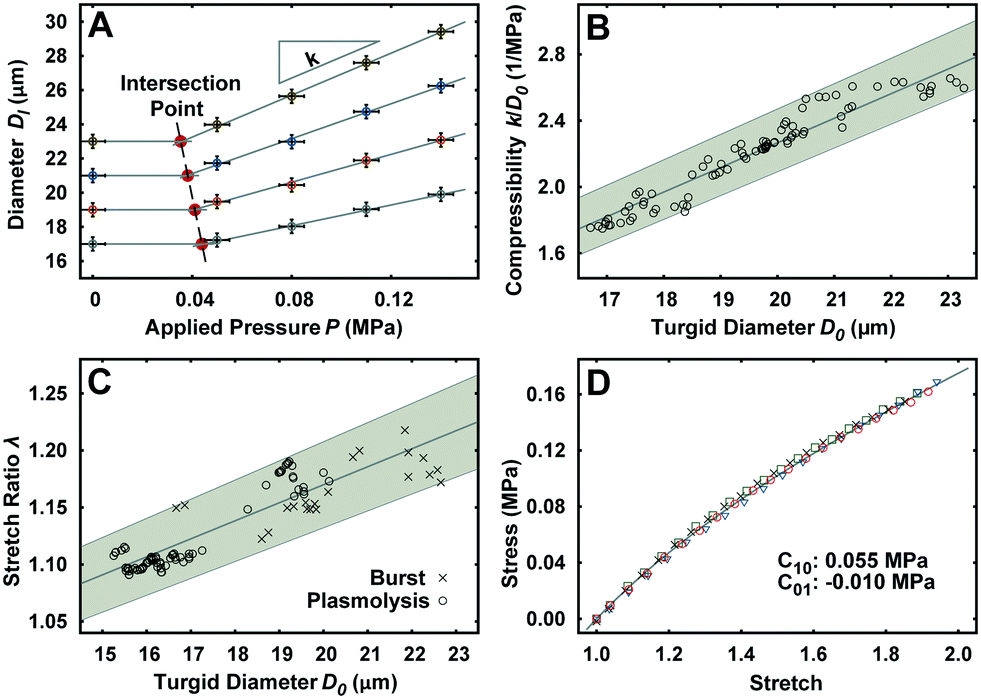 | ||
| Fig. 3 Experimental results of the LOC compression and stretch ratio characterization. (A) Definition of k and the intersection point at D0 = 17, 19, 21, 23 μm. (B) Increase in compressibility (k/D0) as a function of D0. (C) Increase in stretch ratio (λ) as a function of D0. (D) PDMS (20:1) material response curve used for the fabrication of LOC membrane. | ||
Unlike traditional indentation experiments, the compression force applied to the pollen tube depends on P as well as D0, due to fixed height H of the compression channel. This is because the PDMS membrane needs to deform a critical amount before it contacts the pollen tube, and this deformation depends solely on D0. The applied pressure P at this contact point, henceforth known as the intersection point, can be found at the intersection of the diameter–pressure curve with a horizontal line along the initial diameter D0 of the turgid pollen tube (Fig. 3A). As expected, the intersection point occurs at lower P for larger D0. The LOC compression experiment shows that the mean compressibility, defined as k/D0, increases by 50% from a D0 of 17 μm to 23 μm (Fig. 3B).
Stretch ratio of pollen tube
Indentation testing alone is not sufficient to characterize the mechanical properties of the pollen tube. In addition, the stretch ratio λ, which is the ratio of the turgid diameter to the flaccid diameter, is required. The experiment consists of releasing the turgor pressure in the pollen tube by (a) replacing the growth medium with 15% mannitol to induce plasmolysis, and (b) compressing pollen tubes with large applied pressures P until they burst in the compression channel.22 The mean λ is shown to increase by 9% in the same D0 range as the LOC compression experiment (Fig. 3C).PDMS properties
The material properties of the PDMS membrane regulate the force transfer from the applied pressure to the pollen tube during compression. The compliance of the PDMS is characterized with a uni-axial tensile test. The experimental material response curve is fitted with the Mooney–Rivlin hyperelastic model (Fig. 3D). The resultant coefficients are C10 = 0.055 MPa and C01 = −0.01 MPa.Finite element simulation
From a mechanics point of view, the pollen tube can be considered as a linearly elastic, thin-shelled cylindrical vessel subjected to a uniform hydrostatic pressure from an internal incompressible liquid.28,29 The cell wall ≥100 μm away from the tip has been shown to exhibit almost no hysteresis27 and a negligible degree of orthotropy.15,30 In previous large contact area compression experiments, varying the Poisson's ratio v from 0.3 to 0.5 has been shown to have a minor effect due to the lack of highly localized buckling stresses,22 leading us to use a v of 0.3. The deformation of a pollen tube in the LOC compression channel with P is simulated with FEM to predict the mechanical properties of the tube, namely turgor pressure T and Young's modulus E within a measured range of cell wall thickness tW = 190 ± 85 nm (Fig. S3†).The geometrical setup, mesh discretization and boundary conditions can be seen in Fig. 4A. From the contact of the PDMS membrane with the cylinder until the maximum observable experimental P of 0.14 MPa, Dl is found to increase linearly with k, which directly corresponds with the experimental findings (Fig. 3A). Compression experiments are typically much more sensitive to T than E,21,22,31 but are usually performed with rigid probes. To characterize the effect of using soft materials for compression, a sensitivity analysis is performed for a tube with D0 = 18 μm by varying T and E in the physiological range given previously.15As shown in Fig. 4B and C, doubling T from 0.2 MPa to 0.4 MPa clearly has a substantial effect on the compressibility regardless of E. Varying E between the range of 50–130 MPa also has a noticeable effect on the compressibility at fixed T, albeit much less pronounced. Cell wall thickness tW variations (data not shown) in the experimentally measured range has a minor effect on the compressibility (2% deviation).
 | ||
| Fig. 4 Finite element model for the simulation of mechanical properties of pollen tube. (A) Illustration of the finite element mesh with boundary conditions. (B) Effect of E on the compressibility during LOC compression experiment. (C) Effect of T on the compressibility during LOC compression experiment. (D) Comparison of the experimental, simulation and analytical results of the LOC compression experiment and stretch ratio experiment (inset) with the assumption that pollen tube material properties are constant with changing D0. (E) Overlap of the subset of simulated results that match the stretch ratio experiment (colored areas) and the LOC compression experiment (grey areas) for D0 = 17, 19, 21, 23 μm. Black dots represent the mean E and T values and dashed lines represent their standard deviation. (F) Prediction of mean Turgor pressure (T) (inset) and Young's modulus (E) at thickness tW = 190 ± 85 nm compared with the analytical solution.26 The error bar for T and E is obtained by using the upper and lower limit of tW. (G) Prediction of mean wall stiffness and circumferential stress (σc) (inset) at thickness tW = 190 ± 85 nm. | ||
To determine if the mechanical properties of the pollen tube are constant regardless of D0, a parameter space of T = 0.15–0.45 MPa, E = 30–130 MPa, tW = 105–275 nm for D0 = 17–23 μm is simulated. The subset of pollen tube properties (E, T, and tW) with D0 = 17 μm that yielded the mean experimental compressibility of 1.81 in the compression simulation is tracked as D0 is increased to 23 μm whilst maintaining constant mechanical properties. Contrary to the experimental results, the simulated compressibility for this subset of properties linearly decreases as D0 becomes larger (Fig. 4D). The simulated result is similar to a closed-form solution of an elastic cylinder with internal pressure subjected to rigid concentrated lateral loads (ESI† text).26 For the stretch ratio experiment, the same procedure is followed for the mean experimental λ of 1.12 at D0 = 17 μm. The simulated λ is shown to increase with D0, but with a much smaller slope than the experimental results. Furthermore, Laplace's law of pressurized thin-shelled cylindrical vessels delivers a result similar to the simulation (Fig. 4D). The clear discrepancy between experimental data and simulation and analytical results cannot be explained by measurement errors alone. This indicates that the mechanical properties of pollen tubes have to vary with D0.
To accurately predict the mechanical properties (E and T) of pollen tubes with different D0, simulated results matching with both the compressibility and stretch ratio experiments are cross-related. First, the subset of simulated E and T that fall within the 95% confidence interval of the experimental λ is determined for D0 = 17, 19, 21, 23 μm (Fig. S4A†). Similarly, simulated E and T that fall within the 95% confidence interval of the experimental compressibility are determined (Fig. S4B†). These two subsets overlap for every simulated D0, resulting in a narrow range of T and E properties (Fig. 4E). The mean E and T is derived by intersecting the lines that correspond to the mean experimental results of each experiment (Fig. 4F). Clearly, the mean E and T substantially change with D0. T decreases from 0.41 MPa to 0.19 MPa, while E changes from 110 MPa to 40 MPa for a tW of 190 nm. The prediction of T to be proportional to 1/D02 by the relation derived from plasma membrane permeability in the ESI† text is therefore quite close to the simulated result. The analytical relation with the rigid concentrated load shows a remarkably similar trend to the simulation results for mean T (Fig. 4F). Varying tW by 85 nm in either direction (its standard deviation) has only a slight effect on T, but causes a significant change in E. The mean wall stiffness (EtW) and the circumferential stress (σc = TD0/2tW) are found using Laplace's law of pressurized thin shells, and decrease from 61 N m−1 to 21 N m−1 and 3.2 MPa to 1.5 MPa respectively (Fig. 4G).
Discussion
The mechanical properties of cells are of great importance for cellular processes, such as cell migration, cell protrusion, cell division, cell morphology, cell sorting, cellular mechanotransduction and mechanoadaptation.32–39 Tip-growing plant cells are cellular protuberances that exhibit a strictly unidirectional growth pattern. The pollen tube is composed of a plasma membrane filled with viscous cytoplasm surrounded by a cell wall. As the turgor pressure applies an isodiametric force, cells equipped with a perfectly homogeneous wall would maintain an energetically optimal spherical shape.40 In the pollen tube, however, turgor pressure induces irreversible expansion of the cell wall only at the apex. The transition from a fluid-like flowing cell wall at the apex to a stiff elastic cell wall in the shank is likely to occur through a gelation transition. This is consistent with the observed increase of cross-links between cell wall polymers distal to the growing apical region in pollen tubes.41,42 In the distal region of the pollen tube, the tubular cell shape is also thought to be maintained by the presence of callose in the cell wall.43,44 It has been postulated that morphogenesis at the tip is constrained by the addition of new cell wall material based on the existing stress state of the wall.3,45 This stress state is maintained by a delicate balance between the turgor pressure T the wall extensibility (inversely related to the Young's modulus E), and the cell wall thickness in the apical region of the pollen tube. Reductions in cell wall extensibility and thickness disrupt the local mechanical equilibrium at the tip, which might allow the turgor pressure to dominate, resulting in polar growth.11,46The isolation and analysis of tip-growing cells is valuable for studying the molecular and physiological processes that lead to polarized cell growth and its biochemical and genetic regulation. The LOC setup quantifies the growth and mechanical properties of these cells in a well-controlled environment. The soft indentation technique is optimized to probe the turgor pressure of these tubular cells as it produces a distributed force along a large area, rather than the discrete localized force of micro and nano-indentation. This allows the LOC to detect the average properties over a larger area, thereby making it less susceptible to sensing the properties of local structural elements in the cell wall. The LOC also fixes the orientation of the pollen tube using the microvalves and flow control channels, thereby reducing the chance of slippage during compression. The microfluidic design allows for the measurement of both the linear and nonlinear response to compression using fluorescent microscopy. This LOC setup is a species-independent platform that can be used to measure the properties of other tip-growing cells due to its modular and adaptable design. Tuning the mechanical properties of the PDMS membrane can produce LOCs optimized for the characterization of materials with a wide range of Young's moduli (from 102–105 Pa) and relaxation times as small as 0.5 seconds. A similar design has been adapted for the soft indentation of Arabidopsis thaliana pollen tubes (Fig. S5†).
Our experimental results show that the compressibility and stretch ratio increase considerably with increasing initial diameter, suggesting that larger pollen tubes are more susceptible to deformation when loaded either internally or externally. To gain further insights into the properties of these pollen tubes, the findings of the experiment are cross-related with a finite element simulation. The results reveal that a pollen tube with an initial diameter of 18 μm has a mean turgor pressure of 0.35 MPa and a mean Young's modulus of 85 MPa, which agrees well with prior CFM measurements.15 Our analysis began by assuming that the mechanical properties of the pollen tubes do not vary significantly with initial diameter. To test this hypothesis, pollen tubes with initial diameters ranging from 17 μm to 23 μm were simulated with constant mechanical properties. The results showed that the compressibility decreased with increasing initial diameter, while the stretch ratio increased, albeit to a lower degree than the experiment. These results are supported by closed-form relations for rigid plate indentation and thin walled tube expansion and directly contradict the experimental data. This result indicates that the mechanical properties of pollen tubes must shift significantly with initial diameter or vice versa. It is likely that the mechanical properties and cell wall thickness of the pollen tube is dictated by the pollen grain from which it protrudes. When the protrusion first occurs, the initial diameter of the pollen tube is a function of the mechanical stability of the cell wall under a balance of internal and external pressures. Therefore, if placed in a medium of a given osmolarity, the cell wall properties and thickness most likely cause the pollen tube to exhibit a certain initial diameter instead of the other way around. Minor variations in mechanical properties have been previously reported in studies on non-growing Arabidopsis, tobacco and onion epidermal cells, but are yet to be described quantitatively.30,47,48 The possible theoretical effect of the concentration of the growth medium on the diameter of the pollen tube and mechanical properties is shown in the ESI text.†3,21,48,49
The FEM model predicts that the mean turgor pressure decreases by 55%, and the mean Young's modulus by 70% from an initial diameter of 17 μm to 23 μm. The large dependence of the mean Young's modulus on variations in cell wall thickness signifies the importance of accurate cell wall thickness data correlated to initial diameter. While transmission electron microscopy (TEM) is able to determine the wall thickness with a high degree of accuracy on thin sections, it requires chemical fixation as well as high vacuum conditions. This constraint greatly impedes the investigation of the cell wall thickness of growing cells. Other methods such as nanoindentation by AFM and confocal microscopy (staining the cell wall induces scattering of light) are unable to provide the same accuracy. Therefore, while it is possible to attain an average cell wall thickness, correlating this information with the initial diameter of growing pollen tubes is difficult with currently available techniques. Taking this constraint into account, a superior indicator of intrinsic cell wall extensibility is the mean cell wall stiffness. Cell wall thickness and Young's moduli have already been shown to be interlinked in previous studies as they jointly maintain the cell wall stiffness.15,48 The mean cell wall stiffness decreases by the same degree as the mean Young's modulus, but with a smaller standard deviation as it balances variations in the cell wall thickness with the Young's modulus. It seems unlikely that the mean Young's modulus reduces so drastically with increasing initial diameter, so the reduction in mean wall stiffness implies that the thickness must reduce instead. The large standard deviation in measured cell wall thickness for pollen tubes with a range of initial diameters might be due to this effect. Furthermore, a reduction in cell wall thickness as pollen tubes get larger also points to a converging mean circumferential stress across the measured range of initial diameters.
Our analysis indicates that, based on our results, the stress state of the cell wall might not vary significantly with initial diameter as both the mean turgor pressure and mean cell wall stiffness reduce in tandem with increasing pollen tube diameter. The relation between mean turgor pressure and mean cell wall stiffness can be explained by the mechanism of mechanotransduction to maintain the delicate balance of forces at the tip. While the distal cell wall of the pollen tube (where the measurements were taken) does not grow and has been shown to exhibit stress hardening with age,5 it seems likely that it has not deviated significantly from the stress state whilst it was growing. Our results therefore support tip-growth models that use mechanical stimuli-based biological feedback loops to regulate cell wall properties in the tip.45,50,51
Conclusion
Quantification of a tip-growing cells' mechanical properties is important for studying plant cell expansion, morphogenesis, and mechanotransduction. In this paper, we describe a soft indentation technique using a microfluidic device in which pollen tubes can be oriented and their mechanical properties characterized by subjecting them to compression by a soft membrane. By cross-relating experimental and simulation results, we find substantial changes in turgor pressure and cell wall stiffness between pollen tubes of different diameters. The observation that mechanical properties change in tandem supports the theory that tip-growth occurs due to the interplay between these two properties. The LOC device is modular, allowing this procedure to be applied on mutants and other tip-growing cells to investigate the influence of individual wall components on its properties.Acknowledgements
This work was financed through a grant from SystemsX.ch, the Swiss initiative for systems biology (RTD project: MecanX - Understanding Physics of Plant Growth), evaluated by the Swiss National Science Foundation. The authors would like to thank Dr. Mahmut S. Sakar and Dr. Andrew J. Petruska for their critical comments, and David Ruiz Parra, Tatiana Alonso Amor, and the FIRST laboratory for technical support. We acknowledge the center for microscopy and image analyses of the University of Zurich for providing the tools for the ultrastructural analysis of the Lily pollen tubes.References
- B. Barnabas and L. Fridvalszky, Acta Bot. Hung., 1984, 30, 329–332 Search PubMed.
- Y. Chebli, J. Kroeger and A. Geitmann, Mol. Plant, 2013, 6, 1037–1052 CrossRef CAS PubMed.
- L. J. Winship, G. Obermeyer, A. Geitmann and P. K. Hepler, Trends Plant Sci., 2010, 15, 363–369 CrossRef CAS PubMed.
- R. R. Lew, Nat. Rev. Microbiol., 2011, 9, 509–518 CrossRef CAS PubMed.
- R. Zerzour, J. Kroeger and A. Geitmann, Dev. Biol., 2009, 334, 437–446 CrossRef CAS PubMed.
- D. J. Cosgrove, Nature, 2000, 407, 321–326 CrossRef CAS PubMed.
- B. Altartouri and A. Geitmann, Curr. Opin. Plant Biol., 2015, 23, 76–82 CrossRef CAS PubMed.
- A. Geitmann, Curr. Opin. Plant Biol., 2010, 13, 693–699 CrossRef CAS PubMed.
- L. Wang, D. Hukin, J. Pritchard and C. Thomas, Biotechnol. Lett., 2006, 28, 1147–1150 CrossRef CAS PubMed.
- T. I. Baskin, Annu. Rev. Cell Dev. Biol., 2005, 21, 203–222 CrossRef CAS PubMed.
- R. Benkert, G. Obermeyer and F.-W. Bentrup, Protoplasma, 1997, 198, 1–8 CrossRef.
- D. Tomos, Biotechnol. Lett., 2000, 22, 437–442 CrossRef CAS.
- D. Felekis, S. Muntwyler, H. Vogler, F. Beyeler, U. Grossniklaus and B. J. Nelson, Micro Nano Lett., 2011, 6, 311–330 CAS.
- D. Felekis, H. Vogler, G. Mecja, S. Muntwyler, A. Nestorova, T. Huang, M. S. Sakar, U. Grossniklaus and B. J. Nelson, Int. J. Rob. Res., 2015, 34, 1136–1146 CrossRef.
- H. Vogler, C. Draeger, A. Weber, D. Felekis, C. Eichenberger, A.-L. Routier-Kierzkowska, A. Boisson-Dernier, C. Ringli, B. J. Nelson, R. S. Smith and U. Grossniklaus, Plant J., 2013, 73, 617–627 CrossRef CAS PubMed.
- W. Abasolo, M. Eder, K. Yamauchi, N. Obel, A. Reinecke, L. Neumetzler, J. W. C. Dunlop, G. Mouille, M. Pauly, H. Höfte and I. Burgert, Mol. Plant, 2009, 2, 990–999 CrossRef CAS PubMed.
- L. Köhler and H.-C. Spatz, Planta, 2002, 215, 33–40 CrossRef PubMed.
- H. Vogler, D. Felekis, B. Nelson and U. Grossniklaus, Plants, 2015, 4, 167–182 CrossRef CAS PubMed.
- A. Sanati Nezhad, M. Naghavi, M. Packirisamy, R. Bhat and A. Geitmann, Lab Chip, 2013, 13, 2599–2608 RSC.
- A. Sanati Nezhad, M. Naghavi, M. Packirisamy, R. Bhat and A. Geitmann, Proc. Natl. Acad. Sci. U. S. A., 2013, 110, 8093–8098 CrossRef PubMed.
- A. Smith, K. Moxham and A. Middelberg, Chem. Eng. Sci., 1998, 53, 3913–3922 CrossRef CAS.
- C. X. Wang, L. Wang and C. R. Thomas, Ann. Bot., 2004, 93, 443–453 CrossRef CAS PubMed.
- C. Hu, M. Nakajima, T. Yue, M. Takeuchi, M. Seki, Q. Huang and T. Fukuda, Microfluid. Nanofluid., 2014, 17, 457–468 CrossRef CAS.
- Dassault Systemes Simulia Corporation, Abaqus 6.14 User's Manual, 2014 Search PubMed.
- J. A. DeRuntz and P. G. Hodge, J. Appl. Mech., 1963, 30, 391–395 CrossRef.
- S. A. Karamanos and C. Eleftheriadis, Int. J. Mech. Sci., 2004, 46, 35–56 CrossRef.
- A. Geitmann and E. Parre, Sex. Plant Reprod., 2004, 17, 9–16 CrossRef.
- A. Geitmann, W. Mcconnaughey, I. Lang-Pauluzzi, V. E. Franklin-Tong and A. M. Emons, Biophys. J., 2004, 86, 3314–3323 CrossRef CAS PubMed.
- J. Dumais, J. Exp. Bot., 2013, 64, 4681–4695 CrossRef CAS PubMed.
- E. Forouzesh, A. Goel, S. A. Mackenzie and J. A. Turner, Plant J., 2013, 73, 509–520 CrossRef CAS PubMed.
- P. M. Lintilhac, C. Wei, J. J. Tanguay and J. O. Outwater, J. Plant Growth Regul., 2000, 19, 90–97 CrossRef CAS PubMed.
- G. Tomaiuolo, Biomicrofluidics, 2014, 8, 051501 CrossRef PubMed.
- C. T. Mierke, Mol. BioSyst., 2012, 8, 1639–1649 RSC.
- A. Merzouki, O. Malaspinas and B. Chopard, Soft Matter, 2016, 12, 4745–4754 RSC.
- R. Takahashi, S. Ichikawa, A. Subagyo, K. Sueoka and T. Okajima, Adv. Robot., 2014, 28, 449–455 CrossRef.
- W. Shang, H. Lu, W. Wan, T. Fukuda and Y. Shen, Sci. Rep., 2016, 6, 22534 CrossRef CAS PubMed.
- Y. Shen, Z. Zhang and T. Fukuda, Nanotechnology, 2015, 26, 155702 CrossRef PubMed.
- C. Hu, C. Tercero, S. Ikeda, M. Nakajima, H. Tajima, Y. Shen, T. Fukuda and F. Arai, J. Biosci. Bioeng., 2013, 116, 126–131 CrossRef CAS PubMed.
- C. Hu, T. Uchida, C. Tercero, S. Ikeda, K. Ooe, T. Fukuda, F. Arai, M. Negoro and G. Kwon, J. Biotechnol., 2012, 159, 90–98 CrossRef CAS PubMed.
- P. K. Hepler, C. M. Rounds and L. J. Winship, Mol. Plant, 2013, 6, 998–1017 CrossRef CAS PubMed.
- M. Bosch and P. K. Hepler, Plant Cell, 2005, 17, 3219–3226 CrossRef CAS PubMed.
- M. Bosch, A. Y. Cheung and P. K. Hepler, Plant Physiol., 2005, 138, 1334–1346 CrossRef CAS PubMed.
- E. Parre and A. Geitmann, Plant Physiol., 2005, 137, 274–286 CrossRef CAS PubMed.
- P. Schopfer, Am. J. Bot., 2006, 93, 1415–1425 CrossRef PubMed.
- J. H. Kroeger, R. Zerzour and A. Geitmann, PLoS One, 2011, 6, 18549 Search PubMed.
- J. A. Lockhart, J. Theor. Biol., 1965, 8, 264–275 CrossRef CAS PubMed.
- A. Weber, S. Braybrook, M. Huflejt, G. Mosca and R. S. Smith, J. Exp. Bot., 2015, 66, 3229–3241 CrossRef CAS PubMed.
- L. Beauzamy, J. Derr and A. Boudaoud, Biophys. J., 2015, 108, 2448–2456 CrossRef CAS PubMed.
- O. Kedem and A. Katchalsky, Biochim. Biophys. Acta, 1958, 27, 229–246 CrossRef CAS.
- I. C. Mori and J. I. Schroeder, Plant Physiol., 2004, 135, 702–708 CrossRef CAS PubMed.
- P. Fayant, O. Girlanda, Y. Chebli, C.-E. Aubin, I. Villemure and A. Geitmann, Plant Cell, 2010, 22, 2579–2593 CrossRef CAS PubMed.
Footnote |
| † Electronic supplementary information (ESI) available. See DOI: 10.1039/c6lc01145d |
| This journal is © The Royal Society of Chemistry 2017 |