Upregulation of caveolin-1 by mulberry leaf extract and its major components, chlorogenic acid derivatives, attenuates alcoholic steatohepatitis via inhibition of oxidative stress
Yi-Ju
Lee
ab,
Jeng-Dong
Hsu
ac,
Wea-Lung
Lin
ac,
Shao-Hsuan
Kao
*bd and
Chau-Jong
Wang
 *bd
*bd
aDepartment of Pathology, Chung Shan Medical University Hospital, Taichung, Taiwan
bInstitute of Biochemistry, Microbiology and Immunology, Chung Shan Medical University, Taichung, Taiwan
cDepartment of Pathology, School of Medicine, Chung Shan Medical University, Taichung, Taiwan
dClinical Laboratory, Chung Shan Medical University Hospital, Taichung, Taiwan. E-mail: wcj@csmu.edu.tw; kaosh@csmu.edu.tw; Fax: +886-4-2324-8167; Fax: +886-4-2324-8167; Tel: +886-4-24730022 ext 11670 Tel: +886-4-24730022 ext 11681
First published on 19th December 2016
Abstract
Excessive alcohol uptake exerts hepatocellular toxicity, ultimately leading to multiple liver diseases such as steatohepatitis and liver cirrhosis. Here, we aimed to explore the effects of mulberry leaf extract (MLE) and its major components chlorogenic acid (CGA) and neochlorogenic acid (nCGA) on alcoholic steatohepatitis. We determined the composition of MLE using liquid chromatography-mass spectrometric (LC-MS) analysis, which showed that MLE consisted of mainly chlorogenic acid derivatives and other polyphenols. Next, we utilized a high alcohol-fed mouse model and demonstrated that MLE alleviated alcohol-induced hepatocellular disorders, resulting in lowered hepatic injury markers and lipid accumulation. In addition, MLE reduced lipid peroxidation and meanwhile elevated hepatic superoxide dismutase (SOD). Immunohistochemical (IHC) staining revealed that MLE elevated the expression of caveolin-1 but reduced the expressions of epidermal growth factor receptor (EGFR), signal transducer and activator of transcription (STAT), inducible nitric oxide synthase (iNOS) and receptor interacting protein (RIP) 1/3. Major components of MLE, CGA and nCGA, not only exerted a similar biological activity as MLE but also inhibited alcohol-induced pro-apoptotic signals. Involvement of caveolin-1 in MLE, CGA and nCGA was demonstrated by using specific small inhibitory RNA. In conclusion, MLE and its chlorogenic derivatives CGA and nCGA upregulate caveolin-1 expression and diminish EGFR/STAT3/iNOS signalling, which may contribute to lowered hepatic lipid accumulation and peroxidation and inhibited pro-apoptotic cascades.
Introduction
Excessive alcohol uptake is a widely known risk factor that causes a series of liver disorders such as fatty liver, steatohepatitis and hepatic cirrhosis and increases the incidence of hepatocellular carcinoma, particularly in people who consume 80 g alcohol per day for 10 years.1 In addition to genetic background and its complicated interaction with environmental factors, nutritional and hepatotoxic comorbidities are able to promote the development of liver disease.2,3 Lipid peroxidation and oxidative stress also play important roles in alcohol-induced hepatotoxicity. Chronic alcohol consumption is known to be associated with hepatic oxidative stress and inflammation, indicating a pathological linkage between alcohol uptake and liver disorders.The hepatocyte is particularly sensitive to injury as a result of its primary function in xenobiotic metabolism including drugs and alcohol and participation in nutrient metabolism including lipid and fatty acid. Apoptosis is one of the most extensively recognized forms of hepatocyte cell death.4 Hepatocyte apoptosis has been considered as a pivotal step in most forms of liver injury, which is enhanced in association with inflammation and fibrosis.5,6 In addition, engulfment of apoptotic bodies by resident macrophages in the liver, Kupffer cells, triggers more apoptosis of hepatocytes via a death receptor-mediated pathway that may further aggravate liver inflammation and fibrosis.7,8 Recent evidence implies that apoptotic cells also induce the release of ATP and UTP which can bind to purinergic receptors on macrophages and hepatic stellate cells and subsequently promote hepatic fibrosis.9,10 These findings suggest that excessive apoptosis plays a pivotal role in hepatic inflammation and fibrogenesis.
Mulberry leaf (Morus alba L.) is extensively used as a functional food and traditional remedy for metabolic disorders such as dyslipidemia,11 diabetes,12 fatty liver disease,13 and hypertension14 in Asia. Mulberry leaf extract (MLE) contains enriched polyphenolics including rutin, quercetin, and 1-deoxynojirimycin (DNJ), and is known to enhance antioxidant enzyme activities in diabetic rats15 and attenuate lipid metabolic disorder in high-fat diet fed mice.16 In Taiwan, the mulberry leaf is commonly processed as a commercial beverage (mulberry tea) and health food. Our previous study has demonstrated that mulberry water extracts possess bioactivity against hepatic inflammation and lipogenesis to alleviate liver injury induced by ethanol.17 However, whether MLE possesses protective bioactivity to alleviate alcoholic steatohepatitis and its underlying mechanism is incompletely understood. Therefore, we aimed to elucidate the protective effects of MLE on alcoholic steatohepatitis with emphasis on liver function and hepatic lipid accumulation, oxidative stress and apoptosis.
Materials and methods
MLE preparation
Mulberry leaves (200 g) were freshly collected, dried in an oven at 50 °C, and then incubated in 3 L boiling deionized water. After removing the residue, the supernatant was stored at −80 °C overnight and then lyophilized. The dried powder was incubated with ethanol at 50 °C for 3 hours (h), lyophilized, resuspended in distilled water, and then extracted with ethyl acetate to enrich polyphenols as previously described.18 The polyphenol-enriched mulberry leaf extract (MLE) was passed through a 0.22 μm filter prior to use for cell treatment.Components’ analysis of MLE
The components of MLE were demonstrated by using HPLC coupled with LC-MS analysis. Briefly, MLE was analyzed with a Hitachi HPLC system (D-7000, Hitachi, Danbury, CT, USA) equipped with an ultraviolet detector (L-4250) and a Mightysil RP-18 GP 250 column (Kanto, Tokyo, Japan) using solvent A [acetic acid/water (2![[thin space (1/6-em)]](https://www.rsc.org/images/entities/char_2009.gif) :
:![[thin space (1/6-em)]](https://www.rsc.org/images/entities/char_2009.gif) 98, v/v)] and solvent B [0.5% acetic acid in water/acetonitrile (50
98, v/v)] and solvent B [0.5% acetic acid in water/acetonitrile (50![[thin space (1/6-em)]](https://www.rsc.org/images/entities/char_2009.gif) :
:![[thin space (1/6-em)]](https://www.rsc.org/images/entities/char_2009.gif) 50, v/v)]. The fractionation was performed using a constant flow rate at 1 mL min−1, and the gradient for the separation was 100% solvent A (0 min), 70% solvent A and 30% solvent B (5 min), 65% solvent A and 35% solvent B (50 min), 60% solvent A and 40% solvent B (55 min), and 100% solvent B (60 min). Phenolic acids were detected at 260 nm. The phenolic components isolated from HPLC were then identified by using liquid chromatography-mass spectrometric (LC-MS) analysis.
50, v/v)]. The fractionation was performed using a constant flow rate at 1 mL min−1, and the gradient for the separation was 100% solvent A (0 min), 70% solvent A and 30% solvent B (5 min), 65% solvent A and 35% solvent B (50 min), 60% solvent A and 40% solvent B (55 min), and 100% solvent B (60 min). Phenolic acids were detected at 260 nm. The phenolic components isolated from HPLC were then identified by using liquid chromatography-mass spectrometric (LC-MS) analysis.
Animals and treatments
A total of forty C57BL/6 male mice, aging 4–5 weeks and weighing 12–16 g, were maintained under air conditioning (24 ± 2 °C) and illuminated for 12 h daily (lights on from 6:00 a.m. to 6:00 p.m.). After one week of maintenance, the mice were randomly grouped into five groups by body weight. Liquid diets provided 1 kcal mL−1 (prepared by Dyets, Inc., Bethlehem, PA, USA) based on the Lieber–DeCarli formulation. The diet contained 35% of calories from fat, 11% from carbohydrate, 18% from protein, and 36% from ethanol (95% ethanol was purchased from Taiwan Tobacco and Liquor Corporation, Taichung, Taiwan) or isocaloric maltose dextrin (control group). MLE (0.5%, 1.0% and 2.0%) was prepared by mixing with an ethanol-containing liquid diet. The control group continued to be fed with the Lieber–DeCarli control diet. The ethanol-fed mice were acclimated to their diets over a 7-day period by feeding graded ethanol at 12% of total energy on days 1 and 2, 24% on days 3 and 4, and 36% on day 5 and thereafter. All mice were fed assigned diets (10–12 kcal per day for each mouse) and ad libitum. Food and water were replenished every day. The five dietary groups were the control group: Lieber–DeCarli control diet, the ethanol group: the control diet containing 5% (v/v) ethanol (36% ethanol-derived calories), and E + 0.5% MLE, E + 1% MLE and E + 2% MLE group: the control diet containing 5% (v/v) ethanol and 0.5%, 1.0% and 2.0% (w/w) MLE, respectively. The animals were fed for 8 weeks and then sacrificed for the subsequent analysis. All the animal experiments were approved by the Instituted Animal Care and Use Committee of Chung Shan Medical University (IACUC, CSMU, approval no. 1211) and performed in accordance with the guidelines of IACUC.Blood sample analysis
Blood samples were collected using heparin-coated tubes and then centrifuged at 1500g for 10 min at 4 °C. Plasma levels of aspartate aminotransferase (AST), alanine transaminase (ALT), alkaline phosphatase (ALP), total triglyceride (TG), total cholesterol (CHO), high-density lipoprotein cholesterol (HDL) and low-density lipoprotein cholesterol (LDL) were measured using a Beckman Synchron CX9 clinical system (Beckman Coulter Co.). Plasma AST and ALT activities were determined by using Boehringer Mannheim reagents.Determination of hepatic lipids in liver tissue
The hepatic lipids were extracted by using previously described methods with modifications.19 Briefly, liver tissue (0.2 g) was homogenized with chloroform/methanol (v/v: 1/2), and then a mixture of chloroform/distilled water (v/v: 1/1) was added to the homogenate and mixed thoroughly. After centrifugation at 1500g for 10 min, the lower clear organic phase solution was transferred into a new glass tube and lyophilized. The lyophilized powder was dissolved in chloroform/methanol (v/v: 1/2) as the hepatic lipid extract and stored at −20 °C. The CHO and TC in the hepatic lipid extracts were measured by enzymatic colorimetric methods using commercial kits (HUMAN, Wiesbaden, Germany).Lipid peroxidation and superoxide dismutase (SOD) determination
Lipid peroxidation was demonstrated based on the level of thiobarbituric acid reactive substances (TBARS).20 For the determination of the lipid oxidation products in homogenates from the liver, the fluorescence of the samples was detected at an excitation wavelength of 515 nm and an emission wavelength of 555 nm with an F4500 fluorescence spectrophotometer (Hitachi, Japan). 1,1,3,3-Tetramethoxypropane was used as the standard. SOD determination was performed by using a modified Marklund method as previously described.21 Briefly, samples were measured at an excitation wavelength of 420 nm using a U-2900 spectrophotometer (Hitachi, Japan) for 3 min.Immunohistochemistry staining
Liver sections were deparaffinized with xylene, rehydrated in a graded alcohol series and blocked with 97% methanol or 5% BSA/methanol for 10–30 min. Then, the sections were washed with PBS and reacted with primary antibodies against mouse CD68 (for the Kupffer cell), actin (for the stellate cell), inducible nitric oxide synthase (iNOS), caveolin-1, phosphorylated extracellular signal-regulated kinase (p-ERK), phosphorylated epidermal growth factor receptor (p-EGFR), signal transducer and activator of transcription 3 (STAT3), receptor-interacting protein 1 (RIP1) and RIP3 (Santa Cruz Biotechnology, Santa Cruz, CA, USA). Undiluted peroxidase-conjugated goat anti-mouse/rabbit IgG polyclonal antibodies were used as the secondary antibody. After washing with PBS, the sections were counterstained with Meyer's hematoxylin and washed with tap water.Cell culture and treatments
The human hepatoma cell line HepG2 was obtained from the American Type Culture Collection, maintained in DMEM supplemented with 10% fetal calf serum, 100 U mL−1 penicillin, 100 μg mL−1 streptomycin, and 2 mM L-glutamine and cultured at 37 °C under a humidified atmosphere containing 5% CO2. Cells grown to 70% confluence were transferred into a serum-free medium for 16 h before the subsequent treatments. For treatments, cells were plated in 6-well plates at a rate of 2 × 10⁵ cells per well and treated with 2 mg mL−1 MLE, 0.1 mg mL−1 chlorogenic acid (CGA), or 0.1 mg mL−1 neochlorogenic acid (nCGA) for 1 h, and then incubated with 50 mM ethanol for 24 h. After the treatments, the cells were washed with PBS and then homogenized in PBS containing 1% Nonidet P-40, 1 mM phenylmethylsulfonyl fluoride, and 1 mM sodium fluoride. The homogenate was centrifuged at 20![[thin space (1/6-em)]](https://www.rsc.org/images/entities/char_2009.gif) 000g for 15 min to remove insoluble debris, and the resulting supernatant was subjected to immunoblotting.
000g for 15 min to remove insoluble debris, and the resulting supernatant was subjected to immunoblotting.
Immunoblotting
The protein level was determined by immunoblotting using specific antibodies and chemiluminescence. Briefly, 30 μg crude protein was subjected to SDS-polyacrylamide gel electrophoresis and then transferred onto nitrocellulose membranes (Millipore, Bedford, MA, USA). The membranes were blocked with 5% non-fat milk in PBS containing 0.05% Tween 20, and then incubated with the primary antibody at 4 °C overnight. Thereafter, the reacted membranes were washed with 0.05% Tween 20 in PBS, and then incubated with the secondary antibody conjugated with horseradish peroxidase (GE Healthcare, Little Chalfont, Buckinghamshire, UK). Signals were developed by using enhanced chemiluminescence using ECL Western blotting detection reagents, then monitored and semi-quantitated with an image analysis system using Multi Gauge V2.2 software (Fujifilm Las-3000, Tokyo, Japan).RNA interference
Short interfering RNA (siRNA) transfection was applied to knockdown the expression of caveolin-1 in HepG2 cells. Specific siRNA against caveolin-1 and the non-specific negative control were obtained from Invitrogen as previously described.24 Cav-1 Stealth™ RNAi provided a non-overlapping Stealth™ RNAi duplex, which was transfected into HepG2 cells with T-Pro NTR II reagent (Ji-Feng Biotechnology Co., Ltd, Taiwan) to obtain high knockdown efficiency. The Cav-1 stealth™ RNAi duplex was added at the concentration of 20 nM, and the Stealth™ RNAi negative control (Invitrogen, Carlsbad, CA, USA) was used as the control. Control non-silencing siRNA (5′-UUC UCC GAA CGU GUC ACG UTT-3′, 5′-ACG UGA CAC GUU CGG AGA ATT-3′) caveolin-1 siRNA targeting (3 lines pooled, 5′-UCG ACC UGG UCA ACC GCG ACC CUA A-3′, 5′-UUA GGG UCG CGG UUG ACC AGG UCG A-3′, and 5′-CCC ACU CUU UGA AGC UGU UGG GAA A-3′).TUNEL assay
TUNEL assay was performed on liver sections using an in situ cell death detection kit, ApopTag Peroxidase In situ Apoptosis Detection kit (Intergen Co., NY). Tissue sections were washed with PBS for 5 min and incubated with 3% H2O2 in PBS for 5 min. The TUNEL (terminal deoxynucleotidyl transferasemediated dUTP nick end labeling) reaction mixture was freshly prepared according to the manufacturer's instructions (Intergen Co., NY). In brief, a total volume of 100 μL of terminal deoxytransferase reaction mixture was incubated with the tissue sections for 1 h at room temperature in the dark. Images were obtained at 200 magnitude by using a light microscope (Zeiss, Oberkochen, Germany).Statistical analysis
Quantitative data were analyzed using an unpaired t-test and represented as means ± standard deviation (SD). One-way ANOVA was performed and the P values less than 0.05 were considered as statistically significant.Results
Components identified in MLE
The aqueous extract of mulberry leaf (100 g) produced approximately 32 g of lyophilized polyphenol-enriched MLE powder (a yield of approximately 32%). The phenolic compounds in MLE were isolated by HPLC (Fig. 1) and the following compounds were identified by LC-MS analysis (Table 1), including protocatechuic acid (0.013%), neochlorogenic acid (nCGA, 0.355%), chlorogenic acid (CGA, 0.238%), cryptochlorogenic acid (0.317%), nicotiflorin (0.035%), rutin (0.092%), isoquercitrin (0.056%) and astragalin (0.053%). On average, each mouse was daily fed with 10 g of the diet containing 0.5% MLE; thus, the daily intake of nCGA and CGA per mouse was approximately 177.4 μg and 119.2 μg, respectively.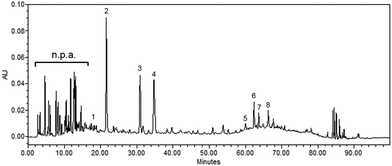 | ||
| Fig. 1 The HPLC chromatogram of MLE. Ten mg mL−1 MLE was analyzed by HPLC chromatography and absorbance at 280 nm for polyphenols was monitored. The isolated polyphenols (numbered peaks) were further identified by using LC-MS analysis as indicated in Table 1. n.p.a., non-phenolic acids. | ||
| Peak no. | RT (min) | [M − H]− (m/z) | UV band (nm) | Compound name | Concentration (μg per 10 mg) | Intake per day (μg) |
|---|---|---|---|---|---|---|
| RT, retention time. | ||||||
| 1 | 18.83 | 153.1 | 259.7 (max), 294.1 | Protocatechuic acid | 1.3 ± 0.6 | 6.3 |
| 2 | 21.58 | 355.7 [M + H] | 241.9, 325.1 (max) | Neochlorogenic acid | 35.5 ± 2.7 | 177.4 |
| 3 | 30.90 | 355.7 [M + H] | 238.4, 326.3 (max) | Chlorogenic acid | 23.8 ± 1.5 | 119.2 |
| 4 | 34.73 | 355.7 [M + H] | 241.9, 326.3 (max) | Cryptochlorogenic acid | 31.7 ± 2.4 | 158.7 |
| 5 | 60.05 | 595.9 [M + H] | 265.6 (max), 177.4, 346.6 | Nicotiflorin | 3.5 ± 0.5 | 17.5 |
| 6 | 62.35 | 609.2 | 256.1 (max), 355.0 | Rutin | 9.2 ± 0.6 | 45.9 |
| 7 | 63.64 | 463.5 | 256.1 (max), 355.0 | Isoquercitrin | 5.6 ± 0.7 | 28.1 |
| 8 | 66.28 | 449.7 [M + H] | 265.6 (max), 346.6 | Astragalin | 5.3 ± 0.5 | 26.7 |
MLE alleviated alcohol-induced liver disorders and reduced hepatic lipids in alcohol-fed mice
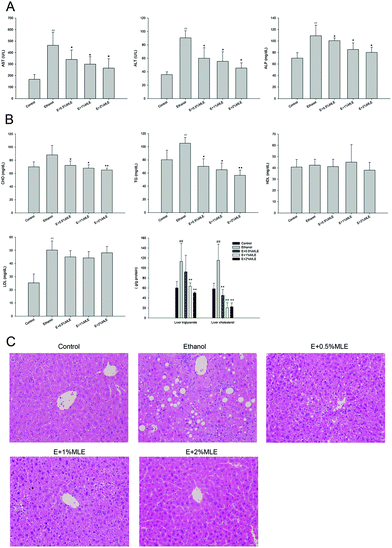
The effects of MLE on alcohol-induced liver injury were first investigated. As shown in Fig. 2(A), plasma ALT, AST and ALP activities, the well-known liver injury biomarkers, were increased in response to alcohol uptake (P < 0.01 as compared to the control group). In addition, the MLE supplement (0.5%, 1% and 2%) significantly reduced the activity of these liver injury biomarkers in a dose-dependent manner (P < 0.05 as compared to the alcohol group). In parallel to the promotion of liver injury, ethanol uptake also increased the level of hepatic cholesterol, TG, and LDL, but insignificantly affected the level of hepatic HDL (Fig. 2(B)). Notably, the MLE supplement significantly reduced the level of hepatic cholesterol, and TG (P < 0.05 as compared to the ethanol group); however, the levels of hepatic HDL and LDL were slightly altered in response to the MLE supplement (Fig. 2(B)). The liver injury and hepatic lipid accumulation were also demonstrated by using histopathological evaluation. As shown in Fig. 2(C), the liver sections from the control group showed normal hepatic cells with a well-preserved cytoplasm, prominent nucleolus, and portal vein. In contrast, the liver sections from the ethanol group showed a moderate degree of infiltration of leukocytes, a severe degree of diffuse liver fatty infiltration, and a mild degree of degeneration. Interestingly, the MLE supplement significantly ameliorated the ethanol-induced liver tissue damage and the tissue conditions were recovered similar to the observation in the control group (Fig. 2(C)). Taken together, these findings revealed that ethanol uptake induced liver injury and promoted hepatic lipid accumulation, which was alleviated and attenuated by the MLE supplement, respectively.MLE suppressed hepatic lipid peroxidation and enhanced SOD activity in ethanol-fed mice
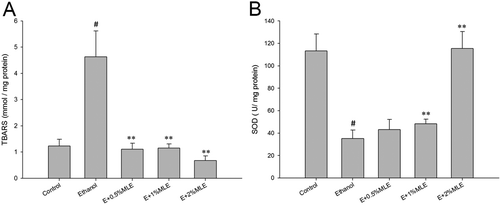
Oxidative stress-induced cellular damage has been reported as a major cause of alcoholic liver injury. Thus, cellular oxidative stress was next investigated. As shown in Fig. 3(A), the hepatic level of TBARS, a common oxidative stress marker, was significantly elevated in response to ethanol treatment. In addition, the elevated hepatic level of TBARS was reduced by the MLE supplement (P < 0.01 as compared to the ethanol group). In parallel to TBARS, the hepatic level of SOD, the enzyme that plays a pivotal role in protecting hepatocytes from oxidative damage, was also determined. Our results revealed that hepatic SOD activity was suppressed by ethanol treatment (P < 0.05 as compared to the control group). Notably, the MLE supplement (1% and 2%) significantly restored the hepatic SOD activity which was inhibited by ethanol (P < 0.01 as compared to the ethanol group) (Fig. 3(B)). Collectively, these findings revealed that ethanol reinforced hepatic oxidative stress and suppressed anti-oxidative enzyme activity, which was restored by the MLE supplement.MLE inhibited the Kupffer cell activation and hepatocyte apoptosis in ethanol-fed mice
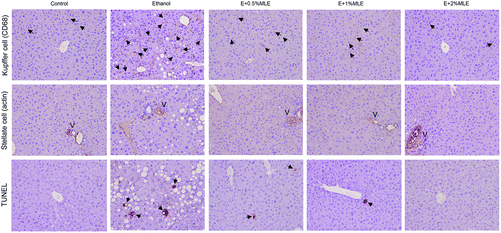
Activation of Kupffer cells and stellate cells is known to play important roles in alcoholic liver diseases.22,23 Thus, the effects of MLE on activation of Kupffer cells and stellate cells were examined. As shown in Fig. 4, ethanol induced activation of Kupffer cells (upper panel) and apoptosis of hepatocytes (bottom panel), which were significantly inhibited by the MLE supplement. In contrast to Kupffer cells, ethanol alone induces neither proliferation of stellate cells nor hepatic fibrosis, and ethanol with the MLE supplement treatment also insignificantly influenced the proliferation of stellate cells and hepatic fibrosis (middle panel). These observations showed that the MLE supplement inhibited the ethanol-induced Kupffer cell activation and hepatocyte apoptosis, whereas did not influence stellate cell proliferation and hepatic fibrosis.MLE promoted hepatic caveolin-1 expression and suppressed hepatic EGFR-mediated signaling in ethanol-fed mice
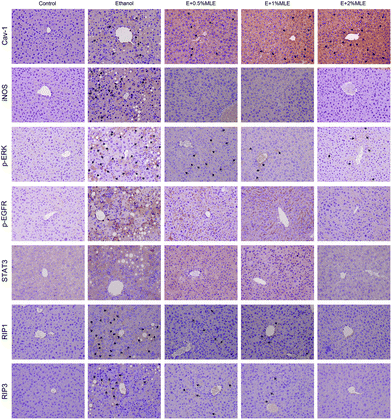
Caveolin-1 has been reported to play a pivotal role in attenuating alcoholic hepatic injury through inhibiting epidermal growth factor receptor (EGFR), signal transducer and activator of transcription 3 (STAT3), and inducible nitric oxide synthase (iNOS) signaling.24 Thus, whether caveolin-1 expression and the associated signalling components in the liver are mediated by MLE is investigated. As shown in Fig. 5, ethanol uptake obviously elevated the level of caveolin-1 (Cav-1) and iNOS, phosphorylated ERK (p-ERK), EGFR (p-EGFR), and STAT3 (p-STAT3), and receptor-interacting protein 1 (RIP1) and RIP3. Notably, the MLE supplement significantly and dose-dependently promoted the caveolin-1 expression level as compared to ethanol uptake alone; meanwhile, lowered the elevated levels of p-EGFR, p-STAT3, iNOS and RIP1/3 in response to ethanol uptake. These findings revealed that the MLE supplement promoted caveolin-1 expression and suppressed EGFR/STAT3/iNOS signalling cascades involved in the ethanol-induced hepatic injury.MLE and its major components chlorogenic acid and neochlorogenic acid promoted SOD, suppressed iNOS and EGFR/STAT3/ERK signals, and activated pro-apoptotic cascades via upregulation of caveolin-1 in HepG2 cell with exposure to ethanol
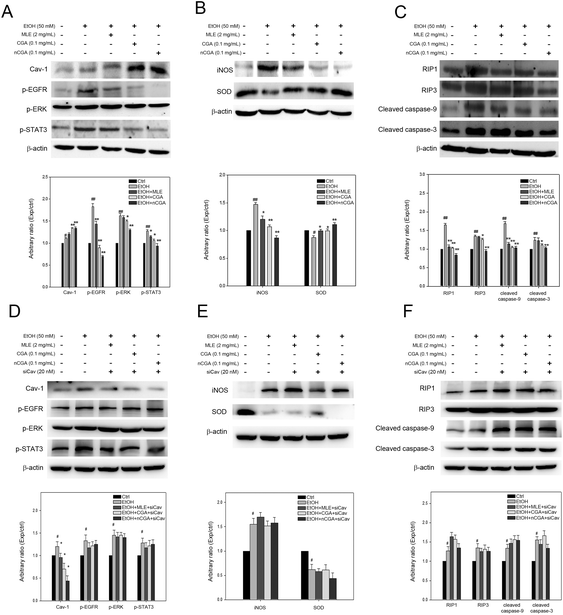
Since the MLE supplement was able to regulate EGFR/STAT3/ERK/iNOS signalling cascades, the effects of MLE and its major components chlorogenic acid (CGA) and neochlorogenic acid (nCGA) on caveolin-1 and the associated signalling were further investigated. As shown in Fig. 6(A), ethanol treatment (50 mM) significantly induced phosphorylation of EGFR, ERK, and STAT3 in the human hepatocellular carcinoma cell Hep2B and the promoted phosphorylation was inhibited by MLE, CGA, and nCGA, which was similar to the observation in ethanol-fed mouse liver. Notably, CGA and nCGA significantly promoted the caveolin-1 expression level in the cells exposed to ethanol. In addition, both CGA and nCGA suppressed iNOS expression but restored SOD expression in the cells exposed to ethanol [Fig. 6(B)]. Moreover, compared to MLE and CGA, nCGA exerted a robust inhibitory effect on RIP1, RIP3 and activation of caspase-9 and caspase-3 in HepG2 cells stimulated with ethanol [Fig. 6(C)]. The importance of Cav-1 in MLE, CGA and nCGA inducing signal cascades was further demonstrated by using specific siRNA against caveolin-1. As shown in Fig. 6(D), the level of Cav-1 was decreased by the specific siRNA (siCav). In parallel, signal cascades induced by MLE, CGA and nCGA were also counteracted by the specific siRNA. Taken together, these findings revealed that MLE and its major components CGA and nCGA promoted caveolin-1 expression, restored SOD expression, decreased iNOS, RIP1/3 expression, and suppressed EGFR/ERK/STAT3 and caspase-mediated apoptotic signalling.Discussion
Heavy consumption of alcohol that causes the development of various liver disorders is an important health issue and is receiving increased attention. Therefore, the discovery of efficient agents to prevent or ameliorate alcohol-induced liver diseases is urgently needed. Here, we prepared a mulberry leaf extract (MLE) consisting of enriched polyphenols and explored its hepatoprotective activity on ethanol-induced liver injury and the associated disorders. Our findings reveal that the ethanol uptake (36% of daily energy) obviously increases liver injury markers AST, ALT, and ALP, indicating that liver injury is induced in response to ethanol uptake. In parallel, the increased level of blood lipids, including cholesterol, triacylglycerol, and LDL, is also observed in ethanol-fed mice as previously reported.25 These findings indicate that the in vivo ethanol-induced liver injury model is well achieved.Liver is the main organ that controls cholesterol and fatty acid metabolism. Previous studies have demonstrated that alcohol-induced malfunction of liver contributes to the abnormal level of blood lipids and accumulated hepatic lipids.26,27 In addition, hyperlipidemia and hypercholesterolemia are both key risk factors that are highly associated with the development and progression of various cardiovascular diseases.28 Mulberry leaves have been reported to improve high fat diet-induced hepatic lipogenesis and oxidative stress.16 Similarly, our previous study also indicated that mulberry water extracts not only inhibit hepatic lipogenesis and oxidative stress, but also suppress NF-κB signaling and the associated expression of proinflammatory factors such as iNOS, cyclooxygenase 2, tumor necrosis factor-alpha, and IL-6.17 In this study, although MLE slightly influences the serum levels of LDL and HDL, MLE significantly lowers the serum levels of AST, ALT, ALP, cholesterol and triacylglycerol, elevates hepatic SOD, and attenuates hepatic lipid accumulation and peroxidation, which are dysregulated in response to high ethanol uptake. Accordingly, it suggests that MLE may ameliorate the liver functions and alleviate liver injury in response to high ethanol uptake.
Reactive oxygen species (ROS) and reactive nitrogen species (RNS) are both free radicals involved in both alcoholic and non-alcoholic liver injury.29–31 A series of antioxidant enzymes such SOD and catalase that reduce these free radicals regulate the redox balance and prevent hepatocytes from oxidative stress-induced injury.32 Our results showed that MLE significantly restored the SOD activity and diminished the TBARS in the liver of ethanol-fed mice, indicating that MLE could attenuate hepatic oxidative stress in response to ethanol uptake.
Kupffer cells are the major resident macrophages in the liver, mainly located within the hepatic sinusoids to clear pathogens. Normally, activation of Kupffer cells is essential to the protection against hepatic infection and injury.33 However, Kupffer cells are also the first identified contributor to the alcoholic liver diseases.23 Our observations showed that MLE suppressed the activation of Kupffer cells in the liver of ethanol-fed mice, suggesting that MLE may limit the harmful activity attributed to Kupffer cells and attenuate the hepatic injury in response to ethanol. On the other hand, stellate cell activation is crucial to liver fibrosis in response to ethanol, possibly through the ethanol-induced hypoxia, lipid peroxides and acetaldehyde that may exert fibrogenic activity.22 Interestingly, stellate cell activation and fibrogenic activity in the liver were not induced in our ethanol-fed mice model. It could be due to the difference in ethanol fed dose and treatment duration. The effects of MLE and its major chlorogenic derivatives on stellate activation and hepatic fibrosis need further investigation.
Recently, caveolin-1 has been reported to play a pivotal role in alcoholic liver injury via inhibition of RNS production.24 Caveolin-1 binding to EGFR can regulate EGFR signalling that leads to nuclear interplay of EGFR and STAT3 and consequently enhances iNOS transcription, indicating that EGFR/STAT3/iNOS is an important target of caveolin-1.34,35 In addition, ERK can promote hepatic caveolin-1 expression and cross-activation of ERK by caveolin-1 plays a role in ethanol-induced liver injury.24,36 Our results reveal that MLE supplement not only promotes caveolin-1 expression but also lowers the iNOS expression level and inhibits EGFR, STAT3 and ERK activation in the liver of ethanol-fed mice. Moreover, we further demonstrate that the MLE supplement reduces RIP1 and RIP3, the key players in necroptosis, which are elevated in response to high ethanol uptake.21 Similar effects induced by MLE, CGA and nCGA are also observed in human hepatocellular carcinoma cells HepG2 exposed to ethanol. The involvement of caveolin-1 in ethanol-induced activation of EGFR, STAT3, ERK, RIP1/3 and caspase-9/3 in HepG2 cells is also demonstrated by using specific siRNA against caveolin-1. Collectively, these findings reveal that MLE and its major components, particularly CGA and nCGA, suppress EGFR/STAT3/iNOS, RIP1/3 and pro-apoptotic signals, which may attribute to the promoted caveolin-1 expression level. Thus, it suggests that MLE not only possesses robust antioxidant activity that inhibits hepatic inflammation but also exerts potential anti-programmed cell death capability that protects hepatocytes from death.
In conclusion, by using an in vivo ethanol-induced liver injury mouse model, our findings demonstrate that the MLE supplement lowers blood cholesterol and TG and hepatic lipid accumulation in response to high ethanol uptake, implying that MLE can alleviate ethanol-induced abnormal lipid metabolism. In addition, MLE is able to promote caveolin-1 expression and subsequently suppresses EGFR/STAT3/iNOS and RIP1/3-mediated pro-apoptotic signalling, consequently ameliorating ethanol-induced liver injury. Thus, we suggest that MLE and its chlorogenic derivatives are beneficial to chronic liver diseases in response to high alcohol uptake.
Conflict of interest
The authors declare that there are no conflicts of interest.Acknowledgements
This work was supported by a grant from the Ministry of Science and Technology (MOST 104-2632-B-040-002), Taiwan.References
- J. Rehm, C. Mathers, S. Popova, M. Thavorncharoensap, Y. Teerawattananon and J. Patra, Lancet, 2009, 373, 2223–2233 CrossRef.
- S. Pincock, Lancet, 2003, 362, 1126–1127 CrossRef.
- P. Mathurin and P. Deltenre, Gut, 2009, 58, 613–617 CrossRef CAS PubMed.
- H. Malhi, M. E. Guicciardi and G. J. Gores, Physiol. Rev., 2010, 90, 1165–1194 CrossRef CAS PubMed.
- J. P. Andrade, D. K. Arnett, F. Pinto, D. Pineiro, S. C. Smith Jr., L. A. Mattos, C. A. Machado, G. M. Oliveira, H. F. Dohmann and S. Gielen, Arq. Bras. Cardiol., 2013, 100, 3–5 CrossRef PubMed.
- T. Takehara, T. Tatsumi, T. Suzuki, E. B. Rucker 3rd, L. Hennighausen, M. Jinushi, T. Miyagi, Y. Kanazawa and N. Hayashi, Gastroenterology, 2004, 127, 1189–1197 CrossRef CAS.
- A. Canbay, A. E. Feldstein, H. Higuchi, N. Werneburg, A. Grambihler, S. F. Bronk and G. J. Gores, Hepatology, 2003, 38, 1188–1198 CrossRef CAS PubMed.
- H. Tunstall-Pedoe, D. Vanuzzo, M. Hobbs, M. Mahonen, Z. Cepaitis, K. Kuulasmaa and U. Keil, Lancet, 2000, 355, 688–700 CrossRef CAS.
- J. A. Dranoff, M. Ogawa, E. A. Kruglov, M. D. Gaca, J. Sevigny, S. C. Robson and R. G. Wells, Am. J. Physiol.: Gastrointest. Liver Physiol., 2004, 287, G417–G424 CrossRef CAS PubMed.
- J. O. Hill, H. R. Wyatt and J. C. Peters, Circulation, 2012, 126, 126–132 CrossRef PubMed.
- K. F. Azman, Z. Amom, A. Azlan, N. M. Esa, R. M. Ali, Z. M. Shah and K. K. Kadir, J. Nat. Med., 2012, 66, 333–342 CrossRef PubMed.
- M. B. Flores, G. Z. Rocha, D. M. Damas-Souza, F. Osorio-Costa, M. M. Dias, E. R. Ropelle, J. A. Camargo, R. B. de Carvalho, H. F. Carvalho, M. J. Saad and J. B. Carvalheira, Gastroenterology, 2012, 143, 741–753 CrossRef CAS PubMed.
- T. T. Ou, M. J. Hsu, K. C. Chan, C. N. Huang, H. H. Ho and C. J. Wang, J. Sci. Food Agric., 2011, 91, 2740–2748 CrossRef CAS PubMed.
- A. Kobayashi, M. I. Kang, Y. Watai, K. I. Tong, T. Shibata, K. Uchida and M. Yamamoto, Mol. Cell. Biol., 2006, 26, 221–229 CrossRef CAS PubMed.
- U. S. Ha, W. J. Bae, S. J. Kim, B. I. Yoon, H. Jang, S. H. Hong, J. Y. Lee, S. Y. Hwang and S. W. Kim, Neurourol. Urodyn., 2013, 32, 493–499 CrossRef CAS PubMed.
- J. Y. Ann, H. Eo and Y. Lim, Genes Nutr., 2015, 10, 46 CrossRef PubMed.
- C. C. Tang, H. P. Huang, Y. J. Lee, Y. H. Tang and C. J. Wang, Food Chem. Toxicol., 2013, 62, 786–796 CrossRef CAS PubMed.
- S. J. Yang, N. Y. Park and Y. Lim, Nutr. Res. Pract., 2014, 8, 613–617 CrossRef PubMed.
- C. Chen, D. C. Wen, S. D. Gao, X. Y. Hu and C. Yi, Evidence-Based Complementary Altern. Med., 2016, 2016, 3539748 Search PubMed.
- X. Yu and S. He, Virol. J., 2016, 13, 77 CrossRef PubMed.
- S. He, S. Huang and Z. Shen, Cell. Mol. Life Sci., 2016, 73, 2177–2181 CrossRef CAS PubMed.
- S. L. Friedman, Alcohol.: Clin. Exp. Res., 1999, 23, 904–910 CAS.
- L. E. Nagy, Exp. Biol. Med., 2003, 228, 882–890 CAS.
- L. Gao, Y. Zhou, W. Zhong, X. Zhao, C. Chen, X. Chen, Y. Gu, J. Chen, Z. Lv and J. Shen, Hepatology, 2014, 60, 687–699 CrossRef CAS PubMed.
- X. Cai, L. Bao, N. Wang, M. Xu, R. Mao and Y. Li, Molecules, 2016, 21(4), 435 CrossRef PubMed.
- C. T. Liu, R. Raghu, S. H. Lin, S. Y. Wang, C. H. Kuo, Y. J. Tseng and L. Y. Sheen, J. Agric. Food Chem., 2013, 61, 11231–11240 CrossRef CAS PubMed.
- B. U. Bradford, T. M. O'Connell, J. Han, O. Kosyk, S. Shymonyak, P. K. Ross, J. Winnike, H. Kono and I. Rusyn, Toxicol. Appl. Pharmacol., 2008, 232, 236–243 CrossRef CAS PubMed.
- T. V. Jardim, A. L. Sousa, T. I. Povoa, W. K. Barroso, B. Chinem, L. Jardim, R. Bernardes, A. Coca and P. C. Jardim, BMC Public Health, 2015, 15, 1111 CrossRef PubMed.
- G. Paradies, V. Paradies, F. M. Ruggiero and G. Petrosillo, World J. Gastroenterol., 2014, 20, 14205–14218 CrossRef PubMed.
- S. K. Mantena, A. L. King, K. K. Andringa, H. B. Eccleston and S. M. Bailey, Free Radical Biol. Med., 2008, 44, 1259–1272 CrossRef CAS PubMed.
- A. P. Rolo, J. S. Teodoro and C. M. Palmeira, Free Radical Biol. Med., 2012, 52, 59–69 CrossRef CAS PubMed.
- T. A. Ajith and K. K. Janardhanan, Int. J. Med. Mushrooms, 2015, 17, 1061–1067 CrossRef PubMed.
- J. Han and R. J. Ulevitch, Nat. Immunol., 2005, 6, 1198–1205 CrossRef CAS PubMed.
- H. W. Lo, S. C. Hsu, M. Ali-Seyed, M. Gunduz, W. Xia, Y. Wei, G. Bartholomeusz, J. Y. Shih and M. C. Hung, Cancer Cell, 2005, 7, 575–589 CrossRef CAS PubMed.
- J. Couet, M. Sargiacomo and M. P. Lisanti, J. Biol. Chem., 1997, 272, 30429–30438 CrossRef CAS PubMed.
- C. Meyer, J. Dzieran, Y. Liu, F. Schindler, S. Munker, A. Muller, C. Coulouarn and S. Dooley, Cell Commun. Signaling, 2013, 11, 6 CrossRef CAS PubMed.
| This journal is © The Royal Society of Chemistry 2017 |

