 Open Access Article
Creative Commons Attribution 3.0 Unported Licence
Intense greenish phosphorescence emission under ambient conditions in a two-dimensional lead(II) coordination polymer with a 1,1′-ethynebenzene-3,3′,5,5′-tetracarboxylate ligand†
Xiao
Liu
a,
Lu
Zhai
 *a,
Wen-Wei
Zhang
b,
Jin-Lin
Zuo
 b,
Zhu-Xi
Yang
a and
Xiao-Ming
Ren
*abc
aState Key Laboratory of Materials-Oriented Chemical Engineering and College of Chemistry & Molecular Engineering, Nanjing Tech University, Nanjing 210009, P. R. China. E-mail: zhailu@njtech.edu.cn; xmren@njtech.edu.cn
bState Key Lab & Coordination Chemistry Institute, Nanjing University, Nanjing 210093, P. R. China
cCollege of Materials Science and Engineering, Nanjing Tech University, Nanjing 210009, P. R. China
First published on 29th May 2017
Abstract
In this study, a new two-dimensional Pb2+-based coordination polymer (CP), [Pb2(EBTC)(DMSO)3] (1), where H4EBTC is 1,1′-ethynebenzene 3,3′,5,5′-tetracarboxylic acid, was synthesized under solvothermal conditions. Structural analysis reveals that 1 crystallizes in the monoclinic space group C2/m, where two crystallographically different Pb2+ ions show a coordination geometry of bicapped trigonal prisms that are connected to a double-chain by the EBTC4− ligands through carboxylate groups along the b-axis direction, and where successive double chains are held together to form a 2D layer via the Pb1 and Pb2 bicapped trigonal prisms sharing one edge or a triangle face along the c-axis direction. Interestingly, CP 1 emitted intense and long-lived greenish phosphorescence in the solid state at ambient conditions, with a quantum yield of 1.5% and a phosphorescence lifetime of 4.17 ms, and the emission mainly arose from the electron transition within the π-type orbitals of the EBTC4− ligand. The emission bands assignment and photophysical process were further discussed according to the calculation of both the electronic band structures and density of states. This study gives a fresh impetus to achieve coordination polymer-based long-lived phosphorescence materials under ambient conditions.
Introduction
With respect to inorganic phosphorescent materials, phosphorescent organics show several advantages, such as the emission colour, intensity and lifetime all being readily tunable via rational design of the molecular structure. These fascinating features have attracted significant research interest and offer extensive advanced applications in flat-panel displays and solid-state lighting sources,1 photovoltaics,2 reverse saturable absorption,3 organic lasers,4 sensors,5 high-resolution bioimaging,6 photocatalysis,7 and photodynamic therapy (PDT).8The conjugated organic molecules, e.g. dyes, commonly show strong ultraviolet or visible light absorption in both the solid state and in solution, as well as intense luminescence in solution. However, most of these molecules do not emit fluorescence/phosphorescence in the solid state owing to the existence of strong π⋯π stacking interactions, which results in the excited-state deactivation through a nonradiative process. In addition, very often the triplet excited state of the heavy-atom-free organic chromophores cannot be efficiently populated upon photoexcitation since the electron transition of S0 → T1 is a quantum mechanically forbidden transition.9 To solve these issues, several efficient strategies have been developed besides the rational design of the molecular structure of luminescent organics. One typical method is doping or encapsulating the organic luminescent molecules into all kinds of rigid matrixes. Using this strategy, strong two-photon-induced phosphorescence emission with lifetimes of up to 50 ms in the open air at room temperature has been achieved; this has been carried out by the incorporation of luminescent cationic cyclometalated gold(III) complexes into the anionic frameworks of MOFs to form a host–guest system of AuIII@MOFs,10 and by selecting Zeolitic Imidazolate Framework ZIF-8 as a host material to trap and stabilize emitter molecules of coronene. The result was long-lived phosphorescence emission (lifetime of up to 22.4 s) that was observed even at temperatures as high as 460 K in the encapsulation of coronene@ZIF-8 owing to the nonradiative decay processes being efficiently suppressed.11 A composite formed by doping the emitter 2,5,8,11,14,17-hexa(2-ethylhexyl)hexa-peri-hexabenzocoronene into β-estradiol showed blue-green thermally activated delayed fluorescence and red phosphorescence with a lifetime of 3.9 s at room temperature in open air.12 Also, using a matrix doping strategy by incorporating N-phenylnaphthalen-2-amine (PNA) or its derivatives into the crystalline 4,4′-dibromobiphenyl (DBBP) matrix, the resulting materials showed strong and persistent room-temperature phosphorescence (RTP) with a quantum efficiency of approximately 20% and a lifetime of a few to more than 100 milliseconds.13
To improve the luminescence performance of organic emitters, another useful approach is forming a MOF/coordination polymer (CP) by utilizing a combination of organic luminescent molecules with metal ions.14 It was found that the emission intensity of the coordination polymer of the bithiophenedicarboxylate ligand (abbr. H2btdc) with Zn2+ ions is almost 20 times higher than that of the free H2btdc ligand.15 Also, two types of Zn-terephthalate (TPA) MOFs ([Zn(TPA)(DMF)] and MOF-5) exhibited observable room-temperature afterglow emission with a time resolved luminescence lifetime as high as 0.47 seconds. The lifetime value was enhanced by nearly three orders of magnitude upon the formation of MOF structures, relative to that of the pure btdc2− ligands.16
In a previous study, we achieved a highly thermally stable coordination polymer [Mg(H2EBTC)(DMF)2] (H4EBTC = 1,1′-ethynebenzene-3,3′,5,5′-tetracarboxylatic acid). Interestingly, this CP simultaneously emitted fluorescence and phosphorescence in the open air at ambient temperature in the heavy-atom-free case. The emissions arose from the H2EBTC2− ligand, and the phosphorescence intensity was relative weaker regarding than that of fluorescence.17 This observation indicated that H4EBTC is a potential organic phosphor, and consequently, suggested that by using such a carboxylate ligand, enhanced room-temperature phosphorescent emission MOFs/CPs could be achievable via rational selection of the heavy-metal ions as the nodes of MOFs/CPs. It is well known that MOFs/CPs containing heavy-metal Pb2+ ions display unusual structural diversity.18,19 These findings encouraged us to explore new RTP MOFs/CPs of Pb2+ ions with the H4EBTC ligands. Herein, we present such a CP compound [Pb2(C16H6O8)(C2H6SO)3]n (1), which emits intense greenish phosphorescence in the solid state under ambient conditions.
Experimental
Reagents and materials
All the reagents and materials were of analytical grade and used as received from commercial sources without further purification. H4EBTC was synthesized according to the method published before.20Physical measurements
Elemental analyses (C, H and N) were carried out on a PerkinElmer 240 analyzer. Thermal gravimetric analyses (TGA) were performed using a DTA-TGA 2960 thermogravimetric analyzer in nitrogen atmosphere in the range of 30–800 °C, with a heating rate of 10 °C min−1. Powder X-ray diffraction (PXRD) data were recorded on a Bruker D8 Discover diffractometer with Cu Kα (λ = 1.54056 Å) radiation with a scan speed of 5° min−1 and 0.02 per step in 2θ angles. The simulated powder diffraction pattern was obtained using the “Mercury 1.4.1” software program. The IR spectra were obtained on a NICOLET iS10 spectrometer in the 4000–400 cm−1 region. UV/visible absorbance was collected in the solid state at room temperature on a PerkinElmer Lambda 950 UV/vis spectrometer equipped with Labsphere integrating over the spectral range 200–900 nm using BaSO4 as a reflectance standard. Steady-state emission and excitation spectra were recorded for the solid samples on an F-7000 FL spectro-photometer equipped with a 150 W xenon lamp as an excitation source at room temperature. The photomultiplier tube (PMT) voltage was 700 V in all the measurements. The scan speed was 1200 nm min−1. The variable temperature luminescence study was performed on a Fluorolog-3-TAU fluorescence spectrophotometer. The phosphorescence lifetime was measured by a single-photon counting spectrometer using an Edinburgh FLS920 spectrometer equipped with a continuous Xe900 xenon lamp.Preparation and characterization of 1
Crystallographic data
A suitable single crystal of 1 was carefully selected under an optical microscope and glued to a thin glass fibre. Single-crystal X-ray diffraction data were collected on a Bruker Smart Apex II CCD diffractometer at 296 K using graphite monochromated Mo/Kα radiation (λ = 0.71073 Å). Data reductions and absorption corrections were performed with the SAINT21 and SADABS2![[thin space (1/6-em)]](https://www.rsc.org/images/entities/char_2009.gif) 22 software packages, respectively. Structures were solved by the direct method using the SHELXL-97 software package.23 The non-hydrogen atoms were anisotropically refined using the full-matrix least-squares method on F2. All the hydrogen atoms were placed at the calculated positions and refined riding on the parent atoms.
22 software packages, respectively. Structures were solved by the direct method using the SHELXL-97 software package.23 The non-hydrogen atoms were anisotropically refined using the full-matrix least-squares method on F2. All the hydrogen atoms were placed at the calculated positions and refined riding on the parent atoms.
CCDC 1505488† contains the supplementary crystallographic data of 1 in this paper. The crystallographic data and details of the structural refinement for 1 are summarized in Table 1 and the selected bond distances and angles are listed in Table S1.†
| Formula | C24H24O11Pb2S3 |
|---|---|
| a R 1 = ∑||Fo| − |Fc|/∑|Fo|. b wR2 = {∑[w(Fo2 − Fc2)2]/∑[w(Fo2)2]}1/2. | |
| Formula weight | 998.99 |
| CCDC no. | 1505488 |
| Temperature (K) | 291(2) |
| Wavelength (Å) | 0.71073 |
| Crystal size/mm | 0.27 × 0.21 × 0.18 |
| Crystal system | Monoclinic |
| Space group | C2/m |
| a/Å | 32.541(3) |
| b/Å | 10.2204(8) |
| c/Å | 8.0517(7) |
| α/(°) | 90 |
| β/(°) | 92.954(2) |
| γ/(°) | 90 |
| V/Å3 | 2674.3(4) |
| Z | 4 |
| F(000) | 1872 |
| θ min,max/° | 2.884–27.565 |
| GOF | 1.096 |
R
1,a wR2![[thin space (1/6-em)]](https://www.rsc.org/images/entities/char_2009.gif) b [I > 2σ(I)] b [I > 2σ(I)] |
0.0611, 0.2060 |
Details of crystal structure optimization and band structure calculation
The geometry optimization of the crystal structure and the calculation of the electron band structure were performed for 1 in the DFT framework. In the process of geometric optimization, the unit cell parameters of 1 were constrained to the values obtained from the X-ray single-crystal diffraction at 291 K, and the positions of all atoms were fully optimized. The initial positions of all the atoms were directly taken from the single-crystal structure data of 1 at 291 K for geometry optimization. The DMSO molecules showed a highly disordered structure with two possible positions in the single-crystal structure at 291 K; however, one of two parts was removed for each DMSO molecule in the geometry optimization process. The optimized bond lengths and the bond angles are listed in Table S2,† and are comparable to the results obtained from the single-crystal analysis at 291 K. The electron band structure and the density of states were calculated for 1 based on the optimized crystal structure. The Cambridge sequential total energy package (CASTEP) module24 was employed in these calculations. The total plane-wave pseudopotential method forms the basis of the CASTEP calculations. The exchange–correlation effects were treated within the generalized gradient approximation (GGA) with the Perdew–Burke–Ernzerhof (PBE) functional.25 The long-range van der Waals (vdW) interactions corrections were utilized with Grimme's semi-empirical approach (DFT-D).26 The plane-wave basis set energy cut-off was set at 300 eV for 1. The convergence parameters were set as follows: SCF tolerance, 1 × 10⁻⁶ eV per atom; total energy tolerance, 2 × 10⁻⁵ eV per atom; maximum force tolerance, 0.05 eV Å−1; maximum stress component, 0.1 GPa; and displacement of convergence tolerance, 0.002 Å. All the other calculation parameters were set at the default values in the CASTEP code.Results and discussion
Crystal structure of [Pb2(EBTC)(DMSO)3] (1)
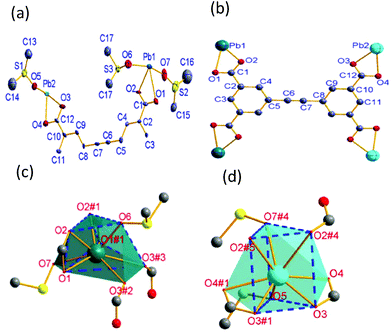
CP 1 crystallizes in monoclinic space group C2/m, as shown in Fig. 1a, where it can be seen that its asymmetric unit consists of two crystallographically independent Pb2+ ions (labelled as Pb1 and Pb2, respectively), one half of deprotonated EBTC4− ligands and three crystallographically different coordinated DMSO molecules. The EBTC4− ligand possesses a mirror symmetry, which passes through the C3, C5, C7, C8 and C11 atoms, and connects with two Pb1 and two Pb2 ions via four carboxylate groups in the η2-COO− manner. As a result, the EBTC4– ligand shows a μ4–η2:η2-EBTC4– tetra-lead(II) binding mode (ref. Fig. 1b). Both Pb1 and Pb2 ions locate on a mirror plane, respectively, as displayed in Fig. 1c and d, with both Pb1 and Pb2 ions coordinated by eight oxygen atoms to form the bicapped trigonal prismatic coordination geometry. The distorted bicapped trigonal prism with Pb1 ion is built from six oxygen (O1, O1#1, O2, O2#1, O3#3 and O6) atoms, and its two different side faces are capped by another two oxygen (O3#2 and O7) atoms (the symmetry codes: #1 = x, 2 − y, z; #2 = 1 − x, y, 1 − z; #3 = 1 − x, 2 − y, 1 − z). The coordination bicapped trigonal prism has the Cs symmetry, and the plane of symmetry passes through Pb1, O6 and O7 atoms. The bicapped trigonal prism with Pb2 ion is constructed by O2#4, O2#5, O3, O3#1, O5 and O7#4 atoms, and its two side faces are capped by O4 and O4#1 atoms (the symmetry codes: #4 = 1 − x, y, −z; #5 = 1 − x, 2 − y, −z). This bicapped trigonal prism also has the Cs symmetry, and the plane of symmetry passes through Pb2, O5 and O7#4 atoms. The bond lengths of Pb–O in the two different bicapped trigonal prisms are summarized in Table 2, and these values are comparable to those in other Pb-MOFs.27–29 It is worth noting that two of the three DMSO molecules (with S1 and S2 atoms) exhibit a two-fold disorder and the two disordered parts are related to each other by a mirror plane.| Pb1–O1 | 2.801(16) | Pb1–O2 | 2.432(18) | Pb1–O3 | 2.9710(88) |
| Pb1–O7 | 2.801(16) | Pb1–O6 | 2.471(14) | Pb2–O4 | 2.727(8) |
| Pb2–O3 | 2.456(8) | Pb2–O2 | 2.727(8) | Pb2–O5 | 2.462(14) |
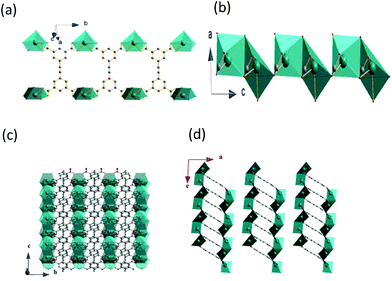
As shown in Fig. 2a, the Pb1 and Pb2 bicapped trigonal prisms are connected into double chains by the EBTC4− ligands through carboxylate groups along the b-axis direction. The successive double chains are connected together to form a 2D layer via the Pb1 and Pb2 bicapped trigonal prisms sharing one edge or one triangle face along the c-axis direction (ref. Fig. 2b and c), and the 2D layers stack along the a-axis direction and the neighbouring layers are held together via van der Waals faces (ref. Fig. 2d). PLATON calculations indicated that the unit cell contains no residual solvent accessible void, indicating that 1 has a high density of framework.30
PXRD patterns and thermal stability
The experimental and simulated powder X-ray diffraction (PXRD) patterns of 1 are shown in Fig. 3a, which are in good agreement with each other, indicating that the crystalline sample of 1 possesses a high phase purity. The TG curve of 1 is depicted in Fig. 3b. It was found that the coordinated DMSO molecules start to release at ca. 117 °C and the percentage of mass loss is estimated as ca. 15.8% between 117 °C and 250 °C, corresponding to releasing two DMSO molecules per formula unit of [Pb2(EBTC)(DMSO)3] (calculated to be 15.6%). The residual DMSO molecules were completely removed up to ca. 426 °C. The whole mass losing percentage was 23.4% in the temperature range of 30–426 °C, which is in good agreement with the value of 23.5% calculated according to the formula of [Pb2(EBTC)(DMSO)3]. The 2D coordination layers of 1 started to decompose at a temperature higher than 426 °C.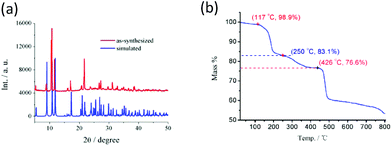 | ||
| Fig. 3 (a) PXRD patterns simulated from the X-ray single-crystal structure and the as-synthesized sample of 1 at ambient temperature. (b) TG plot of 1. | ||
Steady-state UV-vis absorption spectra and Photoluminescent properties
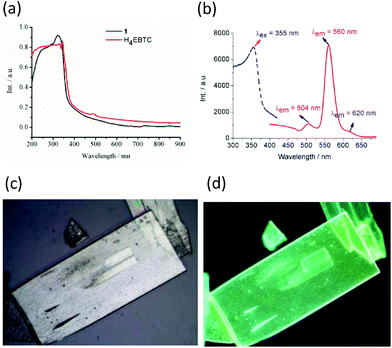
The solid-state diffuse reflectance UV-vis spectrum of 1 at ambient temperature is displayed in Fig. 4a. The absorption bands of 1 fall within the ultraviolet spectroscopy region; moreover, the spectrum of 1 is similar to that of the ligand H4EBTC. The optical band gap was estimated as 2.1 eV from the UV-visible spectrum of 1.The solid-state luminescent spectra of H4EBTC and 1 were investigated in the open air at room temperature. As depicted in Fig. 4b, the excitation spectrum of 1 was obtained between 300 and 420 nm by monitoring the emission band centred at 560 nm, which shows a peak with the maximum at 355 nm. As depicted in Fig. S3 (ESI†), the H4EBTC exhibits a weak broad emission band with a maximum centred at 388 nm upon excitation at 278 nm; this emission is attributed to intraligand π → π* transition. The emission spectrum of 1 exhibits two clear peaks with the maxima located at 504 and 560 nm, respectively, together with a shoulder at ca. 620 nm under ultraviolet light (λex = 355 nm) excitation. The Stokes shifts were 149, 202 and 256 nm for the emission bands centred at 504, 560 and 620 nm, respectively. Compared with the emission spectrum of H4EBTC ligand, the broad emission band at 504 nm in 1 shows a pronounced red-shift due to the coordination of metal ions to ligands, suggesting a great contribution from the Pb–O motifs to the emission and a large degree change of interligand coupling upon metal coordination. CP 1 had a quantum yield of 1.5% under ambient conditions. Since the emission band centred at 560 nm is much more intense than the other two emission bands, the colourless crystals of 1 under daylight show bright greenish colour under ultraviolet light (λex = 330–380 nm), which are displayed in Fig. 4c and d. The temperature-dependent emission spectra in the solid state were investigated for 1 in the temperature range from 10 to 300 K. As shown in Fig. 5, upon cooling, the intensities of the three emission bands increase rapidly and this is due to that the excited-state deactivation pathways through the excitation states coupled to vibrations being efficiently suppressed. It is worth noting that a new emitting peak comes into view, with a maximum located at ca. 538 nm when the temperature reaches 10 K.
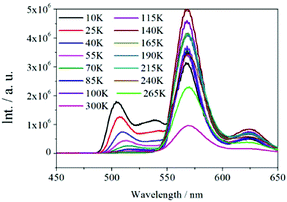 | ||
| Fig. 5 Temperature-dependent (10–300 K) solid-state emission spectra of 1 excited under UV light with λex = 355 nm. | ||
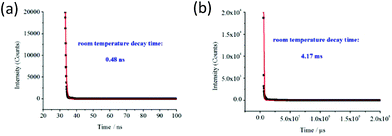
Luminescence decay time measurements were performed for the emission bands with the maximum of peak at ca. 504 and ca. 560 nm, and the corresponding luminescence decay curves are shown in Fig. 6a and b, respectively. The best fits gave the emission decay lifetime τ0 = 0.48 ns for the emission band at ca. 504 nm versus 4.17 ms for the emission band at 560 nm using the exponential decay function in the form of eqn (1), where the symbols y0 and A1 are two constants, and τ is the decay constant, representing the photoluminescence lifetime.
| y = y0 + A1 × exp(−t/τ) | (1) |
Generally, fluorescent moieties emit photons several nanoseconds after absorption following an exponential decay curve. Typically, the conjugated organic molecules, e.g. dyes, commonly have a lifetime between 1 and 10 ns;9,31 however, there exist a small amount of longer lived exceptions; for example, the pyrene with a lifetime of 400 ns in degassed solvents or 100 ns in lipids and the coronene with a lifetime of 200 ns. In the cases of the electron transition occurring between states with different spin multiplicity, the fluorophores have much longer lifetimes due to the restricted states. For instance, the f–f electronic transitions of lanthanide ion have lifetimes of 0.5 to 3 ms in the lanthanide complexes, while the MLCT transitions have lifetimes of 10 ns to 10 μs in some transition metal complexes and the transitions between T1 and S0 states in the organic phosphors show a range of lifetimes from microseconds to milliseconds.32 The luminescence lifetime of the emission band at 504 nm falls within the fluorescence lifetime range of typically conjugated organic compounds, whereas the luminescence decay of the emission band at 560 nm displays the characteristic properties of phosphorescence lifetime. As a result, the emission bands with the maxima at 504 nm and 560 nm are assigned to the S1 → S0 and T1 → S0 transitions with the ligand EBTC4− character, respectively.
Electron band structure and emission band assignment
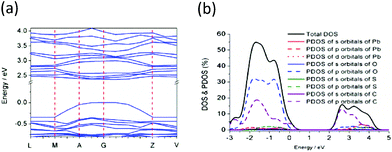
The electron band structures were further analyzed for 1, and the calculated bands along several high symmetry directions of the Brillion zone are displayed in Fig. 7a. The valence bands (VBs) and the conducting bands (CBs) near the Fermi level show a small dispersion along the directions from V to Z and L to M in the k-space, which is indicative of the existence of weak orbital interactions along these directions and this is because of the bandwidths depending upon the degree of overlap in the atomic orbitals from which they arise. While both the VBs and CBs are relatively sharp along the directions from M to A in the k-space, with this direction in the k-space being approximately parallel to the coordination polymer layer, indicating that there are stronger orbital interactions within a coordination polymer layer. These results are in good agreement with the crystal structure analysis that the neighbouring coordination polymer layers are connected through weak van der Waals forces, while there also exist covalent or coordination bonds between the neighbouring atoms in the coordination polymer layer. The calculated energy gap between the highest occupied and the lowest unoccupied bands was 2.367 eV, which is larger than the value of optical bandgap obtained from the UV-visible absorption spectrum by ca. 0.27 eV, with this difference due to the limitations of DFT methods.33–35 As shown in Fig. 7b, the total DOS of 1 and the PDOS of Pb, O, S and C atoms analyses demonstrate that the valence band is mainly comprised of the atom orbitals of C (2p) and O (2p) atoms together with a small amount of Pb (6s), while the conducting band mostly consists of 2p orbitals of C atoms. This further demonstrates that the emissions in 1 with em = 504 and 560 nm arise primarily from the π* → π transitions within the EBTC4− ligand, corresponding to the S1 → S0 and the T1 → S0 transitions, respectively. The lower energy emission band with λem = 620 nm is probably contributed from the π* → n transition, namely, the electron transition occurs between the 2p orbitals of O atoms in the carboxylic groups and the π* orbitals in the phenyl rings.Conclusions
In summary, we successfully achieved a coordination polymer of Pb2+ with the EBTC4− ligand using the solvothermal reaction. This Pb-based coordination polymer emitted intense and long-lived greenish phosphorescence under ambient conditions, which arises mainly from the electron transition within the π-type orbitals of EBTC4− ligand. The small amount of 6s orbitals of Pb2+ ions contributing to the crystal orbitals in the valance bands promoted spin–orbit coupling interaction and improved the electron–hole separation time during the charge-transfer process, which is the main reason for the Pb2+ ion heavy atom effect in enhancing the phosphorescence efficiency of the H4EBTC ligand. This study gives a fresh impetus to achieve coordination polymer-based long-lived phosphorescence materials under ambient conditions.Acknowledgements
Authors thank the Priority Academic Program Development of Jiangsu Higher Education Institutions, Special Research Found for the Doctoral Program of Higher Education and the National Nature Science Foundation of China (grant no. 20123221110013, 51173075, 21671100 and 21271103) for financial support.Notes and references
- Q. Wang, Z. Wu, Y. Zhao, J. Chen and D. Ma, Org. Electron., 2016, 32, 21 CrossRef CAS.
- D. N. Congreve, J. Lee, N. J. Thompson, E. Hontz, S. R. Yost, P. D. Reusswig, M. E. Bahlke, S. Reineke, T. V. Voorhis and M. A. Baldo, Science, 2013, 340, 334 CrossRef CAS PubMed.
- S. Hirata, K. Totani, T. Yamashita, C. Adachi and M. Vacha, Nat. Mater., 2014, 14, 938 CrossRef PubMed.
- D. Liu, R. C. Huxford and W. Lin, Angew. Chem., Int. Ed., 2011, 50, 3696 CrossRef CAS PubMed.
- (a) Y. J. Cui, R. J. Song, J. C. Yu, M. Liu, Z. Q. Wang, C. D. Wu, Y. Yang, Z. Y. Wang, B. L. Chen and G. D. Qian, Adv. Mater., 2015, 27, 1420 CrossRef CAS PubMed; (b) A. Kobayashi, H. Hara, S.-i. Noro and M. Kato, Dalton Trans., 2010, 39, 3400 RSC; (c) Q. Meng, X. Zhang, C. He, G. He, P. Zhou and C. Duan, Adv. Funct. Mater., 2010, 20, 1903 CrossRef CAS; (d) P. Wu, J. Wang, C. He, X. Zhang, Y. Wang, T. Liu and C. Duan, Adv. Funct. Mater., 2012, 22, 1698 CrossRef CAS.
- Y. C. Liang, A. S. Dvomikov and P. M. Rentzepis, Proc. Natl. Acad. Sci. U. S. A., 2003, 100, 8109 CrossRef CAS PubMed.
- (a) S. Takizawa, R. Aboshi and S. Murata, Photochem. Photobiol. Sci., 2011, 10, 895 RSC; (b) X. Jing, C. He, Y. Yang and C. Y. Duan, J. Am. Chem. Soc., 2015, 137, 3967 CrossRef CAS PubMed.
- (a) A. F. Uchoa, K. T. Oliveira, M. S. Baptista, A. J. Bortoluzzi, Y. Iamamoto and O. A. Serraz, J. Org. Chem., 2011, 76, 8824 CrossRef CAS PubMed; (b) S. Duman, Y. Cakmak, S. Kolemen, E. U. Akkaya and Y. Dede, J. Org. Chem., 2012, 77, 4516 CrossRef CAS PubMed.
- P. Yang, J. Zhao, W. Wu, X. Yu and Y. Liu, J. Org. Chem., 2012, 77, 6166 CrossRef CAS PubMed.
- C. Y. Sun, W. P. To, X. L. Wang, K. T. Chan, Z. M. Su and C. M. Che, Chem. Sci., 2015, 6, 7105 RSC.
- H. Mieno, R. Kabe, N. Notsuka, M. D. Allendorf and C. Adachi, Adv. Opt. Mater., 2016, 4, 1015 CrossRef CAS.
- S. Hirata and M. Vacha, Adv. Opt. Mater., 2017, 5, 1600996 CrossRef.
- J. Wei, B. Liang, R. Duan, Z. Cheng, C. Li, T. Zhou, Y. Yi and Y. Wang, Angew. Chem., Int. Ed., 2016, 55, 15589 CrossRef CAS PubMed.
- X. Yang and D. Yan, Adv. Opt. Mater., 2016, 4, 897 CrossRef CAS.
- J. Zhao, X. L. Wang, X. Shi, Q. H. Yang and C. Li, Inorg. Chem., 2011, 50, 3198 CrossRef CAS PubMed.
- X. Yang and D. Yan, Chem. Sci., 2016, 7, 4519 RSC.
- L. Zhai, W. W. Zhang, J. L. Zuo and X. M. Ren, Dalton Trans., 2016, 45, 11935 RSC.
- Y. T. Chen, C. Y. Lin, G. H. Lee and M. L. Ho, CrystEngComm, 2015, 17, 2129 RSC.
- F. J. Martínez-Casado, M. Ramos-Riesco, J. A. Rodríguez-Cheda, F. Cucinotta, E. Matesanz, I. Miletto, E. Gianotti, L. Marchese and Z. Matěj, Inorg. Chem., 2016, 55, 8576 CrossRef PubMed.
- Y. X. Hu, S. C. Xiang, W. W. Zhang, Z. X. Zhang, L. Wang, J. F. Bai and B. L. Chen, Chem. Commun., 2009, 48, 7551 RSC.
- Bruker, APEX 2, SAINT, XPREP, Bruker AXS Inc., Madison, Wisconsin, USA, 2007 Search PubMed.
- Bruker, SADABS, Bruker AXS Inc., Madison, Wisconsin, USA, 2001 Search PubMed.
- G. M. Sheldrick, SHELXS97 and SHELXL97: Program for the refinement of crystal structure, University of Göttingen, Germany, 1997 Search PubMed.
- M. D. Segall, P. J. D. Lindan, M. J. Probert, C. J. Pickard, P. J. Hasnip, S. J. Clark and M. C. Payne, J. Phys.: Condens. Matter, 2002, 14, 2717 CrossRef CAS.
- J. P. Perdew, K. Burke and M. Ernzerhof, Phys. Rev. Lett., 1996, 77, 3865 CrossRef CAS PubMed.
- S. J. Grimme, Comput. Chem., 2006, 27, 1787 CrossRef CAS PubMed.
- L. Yang, Y. Li, A. You, J. Jiang, X. Z. Zou, J. W. Chen, J. Z. Gu and A. M. Kirillov, J. Mol. Struct., 2016, 1120, 327 CrossRef CAS.
- B. Mirtamizdoust, D. C. Bieńko, Y. Hanifehpour, E. R. T. Tiekink, V. T. Yilmaz, P. Talemi and S. W. Joo, J. Inorg. Organomet. Polym., 2016, 26, 819 CrossRef CAS.
- A. Santra and P. K. Bharadwaj, Cryst. Growth Des., 2014, 14, 1476 CAS.
- A. L. Spek, J. Appl. Crystallogr., 2003, 36, 7 CrossRef CAS.
- S. Guo, W. Wu, H. Guo and J. Zhao, J. Org. Chem., 2012, 77, 3933 CrossRef CAS PubMed.
- Z. Yang, Z. Mao, Z. Xie, Y. Zhang, S. Liu, J. Zhao, J. Xu, Z. Chi and M. P. Aldred, Chem. Soc. Rev., 2017, 46, 915 RSC.
- R. W. Godby, M. Schluther and L. Sham, Phys. Rev. B: Condens. Matter, 1987, 36, 6497 CrossRef CAS.
- C. M. I. Okoye, J. Phys.: Condens. Matter, 2003, 15, 5945 CrossRef CAS.
- R. Terki, G. Bertrand and H. Aourag, Microelectron. Eng., 2005, 81, 514 CrossRef CAS.
Footnote |
| † Electronic supplementary information (ESI) available. CCDC 1505488. For ESI and crystallographic data in CIF or other electronic format see DOI: 10.1039/c7dt01626c |
| This journal is © The Royal Society of Chemistry 2017 |

