On the validity of linear response approximations regarding the solvation dynamics of polyatomic solutes
Received
16th December 2016
, Accepted 28th March 2017
First published on 4th April 2017
Abstract
The time-dependent fluorescence of a chromophore can be calculated from either nonequilibrium simulations, or, as long as linear response theory holds true, from equilibrium solvent fluctuations in the ground or excited state if the perturbation inflicted by the chromophore is small. The assumption of Gaussian statistics, in contrast, links the nonequilibrium dynamics to solvent fluctuations solely in the excited state, as long as the energy gap distribution is Gaussian throughout the process. The validity of linear response theories on the ground and excited state surface as well as Gaussian statistics is thoroughly tested in this study by calculating the time-dependent Stokes shift of different benzene-like solutes. The effect of the size of change in partial charges of the solute, the multipolar order of charge distribution, the direction of change, as well as the influence of different solvents on the validity of linear response theory is examined by simulating 54 different systems. Calculation of the Gaussian character of the energy distribution in equilibrium, as well as the time-evolution of the peak width in the nonequilibrium simulation sheds light on the validity of Gaussian statistics in a nonstationary regime. We observed that a large intermediate broadening of the width of the energy distribution correlates with a failure of correlation functions to describe the nonequilibrium event. These results are accompanied by analysis of higher order correlation functions, as well as the structure of the solvents water, acetonitrile and methanol around the solute, to yield a comprehensive view, as well as general guidelines, on when and why equilibrium solvent fluctuations can correctly depict solvation dynamics.
1 Introduction
Solvation dynamics describe the dynamical response of a solvent to any changes of an immersed solute, as for example may occur during a chemical reaction. The timescale of the solvent rearrangement after such a change directly affects the reaction rates of fast chemical reactions in solution such as electron or proton transfer and has therefore been used extensively to examine the processes related to charge-transfer reactions.1–5 Solvation dynamics can be probed using time-dependent fluorescence measurements or simulations. The perturbation is realized via a chromophore that can be electronically excited by a laser pulse. The changed electron distribution of the excited state solute causes the system to be initially in a nonequilibrium state, which relaxes to a new state of equilibrium by rearrangement of solvent molecules. The change in fluorescence frequency of the chromophore, the so-called time-dependent Stokes shift, is directly linked to the solvent structure as the rearrangement of the solvent molecules lowers the excited state energy. Normalizing this shift yields the Stokes shift relaxation function S(t)| | 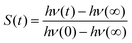 | (1) |
The time axis is chosen such that the excitation occurs at t = 0 and the rearrangement completes as t → ∞.
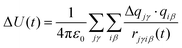
S(t) is directly accessible via experiments or nonequilibrium molecular dynamics simulation. Experiments, however, cannot account fully for the molecular details of the solvent rearrangement, so that computer simulation of the time-dependent Stokes shift is an important part of understanding the underlying mechanisms and principles.6 The simulation of solvation dynamics using nonequilibrium trajectories is straightforward: the solute is immersed in a box of solvent molecules and equilibrated. After a sudden excitation created by changing the charge distribution within the solute, the solvent motion is monitored and converted into the time-dependent interaction energy between solute and solvent
| |  | (2) |
where Δ
qjγ is the change in partial charge of atom
γ in the solute molecule
j,
qiβ the partial charge of atom
β of solvent molecule
i and
rjγiβ the respective distance between the two atoms. This interaction energy is then converted to the solvent relaxation function
| | 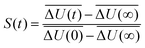 | (3) |
where

is the averaged electrostatic energy difference between ground and excited state.
As the computer simulation requires averaging over a large number of independent simulations and is therefore time-consuming, only few studies focus solely on nonequilibrium simulation.7–10 More often, nonequilibrium computational solvation dynamics is accompanied11–16 or even replaced4,17–25 by equilibrium molecular dynamics simulation. Here, the nature of  is assumed to depend linearly on the perturbation, so that the nonequilibrium event can be described by the energy fluctuations present in the equilibrium state of the system. S(t) is then assumed to be represented by the correlation function Cg(t) or Ce(t) of the energy gap in the equilibrated ground (g) or equilibrated excited (e) state. The underlying approximations and concepts of the different linear response assumptions are described in detail in Section 2.
The validity of linear response approximations has been tested for many systems. It is often claimed that linear response holds as long as the change in solute properties requires only a change in charge,26,27 but not for changes in solute size.6,28,29 However, there is evidence for a failure of linear response in quite a few systems involving only a change in solute charge distribution.11–13,19,30–33 Fonseca and Ladanyi31 observed a failure of both Cg(t) and Ce(t) in methanol for different diatomic solutes. Hynes and coworkers30 examined the Stokes shift after the excitation of a neutral pair to an ion pair in a solvent roughly resembling methylchloride and found that only Ce(t) resembled S(t) quite well and attributed this to the observed Gaussian statistics. They also found a nonlinear spectral broadening and narrowing and suggested that this effect should be explored for different solvents and solutes. This study will therefore take up the interesting topic of the time evolution of the widths of the respective energy distributions in different systems.
As solute we chose a well known artificial model, namely a polyatomic benzene-like structure where different charge distributions showing different multipolar moments can be realized,19,20 and adapted it to fit our purpose. As the relevant excitation mechanisms of real chromophores are mostly based on excitations of a large π-system, the benzene model reflects some of those chromophore features (in contrast to simpler mono- or diatomic models). Kumar and Maroncelli19 compared Cg(t) and S(t) for such a benzene-like solute showing an octupole moment in its excited state in acetonitrile and methanol. They found perfect agreement for solvation dynamics in acetonitrile, but the approximation failed for methanol. As the charge distributions differed greatly in the ground and excited state (±0.75e as well as ±1e per carbon atom), the failure was attributed to a too large perturbation, as well as to the different hydrogen bonding behavior in ground and excited state resulting from these large charge differences. A consecutive work by Ladanyi and Maroncelli20 investigated different Cg(t) of the same system using different multipole moments in the excited state. Both studies found that the solvation response depends on the multipolar moment of the solute, but did not investigate the failure of linear response theory observed in the first study any further. The current work is therefore aimed at examining the failure of linear response approximations for different charge redistributions in the solute, so that general conclusion when and why linear response is applicable can be drawn.
To this aim, non-equilibrium and equilibrium simulations of the three benzene-like solutes in the work of Maroncelli and coworkers19 will be employed, with three different absolute changes in charge. The excitation (uncharged to charged state), as well as the deexcitation (charged to uncharged state) of these solutes will be calculated, reflecting the different nature of change in charge distribution occuring in natural chromophores. For example, Coumarin 153 increases its dipole moment upon excitation,34 whereas the chromophore 1-methyl-6-oxyquinolinium betaine decreases its dipole moment upon excitation.9,35 As solvents we investigated water, acetonitrile and methanol. The Stokes shift in methanol shows only a small inertial component, in contrast to water and acetonitrile. The inertial dynamics is connected to the validity of linear response approximations,31 so that comparison of solvation dynamics in methanol to other solvents will be especially instructive. Acetonitrile shows a unspecific interaction to solutes and cannot take part in hydrogen bonds, which both water and methanol do. Furthermore, water has shown to be unspecific to the nature of the solute when calculating the Stokes shift relaxation function, as for example described by Ernsting and coworkers,36 whereas in methanol S(t) of different solutes differs significantly. This study therefore sheds light on a broader variety of systems than has been done before, using the excitation and deexcitation of nine different solutes in three solvents, thus calculating both non-equilibrium and equilibrium simulations in 54 systems.
2 Theory
This section gives a short overview on the approximations involved in linear response theory on the ground and excited state energy surface, as well as in Gaussian statistics, as applied in solvation dynamics. For a more detailed description the reader is referred to the literature.30,37,38 Generally, the energy of the system can be written as the Hamiltonian corresponding to the ground state, Hg, as well as a perturbation that is turned on at the moment of excitation:37–39| | | H(t) = Hg + θ(t)[He − Hg] | (4) |
θ(t) corresponds to the Heaviside step function, and He to the Hamiltonian of the excited state. The fluorescence energy ΔU is thenIn this work, only the partial charge distribution is assumed to change upon excitation, so that the change in energy is purely of electrostatic nature, namely the Coulomb interaction energy between solute and solvent. However, the discussion of conventional linear response, as well as Gaussian statistics applies likewise for other properties of the system, as for example the van der Waals energy which is needed to describe nonpolar solvation dynamics involving changes in solute size. It should be noted that the fluorescence energy is actually made up of a time-dependent term resulting from solvent rearrangement and a constant term from the difference of the ground and excited state in vacuum. As the constant term does not contribute to the time-evolution of the wavelength, it is neglected in this work.
2.1 Linear-response approximation on the unperturbed energy surface
If the Hamiltonian that characterizes the solute–solvent interactions is assumed to change linearly with respect to a perturbation, then the relaxation of this energy in presence of the perturbation can be described via the regression of the spontaneous fluctuations around their equilibrium value.40,41 Using eqn (4), the time dependence of the nonequilibrium energy gap can be calculated as| | 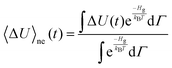 | (6) |
where kB is Boltzmann's constant, T the temperature and Γ the phase space coordinates and momenta. If only perturbations up to the linear term are taken into account, the Stokes shift relaxation function S(t) can be approximated as| | 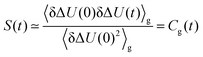 | (7) |
where δΔU is defined as| | | δΔU(t) = ΔU(t) − 〈ΔU〉g | (8) |
and 〈⋯〉 denotes a mean value. The linear-response theory on the ground state energy surface describes correctly the initial form and width of the energy distribution of the nonequilibrium event, which resemble the distribution in the ground state. However, the dynamics of the process which actually take place on the excited state surface are assumed to be equal to the ground-state dynamics corrected to first order in perturbation.37 This is only valid for small perturbations on a scale of kBT.
2.2 Linear-response approximation on the perturbed energy surface
Eqn (6) can be rewritten using the relation| |  | (9) |
as done by Hynes and coworkers30 to give| | 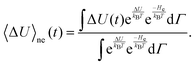 | (10) |
Using the relation δΔU(t) = ΔU(t) − 〈ΔU〉e and rearrangement gives| | 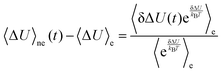 | (11) |
By linearizing the term via exp(δΔU/kBT) ≃ 1 + δΔU/kBT (which, again, is only valid for small fluctuations), it can be shown30,37–39 that| | 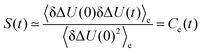 | (12) |
The linear response theory on the perturbed state energy surface hence describes the excited state dynamics via the use of the time-correlation function of the energy fluctuations in the excited state. However, it comes at the cost of using a energy distribution not representative for the starting configurations of the excitation process.
It should be kept in mind that linear response theory furthermore states not only S(t) ≃ Ce(t), but also Ce(t) = Cg(t) if conventional linear response holds, so that the frequently occurring differences between Cg(t) and Ce(t) are sometimes viewed as a breakdown of linear response theory.37
2.3 Gaussian statistics
A different approach is the assumption that the energy fluctuations obey Gaussian statistics. It can then be shown that S(t) ≃ Ce(t), similar to linear response on the excited state energy surface, but on a different mathematical background. Namely, eqn (11) can be rewritten if ΔU(t) is assumed to be a Gaussian random variable,37,38 so that the numerator equals| | 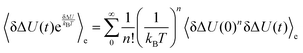 | (13) |
The higher order correlation functions which are treated as zero in conventional linear response now add up to the observed overall shift and all show the same timescale. Using Wick's theorem42 one can verify that even-numbered higher order correlation functions are zero, whereas odd ones are multiples of 〈δΔU(0)δΔU(t)〉e:| | 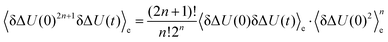 | (14) |
and the absolute Stokes shift ΔΔU = ΔU(0) − ΔU(∞) equals| | 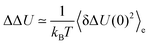 | (15) |
as derived by Laird and Thompson.37,38 If eqn (14) holds true (and even-numbered higher order correlation functions are zero), Gaussian statistics apply and the response is linear even for large perturbations, as it is not necessary to assume δΔU/kBT ≪ 1. The assumption of Gaussian statistics is therefore a less severe one than in conventional linear response theory.
3 Methods
All simulation were conducted using the program package CHARMM.43 The forcefields (partial charges, equilibrium distances and angles, as well as Lennard-Jones parameters) for the artificial benzene solutes were taken from Maroncelli and coworkers19 and made flexible via inclusion of force field parameters obtained from PARAMCHEM44,45 which is based on the CHARMM General Force Field (CGenFF).46 The solute (and the solvent) was allowed to rotate and translate freely, as well as vibrate where bonds involving hydrogen atoms were held fixed using the SHAKE algorithm. Upon excitation of the ground state (![[Doublestruck S]](https://www.rsc.org/images/entities/char_e176.gif) 0) only the partial charges change, creating different multipole moments depending on the charge distribution: dipole (μ), quadrupole (Q) and octupole (Ω). The different states are depicted in Fig. 1.
0) only the partial charges change, creating different multipole moments depending on the charge distribution: dipole (μ), quadrupole (Q) and octupole (Ω). The different states are depicted in Fig. 1.
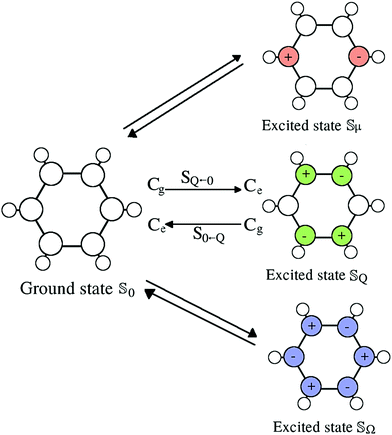 |
| | Fig. 1 Charge distributions of the ground state 0 and the dipole (μ), quadrupole (Q) and octupole (Ω) moment excited states, using changes in charge of 1, 0.5 or 0.2e at the denoted (colored) carbon atoms. In the ground state, each carbon atoms carries a charge of +0.135e, each hydrogen atom of −0.135e. | |
One solute molecule and either 2000 molecules of water (SPC/E47,48), 1000 molecules of acetonitrile (parameters from CHARMM36 General Force Field46) or methanol (parameters from OPLS-AA forcefield49) were packed into cubic boxes using PACKMOL.50 A subsequent 300 ps long NpT run at 1 bar and 300 K was conducted to obtain the correct box lengths for each system, summarized in Table 1. All trajectories were calculated using a Nosé–Hoover thermostat,51,52 and the velocity-Verlet integrator. 500 starting configurations for the non-equilibrium simulations were obtained from a long NVT run at elevated temperature. Each of those starting configurations was equilibrated for 500 ps using an NVT ensemble at 300 K. Then, the solute was excited by an instantaneous change of the partial charge distribution without further change of other parameters. The system was monitored for 50 ps (NVT, 300 K) and the coordinates saved. A time step of 1 fs was used. For the respective equilibrium simulations, the system was equilibrated for 500 ps and afterwards monitored for 5 ns, using a NVT ensemble at 300 K and a time step of 2 fs. All simulations were carried out using periodic boundary conditions with the particle mesh Ewald method to calculate electrostatic interactions (grid size 1 Å, cubic splines of order 6, a κ of 0.41 Å−1) and a energy cutoff of 11 Å for van-der-Waals interactions. The resulting trajectories were analyzed using a self-written program based on MDAnalysis.53
Table 1 Box lengths of cubic simulation boxes of benzene (BZ) in water (SPCE), acetonitrile (ACN) or methanol (MeOH), as well as number of trajectories for the nonequilibrium (NEQ) and equilibrium (EQ) simulation
| Content |
Box length |
NEQ |
EQ |
| 2000 SPCE + 1 BZ |
39.19 Å |
500 × 50 ps |
1 × 5000 ps |
| 1000 ACN + 1 BZ |
44.22 Å |
500 × 50 ps |
1 × 5000 ps |
| 1000 MeOH + 1 BZ |
41.95 Å |
500 × 50 ps |
1 × 5000 ps |
4 Results and discussion
4.1 Comparison of equilibrium and nonequilibrium relaxation functions
The correlation functions Cg(t) and Ce(t), as well as the Stokes shift relaxation function S(t) are plotted for all 54 system in Fig. 2.
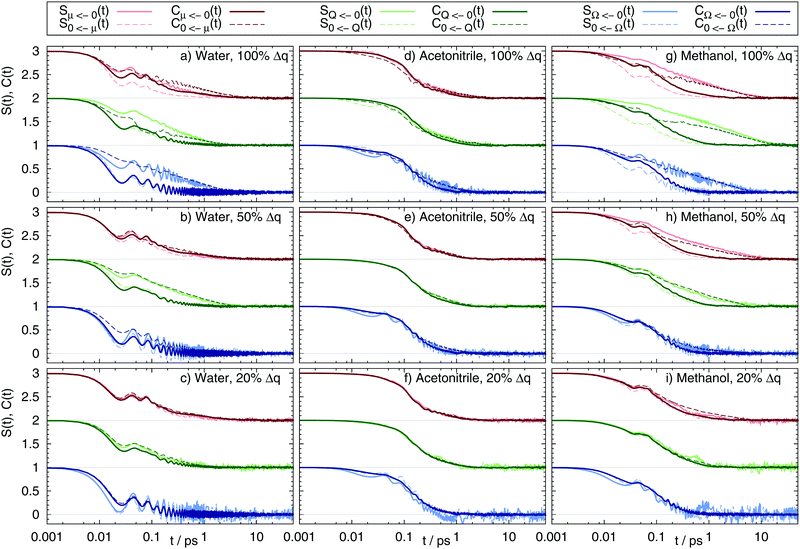 |
| | Fig. 2 Nonequilibrium and equilibrium Stokes shift relaxation function after excitation (continuous line) from the benzene ground state to the dipole (red, shifted by 2), quadrupole (green, shifted by 1) and octupole moment (blue) excited states, as well as deexcitation (dashed line) in water (a–c), acetonitrile (d–f) and methanol (g–i) using different charge distributions (100%, 50% and 20% charge change as depicted in Fig. 1). | |
To avoid confusion between the terms “ground” and “excited” state when handling both the excitation and the deexcitation of the benzene-like solute, the nomenclature is chosen as follows: SQ←0(t) refers to the relaxation function after excitation from the nonpolar benzene 0 to the quadrupolar state Q, as also graphically shown in Fig. 1. The corresponding ground state correlation function Cg(t) is then CQ←0(t), whereas C0←Q(t) is the excited state correlation function Ce(t) to this system. The functions for the dipolar state μ and the octupolar state Ω are named accordingly. As evident from Fig. 2, the different solvents lead to a different shape and timescale of S(t), as well as a differently good fit to the respective correlation functions. In acetonitrile, ground and excited state correlation functions for both the forward and reverse reaction for all nine solutes equal each other almost perfectly. Furthermore, S(t) of both forward and reverse reaction is well described using either of the correlation functions. A different picture arises for water and methanol. In both solvents, for large charge changes (here 50% and 100%) only the respective excited state correlation functions yield a good fit to the Stokes shift relaxation function, e.g. C0←Ω(t) = SΩ←0(t) but CΩ←0(t) ≠ SΩ←0(t) for the full charge difference of the octupolar solute in water. This trend can be seen throughout all systems: whenever Cg(t) ≠ Ce(t), the correlation function Ce(t) describes S(t) better. However, for about ten of the 54 systems none of the two correlation functions describes the time-dependence of the Stokes shift accurately, as can for example be seen for the excitation and deexcitation of the dipolar solute in methanol using the largest charge difference. In these systems, the solvation response cannot by described using neither linear response, nor Gaussian statistics.
Some additional information can also be drawn from Fig. 2: first, the forward reaction (creation of multipole moments) is (if at all) slower than the backward reaction (destruction of multipole moments). Second, if the solvation dynamics of multipole creation and destruction differ, using Cg(t) for the multipole creation reaction is always too fast, whereas using Cg(t) for the backward reaction is always too slow. If this is a universal finding it should also occur for real chromophores like 1-methyl-6-oxyquinolinium betaine (1MQ) which lowers its dipole moment upon excitation (corresponding to S0←μ(t)), as well as Coumarin 153 (C153) which strengthens its dipole moment upon excitation (corresponding to Sμ←0(t)). Calculating Cg(t) for these systems should then yield qualitatively different results, as for one system the correlation function should lead to a too slow response, whereas in the other to a too fast response. Preliminary calculations for 1MQ in water, methanol and the ionic liquid 1-ethyl-3-methylimidazolium trifluoromethanesulfonate already revealed that Cg(t) is indeed much slower than S(t), but will be the topic of a different publication. Third, the solvent around solutes showing a quadrupolar moment tends to relax faster than for a dipolar moment, which is in accordance to reported findings in the literature.20 The trend for octupolar moments is not as clear. Fourth, solutes undergoing a large change in charge distribution tend to relax slower than those undergoing only minor changes in charge.
Coming back to the validity of linear response in these systems, from Fig. 2 we deduce that the applicability of linear response theories and even Gaussian statistics depends on the combination of the order of multipolar moment in the solute, as well as the size of the change in partial charges, the direction of change and the nature of the solvent itself. To reveal the circumstances where linear response theories fails, the magnitude of the overall Stokes shift, the shape and time evolution of the energy gap distribution, as well as the solvent structure are calculated in the following.
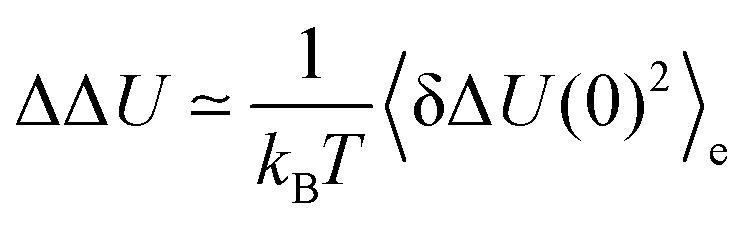
As pointed out in Sections 2.1 and 2.2, linear response theory is formally only valid for small perturbations, namely if ΔΔU is small on a scale of kBT. Table 2 shows ΔΔU in multiples of kBT, so that the applicability of this approximation can be assesed. The dipolar change in charge distribution shows the largest absolute Stokes shift, where even the smallest change in charge leads to a shift larger than kBT. Higher multipolar moments lead to smaller absolute shifts, where the 20% charge change already falls in a linear regime due to the small perturbation. Interestingly, these observations hold true for all solvents, namely water, acetonitrile and methanol, although the validity of linear response theory as inferred from Fig. 2 strongly depends on the nature of the solvent. It should be noted, too, that in the nonequilibrium simulations, the magnitude of change in the forward and the reverse reaction is nearly the same. In the equilibrium case, however, the absolute shifts for the forward reactions are (more or less) good estimates of the nonequilibrium events, but the shifts of the backward reactions are in some cases largely overestimated in water and methanol. Such a discrepancy is obtained if the equilibrium fluctuations in ground and excited state are rather different. This effect is especially pronounced in water and methanol. From inspection of Table 2 it can therefore be deduced that higher multipolar moments in the solute lead to smaller perturbations and that in water and methanol the energy fluctuations in ground and excited state do not correspond well to each other. These observations indicate that conventional linear response theory might fail, especially for large dipolar or quadrupolar charge changes in water or methanol. However, no conclusion can be drawn on whether the relation Ce(t) = S(t) still holds true for such systems because Gaussian statistics apply. The next chapter is therefore solely concerned with the (Gaussian) distribution of the interaction energies, both stationary in the case of equilibrium simulations, and time-dependent as seen in nonequilibrium simulations.
Table 2 Absolute Stokes shift of the non-equilibrium and equilibrium simulations of the excitation of benzene. Values in brackets refer to the respective reverse reactions, i.e. the deexcitation
| System |
Nonequilibrium ΔΔU/(kBT) |
Equilibrium ΔΔU/(kBT) |
| H2O |
ACN |
MeOH |
H2O |
ACN |
MeOH |
| μ |
100% |
183.7 |
(183.7) |
90.6 |
(92.1) |
142.5 |
(140.6) |
198.4 |
(241.5) |
108.8 |
(86.2) |
112.8 |
(159.0) |
| 50% |
45.8 |
(46.0) |
25.2 |
(24.9) |
36.6 |
(36.2) |
49.6 |
(60.4) |
27.2 |
(21.5) |
28.2 |
(39.8) |
| 20% |
7.6 |
(7.8) |
4.1 |
(4.0) |
4.8 |
(4.6) |
7.9 |
(9.7) |
4.4 |
(3.4) |
4.5 |
(6.4) |
|
|
| Q |
100% |
103.8 |
(103.1) |
35.8 |
(35.4) |
76.8 |
(76.5) |
48.4 |
(107.6) |
33.9 |
(32.4) |
32.0 |
(104.3) |
| 50% |
20.1 |
(20.3) |
8.8 |
(8.6) |
10.4 |
(10.3) |
12.1 |
(26.9) |
8.5 |
(8.1) |
8.0 |
(26.1) |
| 20% |
2.1 |
(2.1) |
1.4 |
(1.2) |
1.3 |
(1.3) |
1.9 |
(4.3) |
1.4 |
(1.3) |
1.3 |
(4.2) |
|
|
| Ω |
100% |
28.8 |
(29.1) |
9.1 |
(8.9) |
13.0 |
(13.0) |
14.2 |
(66.3) |
9.9 |
(8.4) |
8.9 |
(25.3) |
| 50% |
4.6 |
(4.5) |
2.5 |
(2.4) |
2.5 |
(2.3) |
3.5 |
(16.6) |
2.5 |
(2.1) |
2.2 |
(6.3) |
| 20% |
0.6 |
(0.6) |
0.4 |
(0.3) |
0.4 |
(0.4) |
0.6 |
(2.7) |
0.4 |
(0.3) |
0.4 |
(1.0) |
4.2 Time-evolution of the spectral width
The Gaussian function| |  | (16) |
describes the energy gap histogram with  and the standard deviation σ = W(t) where W(t) is obtained using
| | 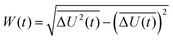 | (17) |
Fig. 3 shows the equilibrium energy gap distribution in ground and excited state of the dipolar, quadrupolar and octupolar state of the solute (100% charge change) in water. The distributions are perfectly Gaussian, but the respective widths change upon excitation or deexcitation, as can be seen for example when comparing the nonpolar and the octupolar state (blue curves). However, the Gaussian character of the distributions is diminished for some of the 50% and 20% quadrupolar and octupolar states, as the distribution becomes slightly asymmetric (not shown). This deviation from Gaussian distribution of the energy gap is explained later on.
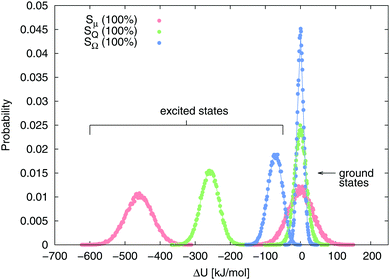 |
| | Fig. 3 Equilibrium energy gap distributions of benzene in ground and excited (μ 100%, Q 100% and Ω 100%) state in water. Continuous lines represent the fitted Gaussian functions. | |
Table 3 lists the widths of all 54 systems. In water and methanol, the distribution broadens upon excitation of the nonpolar benzene ground state to the dipolar, quadrupolar or octupolar state, and in some cases (Ω 100%) even doubles its width. The 100% and 50% charge changes in water and methanol inflict large changes in the width, therefore implying nonstationary statistics, whereas for 20% charge change the width changes only marginally. In acetonitrile in contrast, the distribution becomes slightly narrower upon excitation or does not change at all. Here, stationary Gaussian statistics apply. It should be noted that higher multipole moments, as well as smaller charge changes lead to narrower energy distributions in all solvents. Interestingly, the results from Tables 2 and 3 do not correspond well to each other in some systems. If the energy gap distribution is purely Gaussian, then the width of the distribution determines the magnitude of the overall Stokes shift:54,55
| |  | (18) |
which can be directly derived from
eqn (15) and the definition of the width in
eqn (17). Deviations larger than 10% of
W compared to the value calculated
viaeqn (18) are printed in italic in
Table 3. The deviations only occur in the quadrupolar and octupolar excited states of the benzol solute and indicate a to some extent non-Gaussian distribution. However, in all those systems
Fig. 2 yields
S(
t) =
Ce(
t), which strictly spoken should only apply for purely Gaussian distributions. The implications of this finding will be discussed later on. For now, let us return to the problem of a changing distribution width from ground to excited state. A comparison between
Table 3 and
Fig. 2 reveals that the implication of stationary Gaussian statistics, namely that
S(
t) =
Ce(
t), holds also for some of the systems with huge changes in
W, for example for
Ω ←
0 100% in water. The mere presence of large width changes, which inherently invokes nonstationary statistics, therefore surprisingly does not nullify the Gaussian statistics approximation. However, although the change in width itself does not correlate with the agreement of the respective
S(
t) and
Ce(
t) curves, the time evolution of the energy distribution does, as will be explained in the following.
Table 3 Width W of the equilibrium energy gap distributions according to eqn (17) in ground (g) and excited (e) states in water, acetonitrile and methanol, as well as the absolute and percentage increase/decrease Δ between the width in ground and excited state. Italic values indicate a deviation larger than 20% from the expected value viaeqn (18)
| System |
W
water/(kBT) |
W
acetonitrile/(kBT) |
W
methanol/(kBT) |
| g |
e |
Δ
|
g |
e |
Δ
|
g |
e |
Δ
|
| μ |
100% |
14.2 |
15.6 |
1.4 |
(+10%) |
10.4 |
9.3 |
−1.1 |
(−11%) |
10.6 |
12.6 |
1.9 |
(+18%) |
| 50% |
7.1 |
6.8
|
−0.3 |
(−4%) |
5.2 |
5.0 |
−0.2 |
(−4%) |
5.3 |
6.4 |
1.1 |
(+21%) |
| 20% |
2.8 |
2.9 |
0.0 |
(+1%) |
2.1 |
2.1
|
0.0 |
(−0%) |
2.1 |
2.4 |
0.3 |
(+12%) |
|
|
| Q |
100% |
6.9 |
10.4 |
3.5 |
(+50%) |
5.8 |
5.7 |
−0.1 |
(−2%) |
5.7 |
10.2 |
4.5 |
(+80%) |
| 50% |
3.5 |
5.7 |
2.2 |
(+64%) |
2.9 |
2.9 |
0.0 |
(+1%) |
2.8 |
4.0
|
1.1 |
(+40%) |
| 20% |
1.4 |
1.6
|
0.2 |
(+14%) |
1.2 |
1.2 |
0.0 |
(+1%) |
1.1 |
1.2
|
0.1 |
(+5%) |
|
|
| Ω |
100% |
3.8 |
8.1 |
4.4 |
(+117%) |
3.1 |
2.9 |
−0.2 |
(−8%) |
3.0 |
5.0 |
2.0 |
(+69%) |
| 50% |
1.9 |
2.4
|
0.5 |
(+29%) |
1.6 |
1.5 |
−0.0 |
(−2%) |
1.5 |
1.7
|
0.2 |
(+12%) |
| 20% |
0.8 |
0.8
|
0.0 |
(+4%) |
0.6 |
0.6
|
0.0 |
(+1%) |
0.6 |
0.6
|
0.0 |
(+2%) |
The validity of Gaussian statistics therefore does not depend on the extent of non-stationarity because of absolute changes in width between ground and excited state, but on the way this change in width is achieved. The time evolution can be directly calculated viaeqn (17) using nonequilibrium trajectories and is depicted in Fig. 4. The circles at the beginning and end of each figure denote the equilibrium values from Table 3. The good agreement to the nonequilibrium data (continuous and dashed lines) validates the correct sampling of initial configurations used to start each nonequilibrium trajectory, as well as full convergence after 50 ps. A closer look at the evolution of the width after excitation or deexcitation shows that in some systems the width changes smoothly from the initial to the final value (even for large differences between the final and initial width), whereas in others a large intermediate broadening is observed (in water: 100% μ excitation and deexcitation, 100% Q deexcitation; in methanol: 100% μ excitation and deexcitation, 100% Q excitation and deexcitation, as well as 50% μ excitation and deexcitation). Comparison of Fig. 4 and Fig. 2 shows that for all system showing such an intermediate broadening, the nonequilibrium response S(t) cannot be described using the excited state correlation function. Gaussian statistics therefore seems to fail not because of large changes in the width of the energy distribution upon a change in state, but because of the peculiar evolution of the width with time, namely whenever a intermediate broadening to widths larger than both final and initial values is observed. It should also be noted that in all systems showing differences in width between ground and excited state, the width changes faster to its final value for the deexcitation than for the excitation of the solute, which is consistent with Fig. 2, where upon deexcitation faster solvation dynamics can be observed. Obviously, the creation of structure (upon excitation) is slower than the destruction of structure (upon deexcitation).
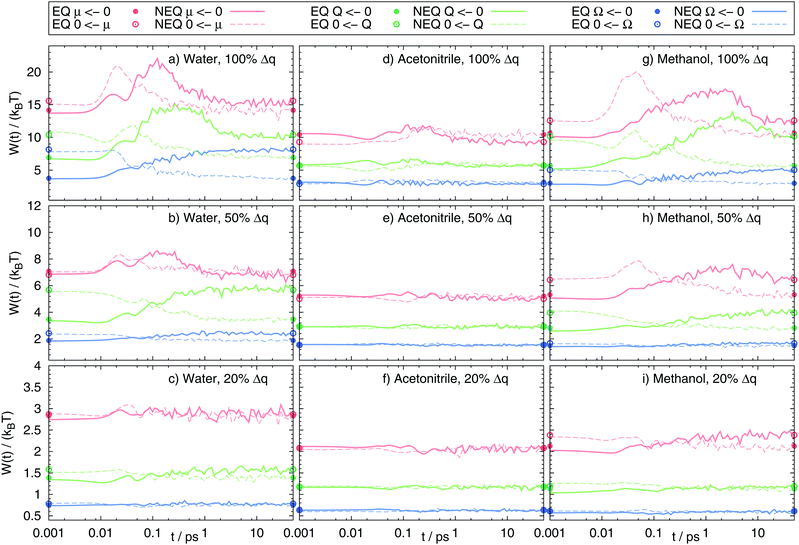 |
| | Fig. 4 Evolution of the width W(t) in the nonequilibrium (NEQ) simulations, after excitation (continuous line) from the benzene ground state to the dipole (red), quadrupole (green) and octupole moment (blue) excited states, as well as deexcitation (dashed line) in water (a–c), acetonitrile (d–f) and methanol (g–i) using different charge distributions. Note the different energy scales for 100% (first row), 50% (second row) and 20% (third row) charge changes. The curves are smoothed slightly using cubic splines for reasons of clarity. The respective widths in the equilibrium (EQ) simulations are also depicted as circles at the edges of the figure. | |
4.3 Higher order correlation functions
The validity of the Gaussian statistics assumption is often validated by showing that even-numbered higher order correlation functions of the excited state are zero, whereas odd-numbered ones are multiples of Ce(t) as evident from eqn (14). We therefore calculated the second and third correlation function of the excitation events in water, acetonitrile and methanol. Fig. 5 shows the deviation from each of the second order correlation functions to zero (light shaded areas), as well as the deviation from the third order correlation function (divided by three according to eqn (14)) to Ce(t). For most of the systems the relation holds true, although some minor deviation in Ce2(t) can be found in some methanol and water systems. However, the results do not correlate with the respective fits of the nonequilibrium response functions to Ce(t) in Fig. 2. Rather they only display that conventional linear response theory on the excited state surface does not hold, as this would set all higher order correlation functions to zero. What can be seen, however, is that most of the systems showing a non-Gaussian energy distribution (italic values in Table 3), also have deviations from the expected higher order correlation functions.
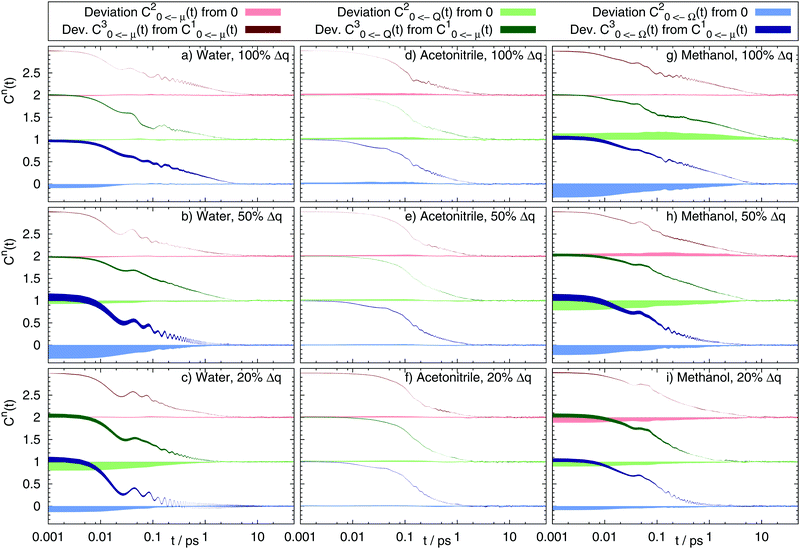 |
| | Fig. 5 Higher order correlation functions Cne, where  and a1 = 1, a2 = 1.6 and a3 = 3 according to eqn (14) after rearrangement. and a1 = 1, a2 = 1.6 and a3 = 3 according to eqn (14) after rearrangement. | |
4.4 Solvent structure
We already mentioned that large differences in Cg(t) and Ce(t), as well as in the absolute shifts calculated from these correlation functions can be the result of large differences in solvent structure upon change in solute state. Fig. 6 shows the radial distribution functions g000(r) obtained from equilibrium simulations. In water and methanol, the excitation inflicts large structure changes for the dipolar and quadrupolar state, invoking large scale solvent translation towards the solvent for 100% and some of the 50% charge changes. The octupolar state only requires minor structural reordering for 100% charge change. In acetonitrile, however, no diffusion towards the solute is observed, but only a narrowing of the respective peaks in the radial distribution functions. Comparison to Fig. 2 shows that indeed Cg(t) ≠ Ce(t) correlates with differences in g000(r) in ground and excited state, so that the equilibrium fluctuations in one state cannot reflect the dynamics in another state. As a result we conclude that whenever the solvent structure differs between ground and excited state, Cg(t) cannot be used to describe the true relaxation function S(t).
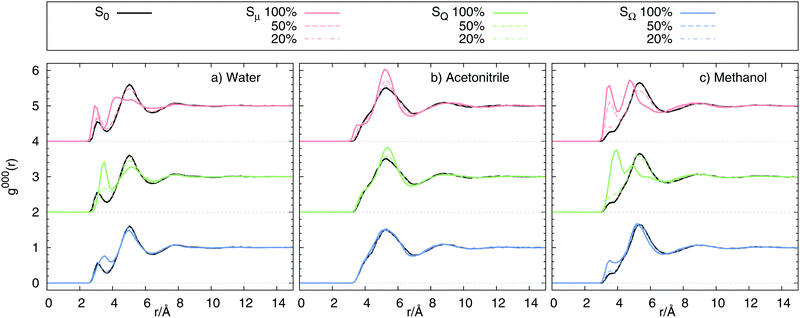 |
| | Fig. 6 Radial distribution function g000(r) of 0, μ, Q and Ω using charge changes of 100%, 50% and 20% in (a) water, (b) acetonitrile and (c) methanol. | |
5 Conclusion
We have examined the validity of linear response approximations and Gaussian statistics for the solvation dynamics of nine benzene-like solutes showing strong, intermediate or low dipole, quadrupole or octupole moments in water, acetonitrile and methanol. Although some references claim that linear response theories should hold for solvents having a large inertial component of the relaxation function,31,38e.g. water and acetonitrile, we observed failures of linear response and even Gaussian statistics for some solutes in water. The failure occurs whenever a intermediate broadening of the width of the energy gap distribution is observed. Such a nonstationarity, namely that the width of the Gaussian energy distribution changes with time, is thought to be at the root of breakdown of linear-response approximations.38,56 However, we refined this picture further, and found that not the absolute change in width, but the peculiarities of its time evolution determine whether or not linear-response approximations fail in a system, at least for the small polyatomic solutes studied. Together with the fact that the correlation functions in ground and excited state differ if the solvent structure in the two states differs, we have come up with the following recommendation on how to choose the correct working procedure in a specific system. Firstly, if the solvent structure is assumed to not change upon excitation, which can be calculated via radial distribution functions in both states, conventional linear response theory stating Cg(t) = Ce(t) = S(t) should be valid, so that either ground or excited state correlation functions can be used to approximate the solvation response function S(t). Otherwise, Cg(t) should not be used and we have to determine whether Gaussian statistics, and therefore Ce(t) = S(t) applies. This can be done via calculation of a few nonequilibrium simulations and monitoring of the spectral width. If no intermediate broadening occurs where the width is larger than both its final and initial value, one can use the excited state correlation function Ce(t) to approximate S(t). The absolute change in width (and therefore the actual nonstationarity) does not influence the validity of Ce(t) = S(t) (at least in the 54 systems in this study). If intermediate broadening occurs, the time-dependent Stokes shift cannot be described using correlation functions and one has to calculate the response functions using only nonequilibrium simulations. It should be mentioned, too, that if using Cg(t) without testing its validity one should never try to compare response functions of different systems, as Cg(t) is slower than S(t) in some systems, here for solutes lowering their multipole moment upon excitation, but faster for other systems, here solutes enlarging their multipole moment. A comparison of different chromophores that possibly undergo different changes in charge distribution might therefore lead to qualitatively wrong results. Quite generally, we do not recommend to use Cg(t) at all, as the calculation of Ce(t) is not computationally more expensive and always leads to a better fit to S(t) than Cg(t) (if Cg(t) and Ce(t) differ) given that accurate excited state force fields exist for the solute of interest. We also want to stress the fact that other observables of a simulation, as for example differences in ΔΔU from ground and excited state trajectories, the magnitude of the absolute Stokes shift, differences in actual and expected width via ΔΔU, absolute width changes or higher order correlation functions do not correlate sufficiently with the fit of Cg(t) or Ce(t) to S(t), so that they cannot be used to predict whether linear response approximations hold.
To sum up, the validity of linear response theories depends on peculiarities of the solvent, the size and multipolar order of change in charge distribution, as well as the direction of change. Protic solvents such as water and methanol tend to create different structures in ground and excited state, especially for large changes in charge distribution, so that linear response theory on the unperturbed energy surface usually fails. The multipolar moment of the solute also plays an important role, as dipolar and quadrupolar solutes showed to be especially prone to linear response failures. Also, the direction of change proved to influence the shape of the relaxation function, as well as the validity of the Gaussian statistics assumption, as intermediate spectral broadening may occur differently or even not at all in the forward or reverse reaction. For all investigated system we found that whenever intermediate broadening of the width of the (mostly) Gaussian energy gap distribution occurs, linear response approximations seem to fail. Further studies need to be conducted to verify this finding for other systems. A study on the validity of linear response of the chromophores 1-methyl-6-oxyquinolinium betaine and Coumarin 153, which are comparable to the excitation and the deexcitation of the μ solute in this study, in different solvents is already planned.
Acknowledgements
This work was funded by the Austrian Science Fund FWF in the context of Project No. FWF-P28556-N34.
References
- M. Maroncelli and G. R. Fleming, J. Chem. Phys., 1987, 86, 6221 CrossRef CAS.
- S. Vajda, R. Jimenez, S. J. Rosenthal, V. Fidler, G. R. Fleming and E. W. Castner, Jr., J. Chem. Soc., Faraday Trans., 1995, 91, 867 RSC.
- M. Maroncelli, J. Mol. Liq., 1993, 57, 1 CrossRef CAS.
- R. Jimenez, G. R. Fleming, P. V. Kumar and M. Maroncelli, Nature, 1994, 369, 471 CrossRef CAS.
- E. L. Mertz, V. A. Tikhomirov and L. I. Krishtalik, J. Phys. Chem. A, 1997, 101, 3433 CrossRef CAS.
- D. Aherne, V. Tran and B. Schwartz, J. Phys. Chem. B, 2000, 104, 5382 CrossRef CAS.
- J. W. Park, H. W. Kim, C. Song and Y. M. Rhee, J. Chem. Phys., 2011, 135, 014107 CrossRef PubMed.
- A. Petrone, G. Donati, P. Caruso and N. Rega, J. Am. Chem. Soc., 2014, 136, 14866 CrossRef CAS PubMed.
- E. Heid, S. Harringer and C. Schröder, J. Chem. Phys., 2016, 145, 164506 CrossRef PubMed.
- E. Heid and C. Schröder, J. Chem. Phys., 2016, 145, 164507 CrossRef PubMed.
- M. Maroncelli and G. R. Fleming, J. Chem. Phys., 1988, 89, 5044 CrossRef CAS.
- M. Maroncelli, J. Chem. Phys., 1991, 94, 2084 CrossRef CAS.
- B. D. Bursulaya, D. A. Zichi and H. J. Kim, J. Phys. Chem., 1995, 99, 10069 CrossRef CAS.
- J. S. Bader and D. Chandler, Chem. Phys. Lett., 1989, 157, 501 CrossRef CAS.
- L. R. Martins, A. Tamashiro, D. Laria and M. S. Skaf, J. Chem. Phys., 2003, 118, 5955 CrossRef CAS.
- L. R. Martins and M. S. Skaf, Chem. Phys. Lett., 2003, 370, 683 CrossRef CAS.
- B. M. Ladanyi and R. M. Stratt, J. Phys. Chem., 1995, 99, 2502 CrossRef CAS.
- B. M. Ladanyi and R. M. Stratt, J. Phys. Chem., 1996, 100, 1266 CrossRef CAS.
- P. V. Kumar and M. Maroncelli, J. Chem. Phys., 1995, 103, 3038 CrossRef CAS.
- B. M. Ladanyi and M. Maroncelli, J. Chem. Phys., 1998, 109, 3204 CrossRef CAS.
- V. Tran and B. J. Schwartz, J. Phys. Chem. B, 1999, 103, 5570 CrossRef CAS.
- B. M. Ladanyi and R. M. Stratt, J. Phys. Chem. A, 1998, 102, 1068 CrossRef CAS.
- L. Nilsson and B. Halle, Proc. Natl. Acad. Sci. U. S. A., 2005, 102, 13867 CrossRef CAS PubMed.
- K. E. Furse and S. A. Corcelli, J. Chem. Theory Comput., 2009, 5, 1959 CrossRef CAS PubMed.
- M. Schmollngruber, C. Schröder and O. Steinhauser, J. Chem. Phys., 2013, 138, 204504 CrossRef PubMed.
- F. Ingrosso, B. M. Ladanyi, B. Mennucci, M. D. Elola and J. Tomasi, J. Phys. Chem. B, 2005, 109, 3553 CrossRef CAS PubMed.
- K. E. Furse, B. A. Lindquist and S. A. Corcelli, J. Phys. Chem. B, 2008, 112, 3231 CrossRef CAS PubMed.
- E. Bernardi, M. M. Martins and H. Stassen, Chem. Phys. Lett., 2005, 407, 171 CrossRef CAS.
- S. W. Rick, S. J. Stuart and B. J. Berne, J. Chem. Phys., 1994, 101, 6141 CrossRef CAS.
- E. A. Carter and J. T. Hynes, J. Chem. Phys., 1991, 94, 5961 CrossRef CAS.
- T. Fonseca and B. M. Ladanyi, J. Phys. Chem., 1991, 95, 2116 CrossRef CAS.
- D. K. Phelps, M. J. Weaver and B. M. Ladanyi, J. Chem. Phys., 1993, 176, 575 CAS.
- M. S. Skaf and B. M. Ladanyi, J. Phys. Chem., 1996, 100, 18258 CrossRef CAS.
- N. Kometani, S. Arzhantsev and M. Maroncelli, J. Phys. Chem. A, 2006, 110, 3405 CrossRef CAS PubMed.
- C. Allolio and D. Sebastiani, Phys. Chem. Chem. Phys., 2011, 13, 16395 RSC.
- M. Sajadi, M. Weinberger, H.-A. Wagenknecht and N. P. Ernsting, Phys. Chem. Chem. Phys., 2011, 13, 17768 RSC.
- B. B. Laird and W. H. Thompson, J. Chem. Phys., 2007, 126, 211104 CrossRef PubMed.
- B. B. Laird and W. H. Thompson, J. Chem. Phys., 2011, 135, 084511 CrossRef PubMed.
-
R. Zwanzig, Nonequilibrium Statistical Mechanics, Oxford Univ. Press, New York, 2001 Search PubMed.
- A. E. Bragg, M. C. Cavanagh and B. J. Schwartz, Science, 2008, 321, 1817 CrossRef CAS PubMed.
-
D. Chandler, Introduction to Modern Statistical Mechanics, Oxford Univ. Press, New York, 1987 Search PubMed.
- G. C. Wick, Phys. Rev., 1950, 80, 268 CrossRef.
- B. R. Brooks, C. L. Brooks III, A. D. MacKerell Jr., L. Nilsson, R. J. Petrella, B. Roux, Y. Won, G. Archontis, C. Bartels, S. Boresch, A. Caflisch, L. Caves, Q. Cui, A. R. Dinner, M. Feig, S. Fischer, J. Gao, M. Hodoscek, W. Im, K. Kuczera, T. Lazaridis, J. Ma, V. Ovchinnikov, E. Paci, R. W. Pastor, C. B. Post, J. Z. Pu, M. Schaefer, B. Tidor, R. M. Venable, H. L. Woodcock, X. Wu, W. Yang, D. M. York and M. Karplus, J. Comput. Chem., 2009, 30, 1545 CrossRef CAS PubMed.
- K. Vanommeslaeghe and A. D. MacKerell Jr., J. Chem. Inf. Model., 2012, 52, 3144 CrossRef CAS PubMed.
- K. Vanommeslaeghe, E. P. Raman and A. D. MacKerell Jr., J. Chem. Inf. Model., 2012, 52, 3155 CrossRef CAS PubMed.
- K. Vanommeslaeghe, E. Hatcher, C. Acharya, S. Kundu, S. Zhong, J. Shim, E. Darian, O. Guvench, P. Lopes, I. Vorobyov and A. D. MacKerell Jr., J. Comput. Chem., 2010, 31, 671 CAS.
-
H. J. C. Berendsen, J. P. M. Postma, W. F. van Gunsteren and J. Hermans, Intermolecular Forces, Reidel, Dordrecht, the Netherlands, 1981 Search PubMed.
- H. J. C. Berendsen, J. R. Grigers and T. P. Straatsma, J. Phys. Chem., 1987, 91, 6269 CrossRef CAS.
- G. Kaminski and W. L. Jorgensen, J. Phys. Chem., 1996, 100, 18010 CrossRef CAS.
- L. Martínez, R. Andrade, G. Birgin and J. M. Martínez, J. Comput. Chem., 2009, 30, 2157 CrossRef PubMed.
- S. Nosé, J. Chem. Phys., 1984, 81, 511 CrossRef.
- W. G. Hoover, Phys. Rev. A: At., Mol., Opt. Phys., 1985, 31, 1695 CrossRef.
- N. Michaud-Agrawal, E. J. Denning, T. B. Woolf and O. Beckstein, J. Comput. Chem., 2011, 32, 2319 CrossRef CAS PubMed.
- T. Li, J. Phys. Chem. B, 2014, 118, 12952 CrossRef CAS PubMed.
- M. D. Stephens, J. G. Saven and S. L. Skinner, J. Chem. Phys., 1997, 106, 2129 CrossRef CAS.
- P. L. Geissler and D. Chandler, J. Chem. Phys., 2000, 113, 9759 CrossRef CAS.
|
| This journal is © the Owner Societies 2017 |

 Open Access Article
 This Open Access Article is licensed under a
  ,
Wanda
Moser
and
Christian
Schröder
,
Wanda
Moser
and
Christian
Schröder


 is the averaged electrostatic energy difference between ground and excited state.
 is assumed to depend linearly on the perturbation, so that the nonequilibrium event can be described by the energy fluctuations present in the equilibrium state of the system. S(t) is then assumed to be represented by the correlation function Cg(t) or Ce(t) of the energy gap in the equilibrated ground (g) or equilibrated excited (e) state. The underlying approximations and concepts of the different linear response assumptions are described in detail in Section 2.


 and the standard deviation σ = W(t) where W(t) is obtained using
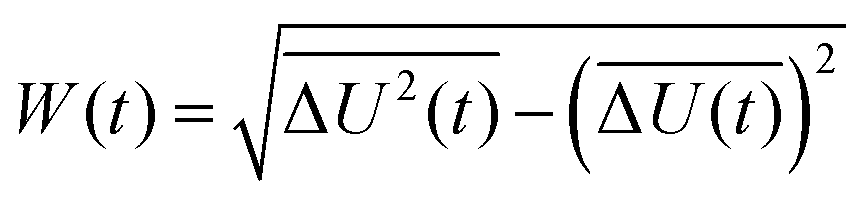


 and a1 = 1, a2 = 1.6 and a3 = 3 according to eqn (14) after rearrangement.