 Open Access Article
Creative Commons Attribution 3.0 Unported Licence
Nanoscale mapping of newly-synthesised phospholipid molecules in a biological cell using tip-enhanced Raman spectroscopy†
Naresh
Kumar
 *a,
Marek M.
Drozdz
b,
Haibo
Jiang
c,
Daniela M.
Santos
d and
David J.
Vaux
b
aNational Physical Laboratory, Hampton Road, Teddington, TW11 0LW, UK. E-mail: naresh.kumar@npl.co.uk; naresh.kumar.gautam@gmail.com
bSir William Dunn School of Pathology, University of Oxford, South Parks Road, OX1 3RE, UK
cCentre for Microscopy, Characterisation and Analysis, The University of Western Australia, Crawley WA 6009, Australia
dDowning College, University of Cambridge, CB2 1DQ, UK
First published on 8th February 2017
Abstract
Nanoscale chemical mapping of newly-synthesised phospholipid molecules inside a mammalian cell is demonstrated using tip-enhanced Raman spectroscopy (TERS) for the first time using mouse pre-adipocyte cells as a model system. Newly-synthesised membrane phospholipid distribution within a pre-adipocyte cell is mapped with <20 nm spatial resolution, overcoming the diffraction limit of confocal Raman spectroscopy via plasmonic enhancement of Raman signals at a TERS tip-apex.
The ability to visualise nanoscale distribution of small biomolecules within biological cells is crucial for answering questions regarding the structure–function relationships of sub-cellular biological nanostructures, molecular mechanisms of biological processes and development of cost-effective and target-specific drugs that are appropriately distributed within the cell.1 However, currently there is a lack of analytical techniques that can successfully carry out non-destructive and label-free molecular mapping of biological cells at the nanoscale. The technique that is closest to fulfilling these criteria is super-resolution fluorescence microscopy (SRFM), which allows non-destructive chemical mapping of analyte molecules inside biological cells with a nanoscale spatial resolution.2 However, it relies upon attachment of suitable fluorophores to the molecules of interest, which may influence the behaviour of analyte molecules inside the cell and alter their biological function. Furthermore, SRFM allows visualisation of only analyte molecules that are tagged with exogenous fluorescent labels, whereas all other biomolecules remain invisible. On the other hand, confocal Raman spectroscopy is a label-free technique that can successfully perform non-destructive chemical mapping of all Raman active molecules in their native state within a cellular environment;3 however, it suffers from the limitations of low sensitivity and diffraction-limited spatial resolution. A significant improvement in the sensitivity of Raman signals has been demonstrated recently using dielectric-based surface-enhanced Raman spectroscopy4 (SERS) implemented via light-trapping5 and subwavelength-focusing, morphology-dependent resonances6 and charge transfer from semiconductors to molecules.7 Dielectric-based SERS offers some unique advantages for chemical analysis such as low photochemical and thermal degradation of analyte molecules, tuning of field enhancement over a wide range and easy modification of surfaces via different functional groups. However, because of its lower sensitivity, lack of reproducibility and rather difficult data interpretation, the enhancement of Raman signals from biological samples has been achieved mostly using metal-based SERS. Although the sensitivity of Raman spectroscopy can be dramatically enhanced using techniques such as SERS8 and stimulated Raman spectroscopy (SRS),9 the spatial resolution remains diffraction-limited to 200–300 nm, precluding the molecular visualisation of biological nanostructures.
Recently, tip-enhanced Raman spectroscopy (TERS) has emerged as a powerful technique for non-destructive and label-free chemical mapping of a surface at the nanoscale and has been successfully applied to a wide range of research areas10 such as organic photovoltaic devices,11 polymer-blends,12 catalysis,13 2-D materials such as graphene14 and single-layer MoS2,15 single-walled carbon nanotubes16 and single molecule imaging.17 In TERS, a metal or metal-coated scanning probe microscopy tip is placed inside the excitation laser spot of a Raman microscope. When the surface plasmon resonance wavelength (λSPR) of the metal nanoparticle at the tip-apex matches with the excitation laser, the electromagnetic (EM) field at the tip-apex is significantly enhanced. This enhancement of the EM field at the tip-apex, due to a combination of localised surface plasmon (LSP) resonance and the lightning rod effect, enhances the Raman signal from analyte molecules directly underneath the tip, enabling Raman mapping with a nanoscale spatial resolution. So far, the application of TERS to biological samples has been mostly limited to conducting simple spectroscopy measurements at specific locations on biological samples18–20 and the full potential of TERS to visualise the nanoscale distribution of small biomolecules in a cellular environment via two-dimensional chemical mapping hasn't been fully realised yet. In this work, we demonstrate the non-destructive mapping of small biomolecules inside a biological cell using TERS for the first time without the use of any exogenous fluorescent labels. We use the nanoscale distribution of newly-synthesised phospholipid molecules inside the complex environment of a mouse pre-adipocyte cell as a model system to showcase the capability of TERS for molecular mapping of a biological cell with <20 nm spatial resolution. These results are expected to facilitate rational design of therapeutic drug molecules by measuring their distribution and targeted delivery inside a cell at nanometre length-scales as well as allow novel insights into biological processes, e.g. malfunctioning of cellular organelles such as mitochondria.
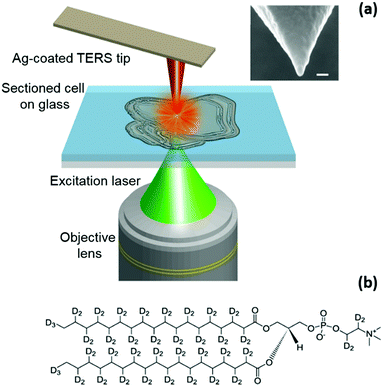
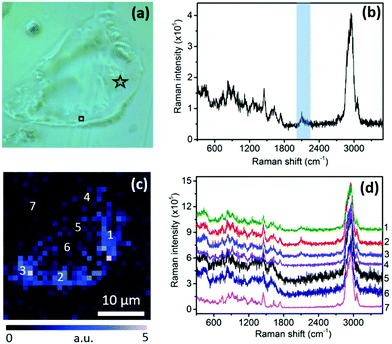
A schematic diagram of the TERS set-up used in this work is shown in Fig. 1a. See the ESI† for further experimental details of the optical set-up, the TERS system, and preparation of TERS tips and sectioned-cell samples. For this study, in vitro cultured mouse pre-adipocyte cells were pulse-treated with deuterated sodium stearate added to the growth medium. This experiment was designed to visualise the sites of newly-synthesised phospholipid (NSP) accumulation in the cells, where a new membrane is deployed when cells are driven to change their structure. While stearate enters many cellular metabolic pathways, including mitochondrial fatty acid oxidation, protein acylation, and diacylglycerol production, a major destination lies in phospholipid synthesis.21 In the samples used in this study, deuterated stearate ions are taken up as normal by the cells and metabolised to provide the fatty acyl tails of membrane phospholipids containing carbon–deuterium (C–D) bonds as shown in Fig. 1b. Because of the presence of 70 C–D bonds, the Raman spectrum of 1,2-distearoyl-d70-sn-glycero-3-phosphocholine molecules contains a strong C–D stretching band22 (see the ESI,† Fig. S3). Thus, an elevated intensity of the C–D Raman band at cellular membranes reveals sites of new phospholipid incorporation, which is very difficult to non-destructively localise in any other way.23 After stearate treatment, the cells were washed, fixed, infiltrated and embedded in epoxy resin. 1 µm thick sections containing cell profiles were then analysed using confocal Raman spectroscopy and TERS. Confocal Raman measurements of a cell section are presented in Fig. 2. In Fig. 2a, a cell section embedded inside the resin can be easily identified from the contrast in the optical image; however, no information about the molecular distribution within the cell can be discerned from this image. A confocal Raman spectrum measured at the position marked with a star in Fig. 2a is shown in Fig. 2b. The C–D stretching band24 in the spectrum is highlighted in blue. Since the intensity of the Raman signal is directly proportional to the concentration of the analyte molecules within the confocal probe volume, the relative distribution of NSP molecules within the cell can be tracked using the intensity of the C–D band. The confocal Raman map of the C–D band intensity is shown in Fig. 2c. The intensity of the C–D band is calculated from the average intensity in the 2026–2174 cm−1 spectral region after linear background subtraction. A higher intensity towards the bottom and right edges of the cell indicates a relatively greater phospholipid synthesis in these locations, resulting in a higher concentration of NSP molecules. This is further confirmed by the confocal Raman spectra shown in Fig. 2d, which are measured at the positions marked in Fig. 2c. A C–D band at ≈2100 cm−1 appears only in the spectra from locations 1, 2 and 3 from the right and bottom edges of the cell, whereas no C–D band is observed from the Raman spectra at positions 4, 5 and 6 inside the cell and position 7 outside the cell, indicating an absence of NSP molecules at these locations. The signal to noise ratio of the spectra measured at locations 5 and 6 is different from locations 1, 2, 3 and 4 within the cell presumably due to the difference in local cellular composition as indicated by the apparent morphological difference in the optical image shown in Fig. 1a. The different local cellular composition would result in sampling of different molecular content within the confocal volume of the far-field Raman measurements.
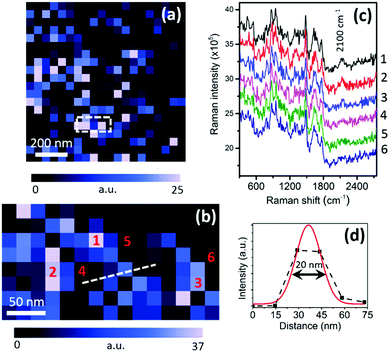
The results shown in Fig. 2 demonstrate that confocal Raman spectroscopy can successfully detect and map the relative distribution of NSP molecules at the micron-scale inside a biological cell using the intensity of the C–D band. In order to visualise the distribution of NSP molecules within the cell at the nanoscale we carried out TERS mapping in a 1 × 1 µm2 region of the cell, which is marked with a square in Fig. 2a. Fig. 3a shows the TERS map of the C–D band intensity in the 1 × 1 µm2 area. From the TERS map, a discrete variation in the intensity of the C–D band throughout the region is observed, which indicates a heterogeneous distribution of NSP molecules in this region of the cell. It can be noted that the NSP molecules do not aggregate in big clusters inside the cell but prefer to form thin chain-like features, which can be seen more clearly in the TERS map shown in Fig. S4a (ESI†) after linear smoothening. Moreover, the TERS map in Fig. 3a shows the distribution of NSP molecules within the top few nm of the sample surface due to the extremely small probe depth of tip-enhanced Raman signals.25 To probe the distribution of NSP molecules further in this region we carried out TERS mapping in a 100 × 200 nm2 area (marked by a dashed rectangle in Fig. 3a) with 4 times smaller pixel size compared to Fig. 3a. The TERS map of the C–D band intensity in this region is shown in Fig. 3b. A clear variation in the C–D band intensity throughout this region is observed, showing the distribution of NSP molecules within a region much smaller than the far-field laser spot, which for our microscope is measured to be ≈450 nm. This TERS map confirms the observation that the NSP molecules form chain-like features at the nanoscale, as indicated by the smoothened map shown in Fig. S4b (ESI†). The shape profiles of these features indicate that these structures most likely correspond to the smooth endoplasmic reticulum, where phospholipid synthesis takes place.26 In these locations, deuterated stearate ions, which are taken up as normal by the cells, are metabolised to provide the fatty acyl tails of membrane phospholipids. Fig. 3c shows TERS spectra measured at six different positions marked in Fig. 3b. The TERS spectra in Fig. 3c show that a clear C–D band appears only at positions 1–3, confirming the presence of NSP molecules at these locations, whereas no C–D band is observed in the TERS spectra from positions 4–6, which can be distinguished from the noise, indicating an absence of NSP molecules at these locations. It should be noted that although the distance between positions 1 and 5, 2 and 4, and 3 and 6 is only about 27 nm, a clear insight into the presence or absence of NSP molecules can be obtained using TERS mapping. A better estimate of the spatial resolution of the TERS map is shown in Fig. 3d by fitting a Gaussian curve13,27 to the intensity profile along the line marked in Fig. 3b. From this line profile the spatial resolution of the TERS map is estimated to be 19.3 nm. A similar spatial resolution has been previously achieved by our group in the TERS measurements of other samples such as heterogeneous catalysts,13 graphene27 and single-layer MoS228 using similar TERS probes.
 | ||
| Fig. 3 (a) TERS map of C–D band intensity (20 × 20 pixels) of the cellular region marked with a black square in Fig. 2a. (b) TERS map of C–D band intensity from a 100 × 200 nm2 area (8 × 15 pixels) marked by a dashed rectangle in (a). (c) TERS spectra measured at the positions marked in (b). The spectra are vertically shifted for easier visualisation. Raman intensity is plotted as counts per second per watt. (d) Estimation of TERS resolution using Gaussian fit to the intensity profile along the line marked in (b). Laser power at the sample: 350 µW. See Fig. S4 (ESI†) for smoothened versions of (a) and (b). | ||
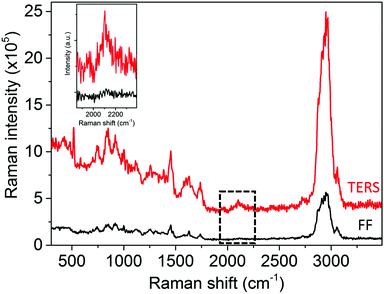
In TERS measurements, “contrast” is used as a measure of the plasmonic enhancement of a TERS probe and is defined as29
 | (1) |
 | ||
| Fig. 4 Comparison of the TERS (average spectrum of the TERS map in Fig. 3a) and far-field (confocal Raman spectrum from the corresponding position in Fig. 2c) Raman spectra. The inset shows the zoomed in part of the TERS and far-field spectra highlighted by a dotted rectangle. Raman intensity is plotted as counts per second per watt. | ||
The subcellular distribution of small molecules, especially therapeutic drugs in biological cells, is of great medical significance.30 The site of action and the site(s) of distribution of a drug molecule within the cell may not be the same, and understanding this is key to realising an adequate effective dose without causing debilitating side-effects. Current methods to study subcellular distribution usually rely on extrinsic fluorescent labels that can dramatically alter the molecular weight and physical properties of the parent molecule, limiting the relevance and utility of distribution data. However, as shown in this work, stable isotope tags such as deuterium in conjunction with TERS offer an alternative high resolution approach that does not suffer from this severe disadvantage. Herein, we have demonstrated non-destructive two-dimensional mapping of newly-synthesised phospholipid molecules within a biological cell with <20 nm spatial resolution using TERS for the first time without using any fluorescent labels. Such detailed information about molecular distribution at the nanoscale within a biological cell cannot be obtained using far-field techniques such as confocal Raman microscopy due to its diffraction-limited spatial resolution and low sensitivity. However, in TERS the localised surface plasmon resonance at the tip-apex improves the spatial resolution of biomolecular Raman mapping by >10 times. Furthermore, this work shows that the strategy of sectioning a cell into < 1 μm thick slices is a useful method to probe nanoscale molecular distribution inside a cell using TERS. We expect this work to pave the way for addition of TERS as a complementary analytical technique within the repertoire of bio-nanoimaging tools to obtain a deeper understanding of biological processes, malfunctioning of cell organelles and rational design of therapeutic drugs via biomolecular mapping of biological cells at nanometre length-scales.
The authors acknowledge support from the UK Department for Business, Energy and Industrial Strategy (BEIS). DJV acknowledges support from BBSRC grant number BB/L002159/1.
References
- N. Zheng, H. N. Tsai, X. Zhang, K. Shedden and G. R. Rosania, Mol. Pharmaceutics, 2011, 8, 1611–1618 CrossRef CAS PubMed.
- B. Huang, M. Bates and X. W. Zhuang, Annu. Rev. Biochem., 2009, 78, 993–1016 CrossRef CAS PubMed.
- Z. Movasaghi, S. Rehman and I. U. Rehman, Appl. Spectrosc. Rev., 2007, 42, 493–541 CrossRef CAS.
- I. Alessandri and J. R. Lombardi, Chem. Rev., 2016, 116, 14921–14981 CrossRef CAS PubMed.
- Y.-C. Lee, E.-Y. Wang, Y.-L. Liu and H.-L. Chen, Chem. Mater., 2015, 27, 876–884 CrossRef CAS.
- L. K. Ausman and G. C. Schatz, J. Chem. Phys., 2008, 129, 054704 CrossRef PubMed.
- J. R. Lombardi and R. L. Birke, J. Phys. Chem. C, 2014, 118, 11120–11130 CAS.
- T. M. Cotton, J. H. Kim and G. D. Chumanov, J. Raman Spectrosc., 1991, 22, 729–742 CrossRef CAS.
- J.-X. Cheng and X. S. Xie, Science, 2015, 350, aaa8870 CrossRef PubMed.
- N. Kumar, S. Mignuzzi, W. Su and D. Roy, EPJ Tech. Instrum., 2015, 2, 9 CrossRef.
- X. Wang, D. Zhang, K. Braun, H. J. Egelhaaf, C. J. Brabec and A. J. Meixner, Adv. Funct. Mater., 2010, 20, 492–499 CrossRef CAS.
- B. S. Yeo, E. Amstad, T. Schmid, J. Stadler and R. Zenobi, Small, 2009, 5, 952–960 CrossRef CAS PubMed.
- N. Kumar, B. Stephanidis, R. Zenobi, A. Wain and D. Roy, Nanoscale, 2015, 7, 7133–7137 RSC.
- S. Mignuzzi, N. Kumar, B. Brennan, I. S. Gilmore, D. Richards, A. J. Pollard and D. Roy, Nanoscale, 2015, 7, 19413–19418 RSC.
- W. Su, N. Kumar, S. J. Spencer, N. Dai and D. Roy, Nano Res., 2015, 8, 3878–3886 CrossRef CAS.
- Y. Okuno, Y. Saito, S. Kawata and P. Verma, Phys. Rev. Lett., 2013, 111, 216101 CrossRef PubMed.
- R. Zhang, Y. Zhang, Z. C. Dong, S. Jiang, C. Zhang, L. G. Chen, L. Zhang, Y. Liao, J. Aizpurua, Y. Luo, J. L. Yang and J. G. Hou, Nature, 2013, 498, 82–86 CrossRef CAS PubMed.
- B. R. Wood, E. Bailo, M. A. Khiavi, L. Tilley, S. Deed, T. Deckert-Gaudig, D. McNaughton and V. Deckert, Nano Lett., 2011, 11, 1868–1873 CrossRef CAS PubMed.
- S. Najjar, D. Talaga, L. Schue, Y. Coffinier, S. Szunerits, R. Boukherroub, L. Servant, V. Rodriguez and S. Bonhommeau, J. Phys. Chem. C, 2014, 118, 1174–1181 CAS.
- D. Kurouski, T. Deckert-Gaudig, V. Deckert and I. K. Lednev, Biophys. J., 2014, 106, 263–271 CrossRef CAS PubMed.
- J. Berg, J. Tymoczko and L. Stryer, Biochemistry, W H Freeman, New York, 5th edn, 2002 Search PubMed.
- C. Matthäus, A. Kale, T. Chernenko, V. Torchilin and M. Diem, Mol. Pharmaceutics, 2008, 5, 287–293 CrossRef PubMed.
- H. Jiang, E. Favaro, C. Goulbourne, P. Rakowska, G. Hughes, M. Ryadnov, L. Fong, S. Young, D. Ferguson and A. Harris, Methods, 2014, 68, 317–324 CrossRef CAS PubMed.
- L. Opilik, T. Bauer, T. Schmid, J. Stadler and R. Zenobi, Phys. Chem. Chem. Phys., 2011, 13, 9978–9981 RSC.
- N. Kumar, A. Zoladek-Lemanczyk, A. A. Y. Guilbert, W. Su, S. M. Tuladhar, T. Kirchartz, B. C. Schroeder, I. McCulloch, J. Nelson, D. Roy and F. A. Castro, Nanoscale, 2017 10.1039/C6NR09057E.
- P. Fagone and S. Jackowski, J. Lipid Res., 2009, 50, S311–S316 CrossRef PubMed.
- W. Su, N. Kumar, N. Dai and D. Roy, Chem. Commun., 2016, 52, 8227–8230 RSC.
- W. Su, N. Kumar, S. Mignuzzi, J. Crain and D. Roy, Nanoscale, 2016, 8, 10564–10569 RSC.
- N. Kumar, A. Rae and D. Roy, Appl. Phys. Lett., 2014, 104, 123106 CrossRef.
- N. Zheng, H. N. Tsai, X. Zhang and G. R. Rosania, Mol. Pharmaceutics, 2011, 8, 1619–1628 CrossRef CAS PubMed.
Footnote |
| † Electronic supplementary information (ESI) available: Optical set-up, TERS system, tip preparation, sample preparation, Raman spectrum of 1,2-distearoyl-d70-sn-glycero-3-phosphocholine, and TERS maps of C–D band intensity with linear smoothening. See DOI: 10.1039/c6cc10226c |
| This journal is © The Royal Society of Chemistry 2017 |


