
Are my data normal?
Analytical Methods Committee AMCTB No. 82
First published on 11th October 2017
Abstract
Many inferences from statistical methods use the assumption that experimental data form a random sample (using that word in the statistical, not the chemical or physical, sense) from a population with a normal (Gaussian) distribution of measurement errors or other variations. In most cases this assumption is not actually tested, so if it is not valid false deductions may be made from the data. This Technical Brief considers cases where the normal distribution is generally taken to be valid, discusses how likely that is to be true, and how it is possible to test whether a data sample might come from a normally distributed population.
The normal distribution – background
The normal distribution was described by Abraham de Moivre in 1733 as an approximation to the binomial distribution for a large number of trials: his motivation was his enthusiasm for gambling, about which he wrote a treatise! Later in the 18th century Laplace studied error distributions, and in 1809 Gauss derived a formula for the distribution curve analogous to the one used today, hence the common use of the term Gaussian distribution. Early applications were in astronomy, perhaps the first science to call for highly accurate measurements: Galileo had recognised the importance of measurement errors almost 200 years earlier. The term normal distribution was used in the late 19th century, but was popularised by Karl Pearson around 1920, partly because of its common occurrence, but also to avoid controversy over whether de Moivre, Laplace, Gauss or other mathematical pioneers should receive the credit for its discovery. de Moivre and Laplace also figured in the discovery of the central limit theorem, which is closely related to the normal distribution (see below), for Laplace the motivation was again the interpretation of astronomical data.
The main properties of the normal distribution are too well known to require summarising, but we should identify the many circumstances in which its occurrence is explicitly or implicitly assumed. Most obvious are in estimates of confidence limits and uncertainties, which use the fact that ∼68% of the results in a normally distributed population will lie within one standard deviation of the mean, ∼95% within two standard deviations of the mean, and so on. These characteristics are also routinely used to set up Shewhart-type control charts. Rather less obvious cases where we assume that data are normally distributed are in the application of important significance tests, including tests for outliers (see TB 69); in the calculation and use of calibration graphs, including the conventional definitions and estimation of limits of detection and quantitation; and in the numerous uses of analysis of variance. Further areas of relevance include many multivariate methods, and also cases where measurements can be converted to a normal distribution by transformation, such as the log-normal data that sometimes arise in clinical data from different patients. Analytical scientists may thus need reassurance that their data samples could come from a population with normally distributed variations.
The normal assumption—how valid is it?
Many tests of the validity of the normal distribution have been performed, often using large data sets. Generally the data fit the normal distribution quite well, but with some discrepancies near the “tail” values well removed from the mean. Probably the data used were not always obtained in what we would nowadays call repeatability conditions. Thus 300 measurements of the celestial coordinates of a star are unlikely to have been made by the same observer with the same instrumentation in the same observing conditions, so the results were probably formed of two or more superimposed normal distributions with similar means but different variances. Gross errors might occasionally arise too, giving rise to outlier values in the tails of the published distributions. Analysis of almost 3000 values of the velocity of light showed that the data were best fit by two normal distributions with closely similar means, but very different variances. Recent studies of the weights of thousands of pharmaceutical tablets, to test whether they provide satisfactory dose uniformity, also revealed departures from the normal distribution. For large data sets such departures can be expressed quantitatively using skewness and/or kurtosis (“peakedness”) values. However, in the analytical sciences large data sets are relatively uncommon, so we may need to establish whether relatively small data samples could be derived from a normal population distribution. Data with “heavy tails” and/or outliers in an otherwise roughly normal distribution are now known to be best treated using robust statistical methods (TBs No.s 6, 50, 64), but such methods are not suitable in situations where the data are highly skewed or multi-modal.The central limit theorem (CLT)
This crucial—but perhaps insufficiently well known—statistical principle provides reassurance for those handling small data samples. In essence the theorem states that the sampling distribution of the mean (i.e., the distribution of the means of a number of samples of the same size taken from a given population) tends towards a normal distribution as the sample size increases, irrespective of the nature of the population distribution. This remarkable result can be easily demonstrated using a spreadsheet calculation, and several web sites offer dynamic simulations. Fig. 1 shows that the means of even quite small samples taken from a uniform distribution are distributed approximately normally. As a result, the confidence limits and uncertainties derived from such means can be reasonably assumed to have the expected normal distribution properties, whatever the original population distribution. A corollary, or an alternative statement, of the CLT is that when a result arises as the outcome of a number of independent processes, its variation may be expected to tend towards normality. This is a further reassurance for analytical scientists, as even very simple analytical procedures such as titrations can be broken down into a set of separate processes, each with its own small independent sources of variation. These assurances are all the more welcome because, as shown in the example below, it is impossible to prove or disprove with much conviction that a data sample is taken from a normal population if the number of measurements is small.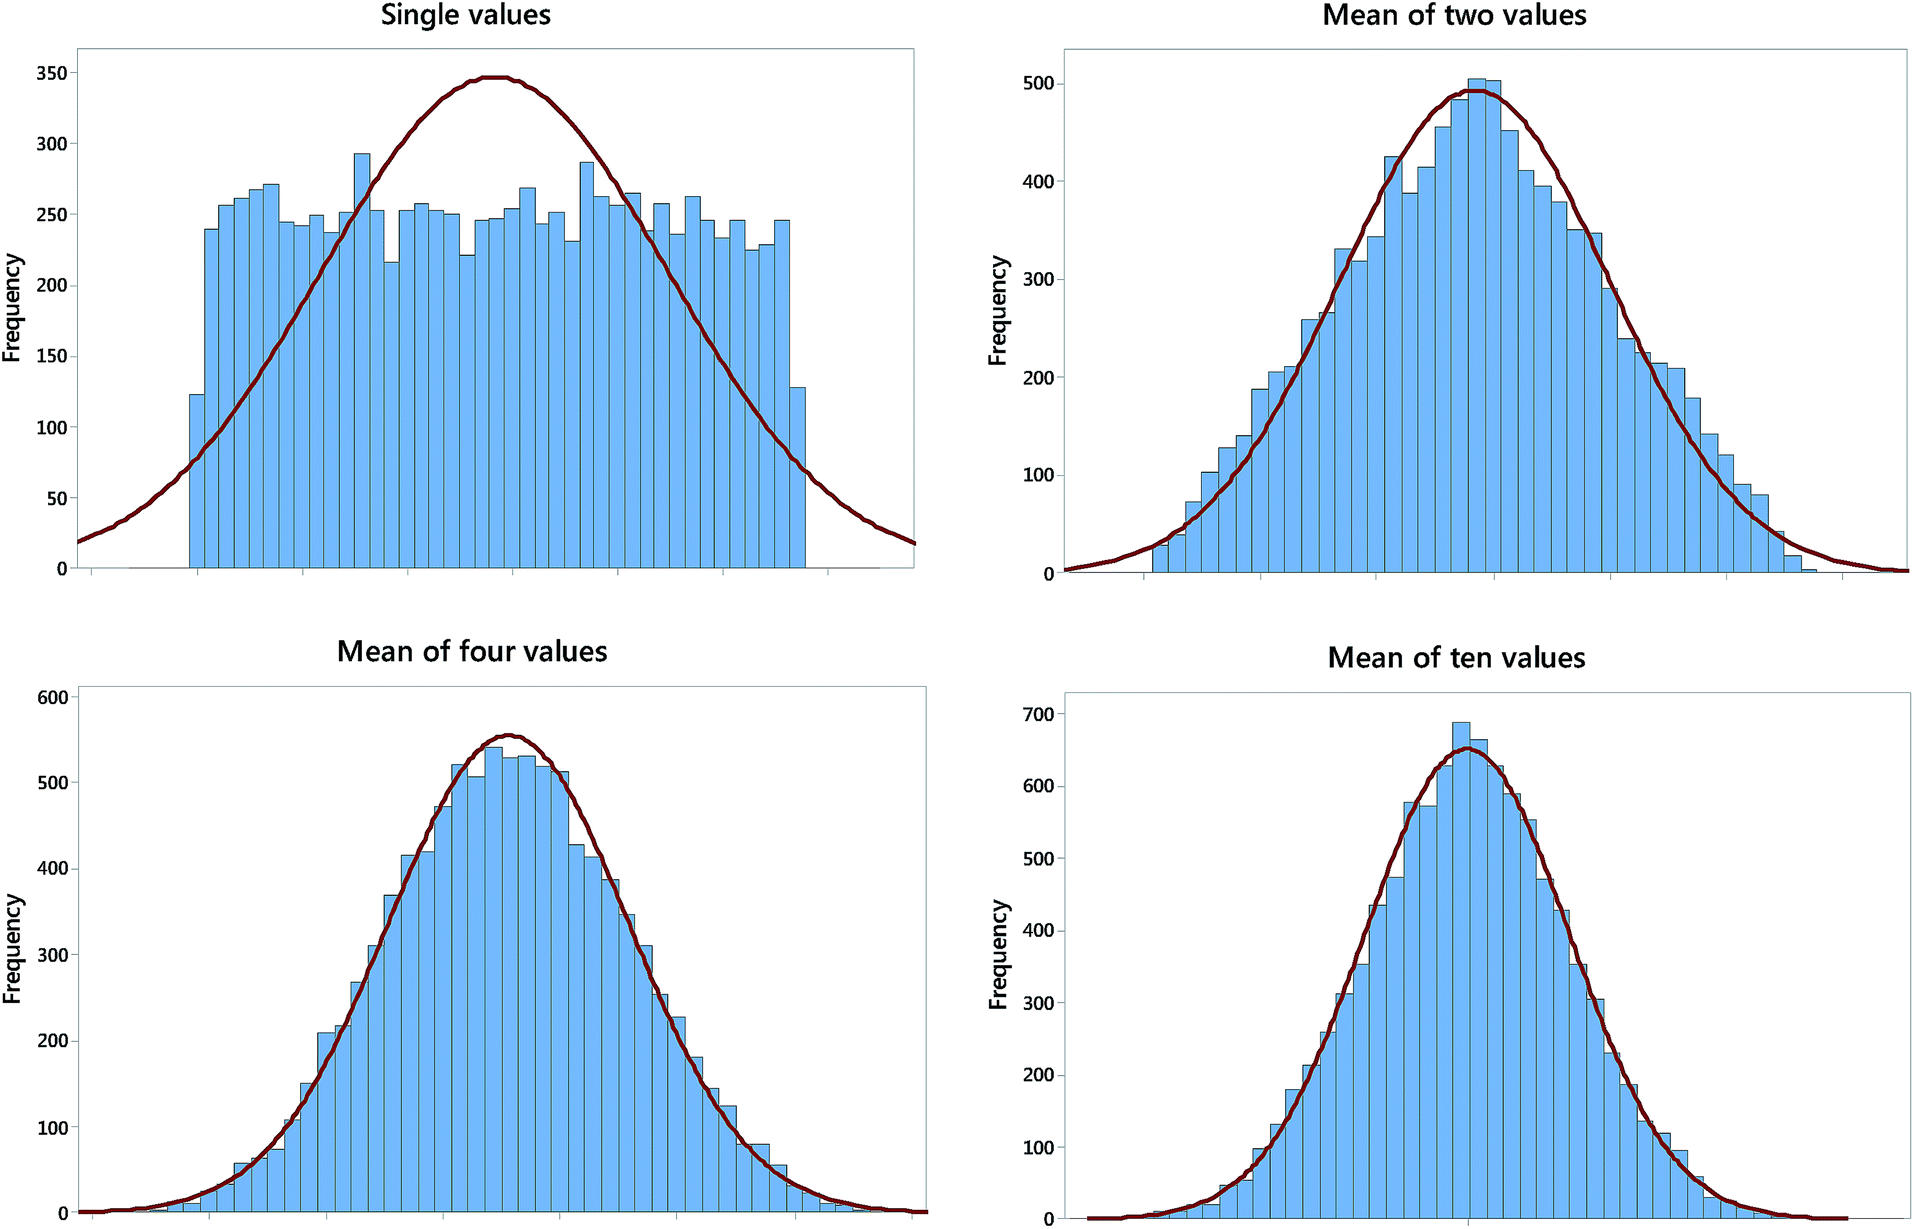 | ||
| Fig. 1 Histograms of means of random samples from a uniform distribution, each scaled to a normal distribution (red line) with the same parameters. The distribution of single values reflects the parent uniform distribution, but the means of n = 2, 4 and 10 individual values are progressively closer to the normal distribution. | ||
Significance tests for normality
Despite the assurances provided by the CLT there are many occasions when it is desirable to test to see whether data sets might be normally distributed. Important examples include the testing of residuals found in regression and analysis of variance (ANOVA) calculations. If the residuals derived from a regression plot are not randomly and normally distributed, the model used (e.g., linear, quadratic) is probably inappropriate. In ANOVA the calculated probability values rely on the assumption that the random errors reflected in the residuals are normally distributed.Several established methods for testing for normality are available in many software packages. A simple approach is the use of normal probability paper, in which the individual measurements are plotted against their cumulative frequencies, the latter being on a non-linear scale derived from the percentage points of the normal distribution. Normally distributed data should yield a straight line plot: the Ryan-Joiner (RJ) test provides a correlation coefficient to evaluate the linearity. Fig. 2 shows a normal probability plot for a set of 8 measurements: the points lie on a curve, hinting at a departure from normality, but the RJ correlation coefficient is high enough to provide a p-value greater than 0.05, so we cannot reject the hypothesis that the data come from a normal population. The Kolmogorov–Smirnov method (which gives a similar conclusion for the Fig. 2 data) compares plots of the cumulative distribution function of the experimental data and the distribution expected of normal data: if the distance between the two curves is too great the null hypothesis of normally distributed data is rejected. Recently the main test methods used have been the Shapiro–Wilk test (another correlation-based method) and the Anderson–Darling test, the latter being a modification of the Kolmogorov–Smirnov approach with extra weight being given to the tails of the distribution. Monte Carlo simulations show the Shapiro–Wilk test to be marginally the most useful for testing for the normal distribution, having the best power for a given significance level. Excel® add-ins to perform it have been produced. The test statistic, W, is given by:

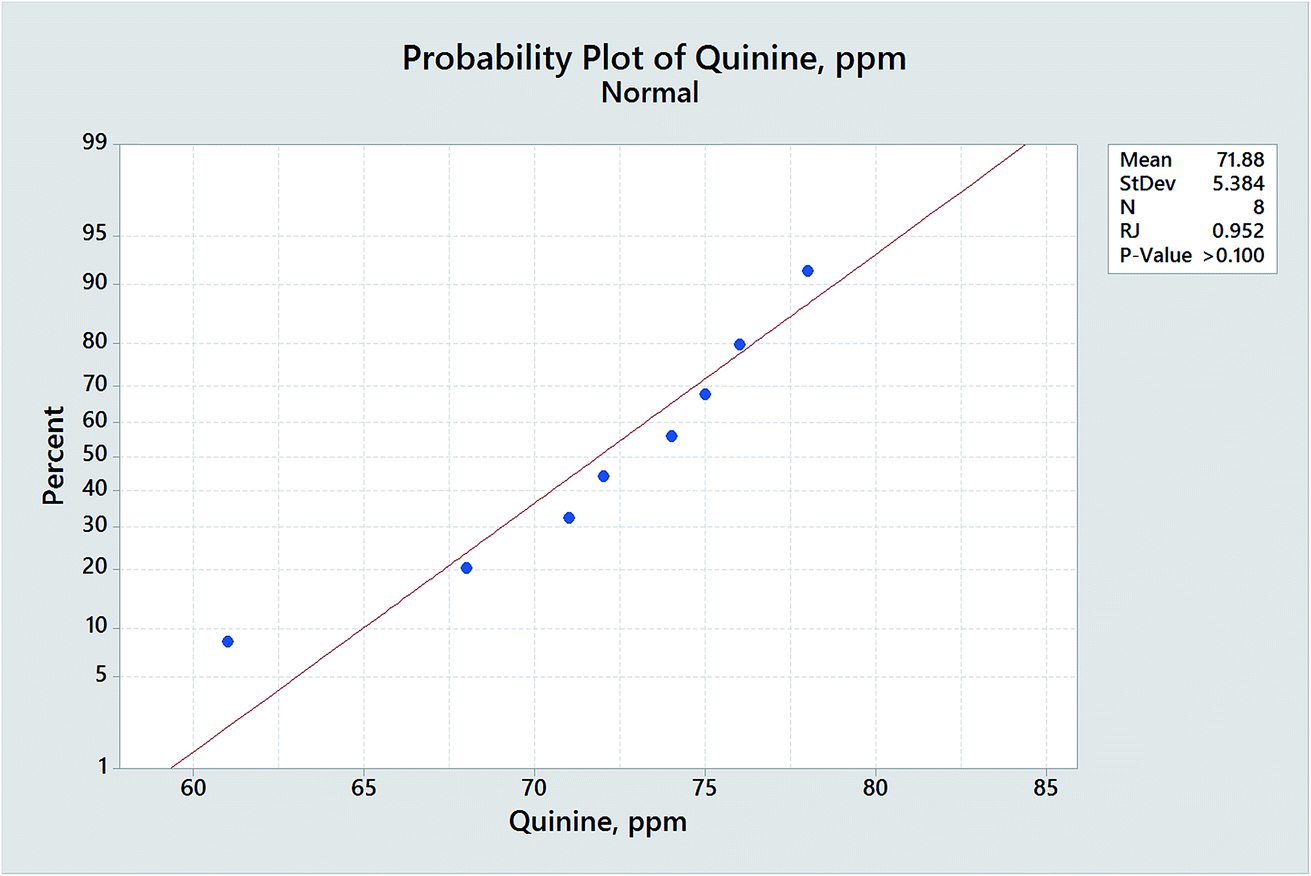 | ||
| Fig. 2 Normal probability plot (Minitab®) for 8 measurements of the quinine level (ppm) in different batches of tonic water. | ||
In this equation the xi values are the individual measurements, with mean ![[x with combining macron]](https://www.rsc.org/images/entities/i_char_0078_0304.gif) , and the x(i) values are the ordered measurements, with x(1) the smallest, x(2) the next smallest, and so on. The constants ai are derived from the properties of the standard normal distribution and can be obtained from published tables. Small values of W are a sign of departures from normality, so the null hypothesis is rejected if the test statistic is less than the tabulated critical value. The Shapiro–Wilk test has been used with success with quite small data samples (though it is less effective if the data contain ties, i.e., equal measurements): when applied to the data in Fig. 2 it shows that the probability that they could come from a normal population is much greater than 0.05. Again it is clear that when we use only a few measurements any departures from normality would have to be quite gross before this or other tests could reject the null hypothesis of a normal distribution. It is for this reason that the central limit theorem provides such inestimable comfort!
, and the x(i) values are the ordered measurements, with x(1) the smallest, x(2) the next smallest, and so on. The constants ai are derived from the properties of the standard normal distribution and can be obtained from published tables. Small values of W are a sign of departures from normality, so the null hypothesis is rejected if the test statistic is less than the tabulated critical value. The Shapiro–Wilk test has been used with success with quite small data samples (though it is less effective if the data contain ties, i.e., equal measurements): when applied to the data in Fig. 2 it shows that the probability that they could come from a normal population is much greater than 0.05. Again it is clear that when we use only a few measurements any departures from normality would have to be quite gross before this or other tests could reject the null hypothesis of a normal distribution. It is for this reason that the central limit theorem provides such inestimable comfort!
Further reading
A clear treatment of methods of testing for the normal distribution is provided in Practical Statistics for Medical Research, D. G.Altman, Chapman and Hall, 1991.An example of a Shapiro–Wilk calculation using Excel® is provided at http://www.real-statistics.com. Downloaded February 2nd 2017.
James N. Miller
This Technical Brief was prepared for the Statistical Subcommittee and approved by the Analytical Methods Committee on 11/07/17.

| This journal is © The Royal Society of Chemistry 2017 |