
 Open Access Article
 This Open Access Article is licensed under a Creative Commons Attribution-Non Commercial 3.0 Unported Licence
Effects of mid-respiratory chain inhibition on mitochondrial function in vitro and in vivo†
Ashley J.
Broom
ad,
Jeffrey
Ambroso
b,
Gino
Brunori
a,
Angie K.
Burns
a,
James R.
Armitage
a,
Ian
Francis
a,
Mitul
Gandhi
a,
Richard A.
Peterson
b,
Timothy W.
Gant
c,
Alan R.
Boobis
d and
Jonathan J.
Lyon
*a
aGlaxoSmithKline, Safety Assessment, Ware, SG12 0DP, UK. E-mail: Jon.lyon@gsk.com; Tel: +44 (0) 1992502345
bGlaxoSmithKline, Safety Assessment, Research Triangle Park, North Carolina, USA
cPublic Health England, Harwell Science and Innovation Campus, Oxfordshire, OX11 0RQ, UK
dImperial College London, Hammersmith Campus, London, W12 0NN, UK
First published on 17th September 2015
Abstract
Relating the in vitro mitochondrial effects of drug candidates to likely in vivo outcomes remains challenging. Better understanding of this relationship, alongside improved methods to assess mitochondrial dysfunction in vivo, would both guide safer drug candidate selection and better support discovery programmes targeting mitochondria for pharmacological intervention. The aim of this study was to profile the in vivo effects of a compound with suspected complex III electron transport chain (ETC) inhibitory activity (GSK932121A) at doses associated with clinical signs, and relate findings back to in vitro data with the same compound. Control liver mitochondria or HepG2 cells were treated in vitro with GSK932121A to assess mitochondrial effects on both calcium retention capacity (CRC) and oxygen consumption rate (OCR) respectively. The same assessments were then performed on liver mitochondria isolated from Crl:CD(SD) rats, 5 hours following intraperitoneal (IP) administration of GSK932121A. Lactate/pyruvate assessment, hepatic microscopy, blood gas analysis, glutathione profiling and transcriptomics were used to characterise the acute toxicity. In vivo, GSK932121A caused hypothermia, increased levels of hepatocellular oxidative stress and a metabolic shift in energy production, resulting in an increased lactate/pyruvate ratio, liver steatosis and glycogen depletion, together with gene expression changes indicative of a fasted state. As would be expected of an ETC inhibitor, GSK932121A reduced the CRC of liver mitochondria isolated from naive control animals and the OCR of HepG2 cells when treated directly in vitro. In contrast, mitochondria isolated from animals treated with GSK932121A in vivo unexpectedly showed an increase in CRC and basal OCR. Whilst seemingly contradictory, these differences likely reflect an adapted state in vivo resulting from the initial insult in combination with compensatory changes made by the tissue to maintain energy production. Only the initial, unconfounded, response is observable in vitro. These findings improve current understanding of the toxicological and molecular consequences of ETC inhibition. Furthermore, this work highlights key differences in the way that mitochondrial perturbation is manifest in vivo versus in vitro in terms of functional endpoints and helps guide endpoint selection for future studies with potential mitochondrial toxicants or drugs designed to modulate mitochondrial function for therapeutic benefit.
Background
The withdrawal of a number of marketed drugs, due in part to deleterious effects on mitochondrial function (such as cerivistatin and nefazodone), has led to increased emphasis on discharging mitochondrial liability early in the drug development process.1,2 The potent effects of many of these compounds underscore the potential risks associated with drugs causing mitochondrial toxicity. Despite this, many of the aforementioned drugs had excellent therapeutic benefits and mitochondria are increasingly seen as attractive targets for pharmacological intervention i.e. for the treatment of metabolic diseases, neurodegenerative disorders and cancer. It is clear therefore that drug-induced modulation of mitochondrial function should not be a pre-requisite for drug-termination. Rather, methods to improve the risk assessment of mitochondrial-acting drugs in vivo require attention.3Compounds are known to initiate mitochondrial toxicity via many different mechanisms which have been reviewed in ref. 4–6. Manifestations of clinical mitochondrial toxicity are usually centred around organs with the highest metabolic activity such as the liver, heart, muscle and central nervous system, although at variable concentrations and with varying degrees of specificity and severity.7 This is not surprising given the cellular differences in mitochondrial activity, morphology and distribution; but does suggest that the toxicity profile of a mitochondrial agent may differ significantly according to drug distribution and target organ characteristics.8 This complex multi-organ, multi-mechanism and multi-phenotype nature of mitochondrial toxicity makes risk assessment of compounds known to have some in vitro mitochondrial activity challenging. Furthermore, it has been postulated that mitochondria contain an underlying reserve capacity, which confers the ability to adapt to a certain level of direct or indirect metabolic stress.9 This further complicates our understanding of how mitochondrial perturbation in vivo causes clinical toxicity, what level of mitochondrial dysfunction is required to trigger toxicity and how it will manifest.
Whilst the past few years has witnessed advances in the development and integration of in vitro assays to aid pre-clinical screening of agents for mitochondrial effects, efforts to correlate these data with in vivo outcomes are limited.10In vitro/in vivo correlative challenges currently include, (a) the steep dose response often exhibited by mitochondrial toxicants, (b) the lack of suitable biomarkers of mitochondrial toxicity, (c) the apparent insensitivity of the animals used in standard pre-clinical safety testing and, (d) the diversity of drug classes and chemical-structures showing mitochondrial effects, complicating the task of building predictive SAR tools.11
GSK932121A was developed as a 4(1H)-pyridone antimalarial drug and is a potent inhibitor of the mitochondrial respiratory chain complex III in Plasmodium falciparum (cytochrome bc1 IC50 = 0.007 μM). The molecule inhibits the same target in mammalian species but with lower potency (two orders of magnitude less potent on the isolated protein target from rats and three orders of magnitude less potent in intact rodent cells). Despite this difference in potency, GSK932121A was withdrawn from development at the first time in human stage due to unexpected toxicology findings in rats, when dosed via the intraperitoneal (IP) route or orally as a pro-drug to increase exposure. Cross-over inhibition of mammalian complex III activity by a GSK932121A was considered to be a possibility.12
A package of investigative work was initiated to follow up on the toxicological findings. The work presented here describes initial aspects of this investigative programme whereby the conditions known to cause the acute toxicity were recreated in order to study the nature of the toxic response. As such, the work present aimed to; (a) profile the acute effects of GSK932121A in vivo, based on the presumption that the observed clinical signs in rat were due to complex III inhibition, via measurement of mitochondrial function, liver glutathione levels, hepatic microscopy, blood gasses and lactate/pyruvate ratio alongside gene expression profiling; and (b) analyse the effects of GSK932121A in vitro by treatment of isolated mitochondria from control animals and cultured cell lines to add further mechanistic detail and to allow comparison with the in vivo data.
The analyses presented here provide additional weight of evidence that the main mechanism of toxicity with GSK932121A was mitochondrial complex inhibition and provides significant detail regarding the profile of downstream effects of such inhibition, including molecular adaptive changes. This comprehensive comparison of multiple endpoints also allows for better informed selection of endpoints for future mechanistic investigate studies where mitochondrial toxicity or therapeutic mitochondrial modulation is suspected and highlights the need to consider both in vitro and in vivo data together when interpreting mitochondrial effects. Finally, the data presented is of significant value in developing an Adverse Outcome Pathway (AOP) for mitochondrial ETC inhibition, and follow-up studies at earlier time points and at lower doses are underway to add even greater detail in this regard.
Results
Clinical signs
Following IP administration of GSK932121A, significant inter-animal variability was noted in terms of both the severity and speed of onset of clinical signs. Moderate clinical signs were observed approximately 3–5 hours post dose and included slight to moderate piloerection, hunched posture, slightly irregular or deep abdominal breathing and mildly subdued behaviour. Reduction in body temperature was noted in some animals approximately 1.5 h post dose with body temperature continuing to fall by an average of 3.4 °C by 5 hours post dose. The reduction in body temperature over the course of the study was highly variable but was correlated closely with the plasma concentration of GSK932121A (R2: 0.9063) (Fig. 2). No body temperature reduction was observed in two females throughout the course of the treatment period but in these animals the terminal plasma concentrations of GSK932121A were low (284 ng mL−1 and 485 ng mL−1, respectively). These animals were excluded from all further analyses. Reduction in body temperature also correlated with adverse clinical signs, with those animals with the greatest fall in body temperature showing the most severe clinical effects. | ||
| Fig. 1 Chemical structure of GSK932121A (Mw: 425.786). This pyridone molecule was designed for the treatment of the Plasmodium falciparum malaria infection. GSK932121A was withdrawn from clinical trials due to a potentially narrow therapeutic index. | ||
 | ||
| Fig. 2 Relationship between core body temperature and plasma GSK932121A concentration. The correlation is shown between reduction in body temperature observed at 5 hours post treatment with GSK932121A (50 mg kg−1) and plasma drug concentration (R2 = 0.9063, p < 0.001). Two animals (circled) showed little reduction in body temperature but also had a very low plasma concentration (284–485 ng mL−1) to GSK932121A. These animals were excluded from all further analyses. | ||
Arterial blood gas (pO2 and pCO2) and Bicarbonate (HCO3)
GSK932121A at a dose of 50 mg kg−1 produced a significant increase in pO2 and a significant decrease in pCO2 in arterial whole blood at approximately 5 hours post-dose (Fig. 3). These findings are suggestive of impaired mitochondrial respiration in GSK932121A treated animals consistent with the mode of action (ETC inhibition). Bicarbonate (HCO3) was also reduced in GSK932121A treated rats compared to vehicle control (Fig. 3) suggesting metabolic acidosis which is likely caused by increases in blood lactate concentration (Fig. 5E).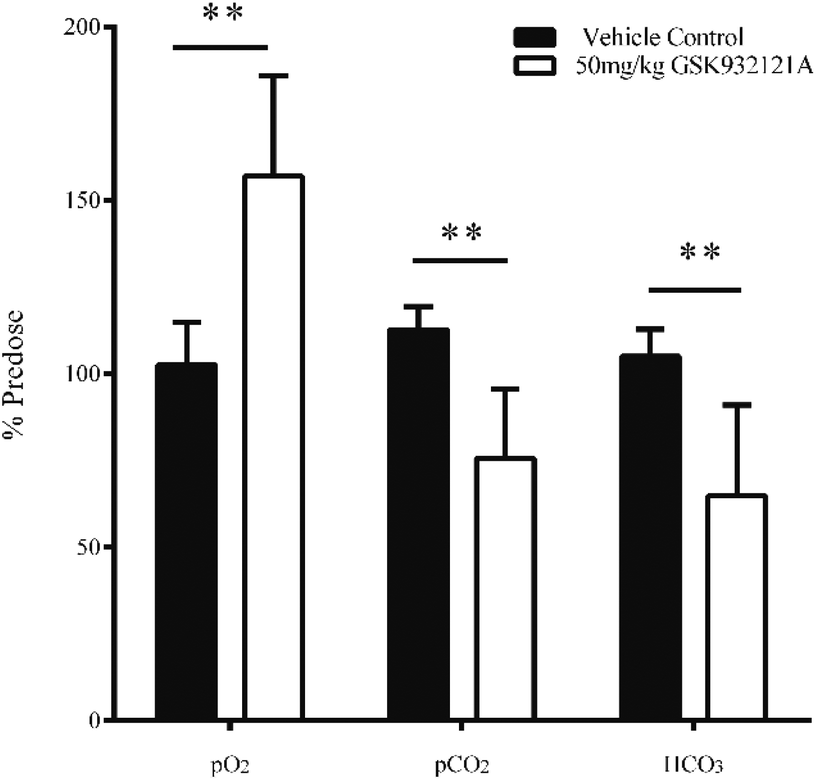 | ||
| Fig. 3 Analysis of arterial blood gasses (pO2 and pCO2) and bicarbonate (HCO3) in whole blood of animals treated with GSK932121A (50 mg kg−1). GSK932121A (50 mg kg−1 – open bars) caused a significant reduction in arterial pCO2 and HCO3 at 5 hours post-dose compared with vehicle controls (solid bars). A significant increase in arterial pO2 was also observed in GSK932121A treated animals which is suggestive and characteristic of respiratory chain inhibition. Results are mean ± sd (n = 6) ** p < 0.01. | ||
Ratio of reduced glutathione (GSH) to oxidised glutathione (GSSG)
GSK932121A, at a dose of 50 mg kg−1 caused a statistically significant, 53.7% reduction in the GSH![[thin space (1/6-em)]](https://www.rsc.org/images/entities/char_2009.gif) :GSSG ratio in liver tissue at a terminal 5 hour time-point compared to vehicle control animals (p < 0.001) (Fig. 4C). The reduced GSH:GSSG ratio manifest due to a significant reduction in reduced GSH compared to vehicle control animals (p < 0.05, Fig. 4A) and a significant increase in oxidised GSSG in the liver of treated animals compared to vehicle control (p < 0.001, Fig. 4B). This data suggests that treatment of rats with 50 mg kg−1 GSK932121A for 5 hours causes increased levels of oxidative stress and a resulting reduction in the glutathione antioxidant system in the liver, compared with time matched vehicle controls.
:GSSG ratio in liver tissue at a terminal 5 hour time-point compared to vehicle control animals (p < 0.001) (Fig. 4C). The reduced GSH:GSSG ratio manifest due to a significant reduction in reduced GSH compared to vehicle control animals (p < 0.05, Fig. 4A) and a significant increase in oxidised GSSG in the liver of treated animals compared to vehicle control (p < 0.001, Fig. 4B). This data suggests that treatment of rats with 50 mg kg−1 GSK932121A for 5 hours causes increased levels of oxidative stress and a resulting reduction in the glutathione antioxidant system in the liver, compared with time matched vehicle controls.
 | ||
| Fig. 4 Analysis of liver GSH, GSSG and GSH:GSSG ratio following treatment of rats with 50 mg kg−1 GSK932121A compared to vehicle control. GSK932121A (50 mg kg−1 – open bars, n = 10) caused a significant reduction in GSH (panel A), a significant increase in GSSG (panel B) and a significant reduction in GSH:GSSG ratio (panel C) in the liver, compared with vehicle controls (0 mg kg−1 – solid bars, n = 12). Results are mean ± sd. * p < 0.05, ** p < 0.01, *** p < 0.001. | ||
The metabolic shift: lactate/pyruvate and LM/TEM
Key histological alterations following exposure to GSK932121A in vivo were identified in liver by light microscopy (LM) (Fig. 5A and B). Hepatocellular changes included an increase in periportal lipid (microvesicular steatosis) highlighted by prominent osmium tetroxide staining in the livers of the treated group. This is suggestive of reduced fatty acid metabolism within the liver. | ||
| Fig. 5 The metabolic switch following treatment of rats with GSK932121A. Panels A + B (200× magnification) show H&E stained liver sections post-fixed in osmium tetroxide. (A) Vehicle control rat, note the rare hepatocytes that contain a small number of osmium tetroxide-stained lipid droplets (black arrow depicted). (B) Rat treated with 50 mg kg−1 GSK932121A; note that the cytoplasmic droplets within hepatocytes are extensively and darkly stained with osmium tetroxide which confirms the accumulation of neutral lipid. Panels C + D show electron micrographs of rat hepatocytes from the right lateral lobe focussed on the mitochondria at 50000× magnification (images shown are taken from peri-portal regions of the liver). (C) Mitochondria from vehicle control animal, with intact membrane structure and normal histology. Stores of glycogen are depicted by red arrows. (D) Mitochondria from GSK932121A treated animal which appear swollen with pale matrices and a significant increase in the number of condensed degenerative mitochondria were observed (white stars). Glycogen stores (highlighted by arrows in C) were reduced in animals treated with GSK932121A. (E) GSK932121A treatment (n = 10, open bar) causes an increased blood lactate/pyruvate ratio compared to vehicle control (n = 12, closed bar). Data shown is mean ± sd. (F) Correlation between terminal plasma GSK932121A concentration in treated rats and the copy number of four hepatic gluconeogenic response genes, Foxo1 (blue crosses) (R2: 0.7943), Pdk4 (red squares) (R2: 0.7389), Ppargc1a (green circles) (R2: 0.6587) and Irs2 (black triangles) (R2: 0.5457). The expression of all four genes was significantly increased compared to control (p < 0.001). ** p < 0.01. | ||
TEM was utilised in order to assess the effect of GSK932121A treatment on hepatocyte ultrastructure. Under TEM, a proportion of the hepatocyte mitochondria appeared swollen with pale matrices and moderate to severe disorganisation of the cristae. Mitochondrial diameter increased from approximately 0.45 μm to 0.55 μm on average (Fig. 5C and D) alongside a significant increase in the number of condensed mitochondria, which were frequently observed within phagosomes. Further to the increase in lipid observed via LM analyses, a reduction in glycogen stores was evident in GSK932121A treated hepatocytes by TEM (peri-portal region).
To confirm the suspected metabolic shift circulating lactate and pyruvate levels were measured in a retained whole blood sample. Animals given 50 mg kg−1 GSK932121A had higher blood lactate concentrations than controls (3.53-fold, p < 0.001) and the lactate/pyruvate ratio was increased by 1.66-fold (p < 0.01) (Fig. 5E). Elevated lactate/pyruvate ratios are indicative of deficiencies of the respiratory chain, tricarboxylic cycle or pyruvate metabolism.
Affymetrix transcriptomics
Transcriptomic analysis was performed on liver samples from control and GSK932121A treated rats. Differentially expressed genes were subjected to Ingenuity Pathway Analysis (IPA – Ingenuity Systems, Redwood City, CA). This analysis identified perturbation of pathways associated with the cellular response to glycogen depletion, with glucocorticoid receptor signalling the most significantly up-regulated. Other pathways identified were immunological (IL10, IL6 and acute phase response signalling) and activation of retinoic acid receptor responsive genes. Consideration of these data alongside the increase in blood lactate and observed depletion of cellular glycogen (TEM micrographs) prompted further analysis of individual genes involved in the cellular response to glycogen depletion in the liver samples collected from treated and control animals. Peroxisome proliferator-activated receptor gamma coactivator 1-alpha (Ppargc1a, PGC1α) was upregulated 8.2-fold (p < 0.001) and Forkhead box protein O1 (Foxo1) expression increased 1.6-fold. PGC1α and Foxo1 interact to coordinate the expression of genes involved in gluconeogenesis, such as Pepck (1.9-fold; p < 0.001, encoded by Pck1) and glucose-6-phosphatase. PGC1α and Foxo1 expression levels both correlated well with GSK932121A plasma concentrations (R2: 0.6587 and 0.7493 respectively) (Fig. 5F). Insulin Receptor Substrate 2 (Irs2) and Pyruvate Dehydrogenase Kinase 4 (Pdk4), which are also co-ordinately regulated by Foxo1, were upregulated 4.8 and 2.2-fold respectively and also correlated well with GSK932121A plasma levels (Fig. 5F). All Affymetrix gene expression data has been deposited in NCBI's Gene Expression Omnibus (GEO) and is accessible through GEO series accession number GSE65374.Calcium retention capacity
CRC is calculated as the difference in optical density (OD) between the point at which mitochondria are energised and begin to take up a given bolus of calcium, and the point of undergoing mitochondrial permeability transition (i.e. lowest OD prior to undergoing permeability transition) and releasing calcium back into the test buffer, thus increasing OD once more. When tested in vitro, i.e. by direct in vitro treatment of fresh mitochondria isolated from the liver of naive rats, GSK932121A (100 μM to 1 μM) reduced the CRC in a concentration dependent manner with an IC50 of 1.36 μM (Fig. 6). In direct contrast to the effects observed in vitro, the CRC of liver mitochondria isolated from rats treated in vivo with 50 mg kg−1 GSK932121A was increased, (Fig. 7A, for clarity mean kinetic data is shown). When calculated as delta-OD, the increase in liver mitochondria CRC following GSK932121A treatment (n = 10) was 79% (p < 0.01) compared with mitochondria from control animals (n = 12), (Fig. 7B). These data demonstrate a desensitisation to calcium-induced mitochondrial permeability transition pore opening following in vivo treatment with GSK932121A. | ||
| Fig. 6 Analysis of liver mitochondrial CRC following in vitro treatment of control liver mitochondria with GSK932121A. (A) Representative CRC recording demonstrating the reduction in CRC of control isolated liver mitochondria following in vitro treatment with 100 μM and 10 μM GSK932121A. (B) Freshly isolated liver mitochondria from female control Crl:CD (SD) rats (n = 3) were treated in vitro with GSK932121A. A significant reduction in CRC was observed following treatment with 100 μM, 10 μM, and 1 μM GSK932121A (IC50: 1.36 μM, R2: 0.9031) (p < 0.05). Data shown is mean ± sd. | ||
 | ||
| Fig. 7 Analysis of liver mitochondrial CRC following treatment of rats with GSK932121A in vivo. (A) Mitochondria isolated from rats treated with 50 mg kg−1 GSK932121A (open circles) displayed an increased CRC compared to control animals (squares) treated with vehicle alone. Data shown in this kinetic trace are mean only (variability shown in Fig. 5.B). (B) The increase in GSK932121A-induced CRC is displayed as increase in ΔOD (difference in optical density between point of succinate substrate addition and mitochondria undergoing permeability transition, i.e. lowest OD value before calcium release). Data shown is mean ± sd. ** p < 0.01. | ||
Mitochondrial bioenergetics
Exposure of HepG2 cells to GSK932121A in vitro (n = 3) resulted in decreases in key bioenergetic parameters, demonstrated using a mitochondrial stress test (Fig. 8A). The response observed was typical of what would be expected with a mid-respiratory chain inhibitor, i.e. reducing the amount of molecular oxygen consumed at mitochondrial complex IV via inhibition of the upstream ETC. Specifically, significant and concentration-dependent reductions in basal respiration and ATP-synthase linked respiration (concentrations of 7.5 μM and above) were observed alongside a reduction in maximal respiration (concentrations of 0.75 μM and above) following GSK932121A treatment of the cells in vitro (Fig. 8B). OCR parameters are calculated as described in the ESI data of ref. 13. Concentrations of GSK932121A were chosen to match plasma drug concentrations achieved in vivo (up to ∼75 μM). | ||
| Fig. 8 Analysis of HepG2 mitochondrial OCR following acute in vitro treatment with GSK932121A (measured using Seahorse XFe96 analyser). HepG2 cells were treated in vitro with GSK932121A (0.075 μM–75 μM, 15 technical replicates per plate) and basal OCR was assessed. A mitochondrial stress test was then performed in order to assess the effect of GSK932121A on key bioenergetic parameters (n = 3). (A) A representative graph of OCR outputs from the XFe96 analyser of DMSO control (blue line) and GSK932121A treated (various colours, 0.075 μM–75 μM) and the response to oligomycin, FCCP and antimycin A/rotenone (A/R). (B) GSK932121A caused a statistically significant reduction in basal respiration and ATP-linked respiration (concentrations of 7.5 μM–75 μM). A significant reduction in maximal respiration was also observed following GSK932121A treatment (0.75 μM–75 μM). The observed reductions were generally in a concentration-dependent manner. OCR parameters were calculated as described in ref. 13 – ESI. Data shown is mean ± sd (n = 3), mid-point OCR. Significance stars depict reduction in OCR compared to DMSO control * p < 0.05, ** p < 0.01, *** p < 0.001. | ||
In contrast to the effects seen in HepG2 cells, mitochondria isolated from the livers of rats treated in vivo with GSK932121A, showed an increase in basal respiration of 30.3% compared to vehicle control (p < 0.001) (Fig. 9A and B). A similar degree of increased respiratory demand is maintained throughout state 3 (27.5%, p < 0.01) and state 4 (28.4%, p < 0.001), demonstrating increased background levels of oxygen consumption linked to ATP production (Fig. 9A and B). This increase in oxygen consumption further coincides with an 11.9% (p < 0.001) increase in proton leak across the inner mitochondrial membrane. Whilst increased proton leak is suggestive of a decline in efficiency of the OXPHOS machinery, the percentage of total OCR linked to ATP synthesis is the same between control and treated mitochondria after normalisation to basal respiration (Fig. 9C). Furthermore the respiratory control ratio (state 3/state 4 ratio), often used as a gold-standard measure of general mitochondrial health/coupling, was not significantly altered between mitochondria isolated from vehicle control (4.25) and GSK932121A treated (4.20) rats (p > 0.05 – data not shown). FCCP was used to uncouple mitochondria and determine the maximum respiration rate (often termed the maximal uncoupled or state 3u respiration). This was reduced by 24.7% in mitochondria isolated from GSK932121A treated rats (p < 0.001) indicating a diminished maximal capacity of the ETC in the uncoupled state. This is particularly visible in Fig. 9C where normalisation of data to basal respiration highlights the maximal OCR deficit following FCCP-induced uncoupling. Importantly, this difference does not simply reflect differences between isolated mitochondria and cells since, with regard to oxygen consumption, isolated mitochondria from naive animals responded to GSK932121A treatment in the same manner (ESI1†).
 | ||
| Fig. 9 Analysis of liver mitochondrial bioenergetics using the Seahorse XF24 analyser following treatment of rats with GSK932121A in vivo. (A) Representative OCR data for liver mitochondria isolated from animals treated with GSK932121A (broken line) or vehicle control (solid line). (B) Effect of GSK932121A treatment (open bars) on basal, state 3, state 4o, state 3u respiration and on proton leak, compared with vehicle controls (solid bars). (C) Normalisation of OCR data to basal respiration, demonstrating the lack of significant change in total ATP linked OCR (shaded box) between mitochondria isolated from control (solid line) and treated (broken line) animals and the reduction in maximal uncoupled respiration. Data shown is mean ± sd (n = 12 control, n = 10 GSK932121A treated) of the mid-point OCR. Each biological replicate is the mean of 5 technical replicate wells/XF24 plate ** p < 0.01, *** p < 0.001. | ||
Discussion
It is important for successful drug development that we improve our understanding of how mitochondrial toxicity is manifest in our preclinical test species. To this end, and as part of a mechanistic toxicology investigation, the present study profiled the acute toxicity caused by a candidate molecule (GSK932121A), suspected of causing acute toxicity by complex III inhibition in vivo. The work highlighted the utility of a multi-system approach for detecting mitochondrial dysfunction in vivo, and should aid other investigators in designing studies and selecting endpoints for future studies with mitochondrially active molecules. The liver was a key target organ in the toxic response to GSK932121A in vivo and to allow for a range of assessments, the whole organ was used, accepting that drug exposure levels might vary between liver regions. Upon refinement to a more targeted set of endpoints, tissue sampling from a single lobe may be possible and analysis of drug concentration across the liver regions could be carried out.GSK932121A is a potent inhibitor of the mitochondrial respiratory chain complex III in the target species, P. falciparum. It is two orders of magnitude less potent on the isolated target from rats, and three orders of magnitude less potent in intact rodent cells.12 At the dose of GSK932121A used in the present study, the plasma concentrations achieved were 2–6 times above the IC50 in rodent cells and, consistent with this, was acutely toxic. Blood gas analysis in the present study confirmed inhibition of respiratory function highlighted by an increase in the levels of arterial O2 and a reduction in arterial CO2. Despite increased levels of plasma oxygen, it is likely that the rats treated with GSK932121A in vivo are in a state of cytotoxic hypoxia, characterised by effective oxygen deprivation (i.e. inability of cells to utilise oxygen as opposed to impaired oxygen availability). This has been highlighted as central cause of toxicity relating to other respiratory chain inhibitors.14
Body temperature changes have been reported with a range of mitochondrial toxins acting by different mechanisms, for example, 2,4-dinitrophenol (mitochondrial uncoupling) causes hyperthermia15 and 3-nitroproprionic acid (complex II inhibition) causes hypothermia.16 In the present study, the magnitude of hypothermia correlated well with plasma levels of the drug, suggesting that respiratory chain inhibition was the primary cause of the reduced thermal energy generation. Of the gross in-life measures, body temperature appeared to be the most sensitive marker of mitochondrial impairment, at least when monitored internally (core temperature) and measured regularly (15 minute intervals) via the implanted chips used in this study. The liver is a major thermoregulatory organ in the rat17 and therefore the reduction in body temperature may be directly associated with disruption of mitochondrial function and morphology changes noted in this organ. The value of monitoring body temperature demonstrated here, combined with the ease of data collection when using implantable chips (which are primarily used for animal identification), means that this endpoint would be suitable for consideration in all in vivo studies with compounds suspected of having mitochondrial activity.
Lactic acidosis and an increase in hepatic lipid (steatosis) are common outcomes of mitochondrial dysfunction,18 as observed with the early nucleoside reverse transcriptase inhibitors.19 The increase in lactate/pyruvate ratio observed here suggests an increase in glycolytic metabolism and this is supported by the TEM evidence of glycogen depletion in the liver of treated rats. Furthermore, the blood gas data was also suggestive of metabolic acidosis, with a reduction in bicarbonate noted. Combined with body temperature, lactate levels are a potentially useful marker of drug induced mitochondrial toxicity20 and it has been suggested that a rise in blood lactate concentrations alongside a reduction in core body temperature may be indicative of a generalised adverse event.21 Further studies with GSK932121A at sub-toxic doses are ongoing and it will be interesting to see if lactate/pyruvate ratio can be utilised as a marker of more mild underlying mitochondrial perturbation.
Interestingly, the switch in metabolism towards glycolysis, indicated by ultrastructural changes and blood lactate levels, was also reflected in the gene expression findings. Foxo1, up-regulated following GSK932121A treatment, has been shown to play a central role in the response to glycogen depletion via activation of gluconeogenesis.22 Foxo1 interacts with PGC1α to regulate the expression of gluconeogenic genes by binding and activating promoter regions, for example, the PGC1α-dependent transcription of Pepck.23 Pepck catalyses the first committed step in gluconeogenesis via conversion of oxaloacetate to phosphoenolpyruvate.24 Foxo1 is also essential to the up-regulation of Pdk4 and Irs2 in response to glycogen depletion and fasting and these were up-regulated in the present study.22 This fasted/starvation-like transcriptional response has previously been associated with respiratory chain deficiency and mitochondrial myopathy.25 These gene findings demonstrate a potentially adaptive response to reduced liver glycogen by activation of gluconeogenesis via Foxo1 mediated transcription.
With regard to the functional mitochondrial endpoints, specifically OCR and CRC in this study, GSK932121A had effects both in vivo and in vitro, however the direction of change was not consistent. It is unlikely that this difference is due to a metabolite of GSK932121A since it is known that there is limited metabolism of the compound within the timescale applicable here. In vitro, GSK932121A reduced basal mitochondrial OCR in galactose-conditioned HepG2 cells, entirely consistent with its proposed complex III inhibitory activity and data with other known respiratory chain inhibitors.26,27 Culturing the HepG2 cells in a galactose (rather than glucose) based media increases the cells reliance on OXPHOS for ATP generation improving the metabolic similarity to the in vivo situation and this was reflected by the compound toxicity observed. Isolated liver mitochondria from naïve control rats directly exposed to GSK932121A showed similar changes to the HepG2 cells (ESI1†). In contrast, the opposite was true with liver mitochondria isolated from rats treated with GSK932121A in vivo, where basal OCR was seen to be increased. In the same vein, the CRC of isolated liver mitochondria from naive control rats was reduced following direct exposure to GSK932121A, again consistent with the effects of other known respiratory chain inhibitor compounds, but opposite to the effect observed in mitochondria isolated from the livers of rats treated with GSK932121A in vivo.
It is clear then that our in vitro functional data are consistent with GSK932121A's proposed complex III inhibitory mechanism and published data regarding other tool ETC inhibitors. Likewise the body temperature findings, LM/TEM, gene expression, blood lactate and gas analyses also point convincingly to GSK932121A blocking mitochondrial complex activity as expected. So why are the functional measures (OCR and CRC) obtained with the mitochondria isolated from animals treated with GSK932121A in vivo seemingly at odds with the overall picture?
In terms of the OCR data, it may be that GSK932121A washes out during isolation of the liver mitochondria from treated rats, however here we tested samples of isolated mitochondria from the in vivo experiment and appreciable levels of GSK932121A were detected (ESI2†). We also observe a reduction in the maximal OCR following FCCP treatment and a clear effect in the CRC assay (discussed below) in the mitochondria isolated from treated animals, arguing against washout of compound and reversal of effects during the isolation procedure. An alternate possibility is that the increase in OCR reflects a compensatory increase in the overall ETC activity within the isolated mitochondrial population as a result of increased proton leak due to ROS-induced mitochondrial damage. Consistent with other respiratory chain inhibitors (i.e. antimycin A28), an increase in oxidative stress was indicated in the livers of GSK932121A treated animals (significantly reduced GSH:GSSG ratio), but for ROS-induced damage to be a causative factor in the observed OCR increase, this would again rely on the de-inhibition of the ETC. A third possibility may be linked to stabilisation of the mitochondria and this is discussed below.
Mitochondria play a key role in regulating intracellular calcium concentrations during both normal and pathological states.29 However, excess calcium is able to trigger the mitochondrial permeability transition pore (mPTP), characterised by a non-selective increase in the permeability of the inner mitochondrial membrane.30,31 mPTP activity is affected by compounds that interfere with mitochondrial function and this can be monitored by measurement of CRC in mitochondrial isolates. Respiratory chain inhibitors typically reduce the CRC of isolated mitochondria when treated in vitro32 and this is exactly what was observed with GSK932121A (IC50 of 1.36 μM, well below the plasma concentrations of GSK932121A achieved in the in vivo study, ∼30–75 μM). In contrast liver mitochondria isolated from GSK932121A treated rats showed a significant and unexpected increase in CRC. It has been reported that the mPTP can be desensitised to calcium-induced opening during times of myocardial infarction due to a reduction in pH.33 It is possible that the lactic-acidosis induced pH reduction, observed in rats treated with GSK932121A, may cause an effect on the mPTP in vivo that persists and is maintained throughout the isolation procedure and CRC assay, i.e. despite the mitochondria being prepared and the CRC assay being performed in neutral pH buffers. Furthermore, the observed desensitisation of mPTP triggering could act to stabilise the mitochondria during the stressful isolation process, resulting in a higher proportion of intact (non-permeabilised) mitochondria per mg of measured protein; potentially explaining the increase in basal OCR level observed with mitochondria from the treated animals.
Mitochondria are capable of responding to increased energy demand or stress by utilising their spare respiratory reserve (i.e. the difference between basal respiration and maximal possible respiration rates).34 Significant depletion of this reserve capacity has been noted in response to increased ROS, aging, following drug exposure35 and importantly, has been demonstrated to precede cell death.36 One consistent functional effect observed both in vitro and in vivo in our study was an apparent reduction in the maximal respiration rate following GSK932121A exposure (i.e. uncoupled OCR following FCCP injection). This raises the question of whether monitoring for erosion of maximal respiratory capacity, in the absence of overt clinical signs, could be a way to overcome a key limitation of current preclinical safety testing with respect to detecting mitochondrial toxicity; namely the use of healthy young animals with inherently high reserve capacity. This current pre-clinical model is at odds with the low underlying metabolic reserves of many of our key patient groups who are often elderly, on co-medications, have co-morbidities etc. A more detailed analysis of metabolic reserve capacity using doses of GSK932121A below that which cause overt clinical signs would help to test this possibility and this is on-going.
Conclusions
1. The in vitro and in vivo data presented here supports the proposition that GSK932121A administered at 50 mg kg−1via the IP route causes acute toxicity in rats due to perturbation of mitochondrial function, most likely via inhibition of the electron transport chain.2. Building understanding around the progression of toxicity from complex III inhibition to adverse in vivo outcomes (clinical signs) required consideration of both the in vitro and in vivo data; neither on its own would have been sufficient. The in vitro data informed on the likely molecular initiating event and initial (non-confounded) respiratory response, whist the in vivo data provided a view of the integrated state of the mitochondria in response to the initial insult plus the compensatory adaptations made by the tissue and organism. The in vivo experiment also informed on the final adverse outcomes and provided a platform to investigate specific molecular and morphologic changes in a key tissue, for example, highlighting the role of the metabolic switch gene Foxo1 and the downstream effectors PGC1α, Pepck, Pdk4 and Irs2 in the cellular response to glycogen depletion in the liver.
3. Mitochondrial toxicity contributes significantly to clinical adverse events and to preclinical safety-related compound attrition (the largest source of attrition in the pharmaceutical industry). Conversely there is also increasing interest in targeting mitochondria for therapeutic benefit, since mitochondrial perturbation is central to the aetiology of many poorly treated human diseases. As such, developing our understanding of mitochondrial perturbation from molecular initiating events to clinical outcomes is of significant importance, as is developing new methods to assess mitochondrial function, and dysfunction, in vivo. This study provides significant detail regarding the in vivo manifestation of respiratory chain inhibition including key markers of the adverse outcome, e.g. core body temperature reduction and increased plasma lactate, plus transcriptomic and morphologic details around the switching of metabolism from OXPHOS to glycolysis. This type of multi-system mechanistic toxicology analysis is invaluable to those developing AOPs (for ETC inhibition in this case) yet it is rare to see them published for terminated pharmaceutical candidates. The data presented here provides the ground work for developing AOPs around ETC inhibition and also provides a platform for evaluating new methods of assessing underlying mitochondrial perturbation. Further work based on a systems approach is required in order to further understand the downstream mechanisms and pathways.37
Experimental procedures
Animals
The in vivo study in rats was ethically reviewed and carried out in accordance with the Animals (Scientific Procedures) Act 1986 and the GSK Policy on the Care, Welfare and Treatment of Animals. Female Crl:CD(SD) rats were obtained from Charles River UK (Margate, Kent), and were housed under controlled environmental conditions (19–23 °C, 55% ± 10% relative humidity, 12 h dark–light cycles), with free access to both water and 5LF2 EURodent Diet (Purina Mills International, St Louis, MO, USA). Female rats were used because previous tolerability studies using GSK932121A showed slightly more pronounced in-life effects in female rats than in males. All animals were implanted with an intrascapular Plexx™ microchip (Plexx B.V., Elst, The Netherlands) on arrival for the purposes of identification and body temperature measurement. Animals were acclimatised for at least 12 days prior to dose administration, and were 10 to 14 weeks old on the day of dosing.Drug selection and experimental design
The objective of this study was to evaluate markers of mitochondrial dysfunction in vitro and in vivo using GSK932121A. All doses and concentrations are expressed in terms of the parent compound (Fig. 1). A nanomilled and spray-dried formulation of GSK932121A (49.5% w/w), containing mannitol (44.5% w/w), hydroxypropylmethylcellulose pharmacoat 603 (5% w/w) and sodium lauryl sulphate (1% w/w) was suspended in sterile water for IP administration.A dose of 50 mg kg−1 was selected based on data generated in previous GSK932121A single-dose tolerability studies where dose-limiting clinical signs were noted in a proportion of the animals at approximately 5.5 hours post-dose. The aim of the investigation was to follow-up on the toxicological issue which led to GSK932121A's termination from development and therefore the 50 mg kg−1 dose (which replicated the acute toxicity observed) was selected and a time-point of 5 hours was chosen (i.e. to induce mitochondrial derived toxicity without generating prolonged in-life effects). A single dose of either 50 mg kg−1 GSK932121A or vehicle (shown above, minus test article) was administered by IP injection to female rats (12 per group) at a dose volume of 10 mL kg−1.
Body temperature readings were recorded telemetrically prior to dosing and at approximate 15 minute intervals following dose administration, alongside close monitoring of clinical signs. Animals were killed at a five hour time point by exsanguination via the abdominal aorta under terminal isoflurane anaesthesia. Two terminal blood samples were collected for analysis of lactate and pyruvate (100 μL transferred into 400 μL 0.4 M perchloric acid) and plasma concentration of GSK932121A (300 μL whole blood + ethylenediaminetetraacetic acid[EDTA] and centrifuged to prepare plasma). The liver was excised and dissected, with the left lateral lobe used immediately to isolate mitochondria for assessment of mitochondrial bioenergetics and calcium retention capacity (CRC). The right lateral lobe was processed for transmission electron microscopy (TEM) and light microscopy (LM) whilst the median lobe was snap frozen for gene expression analysis and glutathione assessment.
Blood gas (pO2 and pCO2) and bicarbonate (HCO3)
For blood gas analysis (pO2, pCO2 and HCO3) a separate group of animals (n = 6) underwent surgery to place vascular access ports at the site of blood collection. The jugular artery was isolated, cannulated (catheter entered approximately 2 cm into the jugular artery) and the catheter secured in place with ligatures of non-absorbable suture material (Ti-cron®, Medline Industried Inc., IL, USA). A 2 ml saline flush was given at the jugular surgical site prior to wound closure using absorbable suture material (PDS®, Ethicon Ltd, NJ, USA). After surgery a 1 week recovery period was permitted prior to administration of GSK932121A or vehicle control as previously described. Whole blood samples were collected via vascular access ports into heparinized syringes. Blood was sampled at 5 to 6 hours post dose (dependent on the observed clinical signs). All blood samples were analysed using a Roche OPTI CCA Blood Gas Analyzer (Opti Medical System Inc., GA, USA), according to manufacturer's recommendations, within 2 hours of collection for pCO2, pO2 and HCO3. Data are expressed as a percentage of baseline (pre-dose) measurement values.Assessment of glutathione (oxidised and reduced)
Measurement of the ratio between reduced glutathione (GSH) and oxidised glutathione (GSSG) was made in 100 mg of median liver lobe (from control and treated animals) using the NWLSS™ Glutathione Assay Kit (Northwest Life Sciences Specialities, Portland Oregon, USA) according to manufacturer's recommendations. Data was recorded using a Spectramax Plus 384 Spectrophotometer (Molecular Devices, Sunnyvale, CA, USA) and is expressed both in μmol mg−1 of liver tissue and as a ratio between GSH:GSSG.
Lactate/pyruvate
Blood was collected into perchloric acid as detailed above. Lactate was measured on a Siemens Advia 1650 clinical chemistry analyser (Siemens Healthcare Diagnostics, Surrey, UK) using a Lactate assay kit (Randox Life Sciences, Crumlin, Northern Ireland) according to the manufacturer's instructions. Pyruvate was also measured on this analyser using reagents from Sigma-Aldrich. Pyruvate estimation was made by measuring the reduction in absorbance at 340 nm due to oxidation of NADH to NAD as previously described.38 Pyruvate concentration was determined from a standard curve of between 0 and 0.45 mmol L−1 pyruvate. All concentrations were expressed in mmol L−1 and presented as a ratio between lactate and pyruvate.Light microscopy (LM) and transmission electron microscopy (TEM)
Transcriptomics
Total RNA was isolated from snap frozen median lobe of liver using the SV Total RNA isolation system (Promega, Madison, WI, USA). RNA concentration was determined using the NanoDrop ND-1000 (Wilmington, DE, USA) and RNA integrity was analysed using the Agilent 2100 Bioanalyser (Santa Clara, CA, USA). Samples not reaching the required RNA integrity number (RIN) of 7.5 were re-processed (as per the manufacturer's guidelines). 200 ng of total RNA was prepared for Affymetrix whole transcriptome (WT) microarray analysis using the Ambion WT Expression Kit (Life Technologies, Paisley, UK) and targets were fragmented, labelled and hybridized onto Rat Gene 2.0 ST Arrays (Affymetrix, Santa Clara, CA, USA) according to the protocols supplied (1 array per liver sample). Arrays were hybridized for 17 hours at 45 °C (65 rpm rotation) and then immediately washed, stained and scanned on the Affymetrix Genchip® Scanner 3000. Differential gene expression analysis was performed using Array Studio Version 7.0 (http://www.omicsoft.com) and data was normalised using the robust multichip average (RMA) method.39 Differentially expressed genes were defined as those with greater than 1.5 fold change in expression, at p < 0.05.Mitochondrial isolation
Mitochondria were prepared from the livers of control and GSK932121A treated animals using the Qproteome™ Mitochondria Isolation kit (Qiagen, Limburg, Netherlands) according to the manufacturer's instructions with minor modifications. Briefly, 1.3 g of liver was minced using a scalpel prior to homogenisation in ice cold lysis buffer using a Qiagen Tissue Ruptor. The homogenate was incubated on an end-over-end shaker for 10 minutes at 4 °C prior to centrifugation at 1300g for 13 minutes. The resulting pellet was resuspended in disruption buffer firstly by gentle pipetting and secondly using a Dounce homogenizer (4 strokes at 200 rpm). The resulting lysate was centrifuged at 1000g for 13 minutes with the resulting supernatant washed and pelleted twice at 6000g for 13 minutes. The crude mitochondrial pellet was finally resuspended in Incubation Buffer B (130 mM sucrose, 50 mM KCl, 2.5 mM KH2PO4 and 5 mM N-2-hydroxyethylpiperazine-N′-2-ethanesulfonic acid [HEPES], pH 7.4 with KOH) and protein content was measured using a bicinchoninic acid (BCA) protein assay kit (Pierce, Rockford, IL, USA).Calcium retention capacity
The CRC of freshly isolated liver mitochondria was determined as previously described by ref. 40 and 41 with minor modifications. Briefly, mitochondria were suspended at 0.2 mg ml−1 in Incubation Buffer B, supplemented with 100 μM arsenazo III, 2.5 μM rotenone and 1 μg mL−1 oligomycin in each well of a 96 well microplate (control and treated mitochondria were assayed simultaneously) and absorbance measured every 2 seconds at 650 nm in a FlexStation3 microplate reader (Molecular Devices, Sunnyvale, CA, USA). After approximately 1 minute of reading, Ca2+ was added (1 μmol mg−1 mitochondrial protein) shortly followed by the addition of 10 mM succinate as the mitochondrial substrate. The CRC was calculated as the difference in optical density (ΔOD) between the point at which mitochondria were energised and were undergoing mitochondrial permeability transition (i.e. the lowest OD reading following calcium release via MPT).The direct effect of GSK932121A on CRC was also examined by treating freshly isolated mitochondria from a control female Crl:CD(SD) rat in vitro following the above procedure with the following modification: GSK932121A was added in a five point concentration range (100 μM–0.01 μM) alongside a 0.5% DMSO control, to the mitochondrial suspension prior to reading.
Measurement of oxygen consumption rate in HepG2 cells
Human hepatocellular liver carcinoma (HepG2) cells were obtained from the European collection of cell cultures (ECCAC, Sailsbury UK). Cells were grown in DMEM medium (Invitrogen #11966) supplemented with 10 mM galactose, 100 μM sodium pyruvate, 5 mM HEPES, 2 mM GlutaMAX, 10% fetal bovine serum and 5 μg ml−1 gentamycin. Cells were maintained in a 37 °C, 5% CO2 humidified atmosphere. Measurement of OCR was performed essentially as described in ref. 26 with minor modifications. Briefly, HepG2 cells were seeded in an XF96-well plate at 20000 cells/80 μL cell culture medium per well and incubated in a 37 °C, 5% CO2 humidified atmosphere for 24 hours. Following incubation the culture medium was replaced with 175 μL pre-warmed, serum-free XF Base Assay Media (Seahorse Bioscience, Billerica, MA), supplemented with 2 mM L-glutamine, 1 mM sodium pyruvate and 10 mM glucose (pH 7.4) and incubated at 37 °C for one hour. GSK932121A was maintained in DMSO and a five point dose response (0.075 μM–75 μM), plus 0.1% DMSO control, was diluted to 8× concentration in XF Assay media and 25 μL was loaded into Port A of the XF Assay Cartridge (15 technical replicates per concentration of GSK932121A/DMSO control). Oligomycin (2 μM final), carbonyl cyanide-4-(trifluoromethoxy)phenylhydrazon [FCCP] (0.25 μM final) and antimycin A/rotenone (1 μM final) were loaded into ports B, C and D at 9×, 10× and 11× concentrations respectively (all 25μL volume). Following calibration of the XF Assay Cartridge, the cell plate was inserted into the analyser and 3 basal measurements were made using a 3 minute mix, 3 minute measure protocol. The compounds were then injected pneumatically into each well from ports A–D (GSK932121A first followed by mito-stress test compounds) with three, 3 minute mix, 3 minute measure cycles performed between each injection. Data is expressed in pmol min−1 OCR and represent the mid-point of each measurement period.
Measurement of oxygen consumption rate in isolated liver mitochondria
To assess bioenergetic parameters in liver mitochondria, the Seahorse XF24 Extracellular Flux Analyser (Seahorse Biosciences, Billerica, MA) was utilised. Oxygen consumption rate (OCR) was monitored as previously described.42 Briefly, sequential measurements of basal respiration, state 3, state 4 and uncoupled driven respiration were made through real-time additions of reagents through the drug-injection ports. Accordingly, ADP (5 mM), oligomycin (2 μM), FCCP (4 μM) and antimycin A (4 μM) (concentrations expressed as final concentrations and optimised as recommended by manufacturers) were loaded into the 4 injection ports of the XF Assay Cartridge and sequentially injected into each well throughout the assay. Mitochondria were diluted to a concentration of 10 μg protein per well in MAS-1 buffer (220 mM mannitol, 70 mM sucrose, 10 mM KH2PO4, 5 mM MgCl2, 2 mM HEPES, 1 mM ethylene glycol-bis(2-aminoethylether)-N,N,N′,N′-tetraacetic acid [EGTA] and 0.2% BSA in sterile water, pH 7.2 adjusted with KOH) supplemented with 10 mM succinate. Mitochondria were seeded (control and treated samples on the same plate) at a volume of 50 μL into each well (5 technical replicates) of a XF24 V7 microplate and centrifuged for 20 minutes at 2000g (4 °C). Following centrifugation, 450 μL of MAS-1 buffer, supplemented with 10 mM succinate and 2 μM rotenone, was added to each well. The mitochondria were viewed briefly under a microscope to ensure consistent seeding/adhesion and then placed at 37 °C for 8 minutes prior to loading into the XF24 analyser. Following a 12 minute equilibration, two baseline measurements were made using a 30 second mix, 4 minute measure cycle (mean of the two baseline measurements is presented). Reagents were then sequentially injected into each well with a further 30 second mix, 1 minute wait, 4 minute measure cycle between each injection.Statistics
Results are presented as the mean ± standard deviation (SD) unless otherwise stated. Statistical evaluation was performed using one way analysis of variance (ANOVA) with a post-hoc Dunnett's t-test. Differences with a value of p < 0.05 were considered statistically significant (p < 0.05*, p < 0.01**, p < 0.001***).Acknowledgements
This work was supported by GlaxoSmithKline with work completed in collaboration with Imperial College London and Public Health England as part of an MRC CASE studentship. We thank Dr Mark Lennon for his support with the gene expression analysis and David Grimsditch for his excellent technical assistance. The authors would also like to thank LAS, DMPK and SA departments of GlaxoSmithKline R&D for their support with the animal experimentation, drug formulation and toxicokinetics.References
- C. V. Pereira, et al., Investigating drug-induced mitochondrial toxicity: a biosensor to increase drug safety?, Curr. Drug Saf., 2009, 4(1), 34–54 CrossRef CAS PubMed.
- D. E. Amacher, Drug-associated mitochondrial toxicity and its detection, Curr. Med. Chem., 2005, 12(16), 1829–1839 CrossRef CAS PubMed.
- K. Chan, et al., Drug-induced mitochondrial toxicity, Expert Opin. Drug Metab. Toxicol., 2005, 1(4), 655–669 CrossRef CAS PubMed.
- K. B. Wallace and A. A. Starkov, Mitochondrial targets of drug toxicity, Annu. Rev. Pharmacol. Toxicol., 2000, 40, 353–388 CrossRef CAS PubMed.
- K. B. Wallace, Mitochondrial off targets of drug therapy, Trends Pharmacol. Sci., 2008, 29(7), 361–366 CrossRef CAS PubMed.
- J. A. Dykens and Y. Will, Drug-induced mitochondrial dysfunction, Wiley, 1st edn, 2008 Search PubMed.
- G. Labbe, D. Pessayre and B. Fromenty, Drug-induced liver injury through mitochondrial dysfunction: mechanisms and detection during preclinical safety studies, Fundam. Clin. Pharmacol., 2008, 22(4), 335–353 CrossRef CAS PubMed.
- T. J. Collins and M. D. Bootman, Mitochondria are morphologically heterogeneous within cells, J. Exp. Biol., 2003, 206(Pt 12), 1993–2000 CrossRef PubMed.
- B. E. Sansbury, et al., Bioenergetic function in cardiovascular cells: the importance of the reserve capacity and its biological regulation, Chem.-Biol. Interact., 2011, 191(1–3), 288–295 CrossRef CAS PubMed.
- S. Nadanaciva and Y. Will, Investigating mitochondrial dysfunction to increase drug safety in the pharmaceutical industry, Curr. Drug Targets, 2011, 12(6), 774–782 CrossRef CAS PubMed.
- R. T. Naven, et al., The development of structure–activity relationships for mitochondrial dysfunction: uncoupling of oxidative phosphorylation, Toxicol. Sci., 2013, 131(1), 271–278 CrossRef CAS PubMed.
- J. M. Bueno, et al., Exploration of 4(1H)-pyridones as a novel family of potent antimalarial inhibitors of the plasmodial cytochrome bc1, Future Med. Chem., 2012, 4(18), 2311–2323 CrossRef CAS PubMed.
- G. Wang, et al., Modeling the mitochondrial cardiomyopathy of Barth syndrome with induced pluripotent stem cell and heart-on-chip technologies, Nat. Med., 2014, 20(6), 616–623 CrossRef CAS PubMed.
- L. Nelson, Acute cyanide toxicity: mechanisms and manifestations, J. Emerg. Nurs., 2006, 32(4 Suppl), S8–11 CrossRef PubMed.
- J. Grundlingh, et al., 2,4-dinitrophenol (DNP): a weight loss agent with significant acute toxicity and risk of death, J. Med. Toxicol., 2011, 7(3), 205–212 CrossRef CAS PubMed.
- P. A. Nony, et al., 3-Nitropropionic acid (3-NPA) produces hypothermia and inhibits histochemical labeling of succinate dehydrogenase (SDH) in rat brain, Metab. Brain Dis., 1999, 14(2), 83–94 CrossRef CAS PubMed.
- H. B. Stoner, The role of the liver in non-shivering thermogenesis in the rat, J. Physiol., 1973, 232(2), 285–296 CrossRef CAS.
- A. Rotig, et al., Pearson's marrow-pancreas syndrome. A multisystem mitochondrial disorder in infancy, J. Clin. Invest., 1990, 86(5), 1601–1608 CrossRef CAS PubMed.
- Y. E. Claessens, et al., Bench-to-bedside review: severe lactic acidosis in HIV patients treated with nucleoside analogue reverse transcriptase inhibitors, Crit. Care, 2003, 7(3), 226–232 CrossRef PubMed.
- A. Limonciel, et al., Lactate is an ideal non-invasive marker for evaluating temporal alterations in cell stress and toxicity in repeat dose testing regimes, Toxicol. In Vitro, 2011, 25(8), 1855–1862 CrossRef CAS PubMed.
- B. J. Murray, Severe lactic acidosis and hypothermia, West. J. Med., 1981, 134(2), 162–166 CAS.
- D. N. Gross, A. P. van den Heuvel and M. J. Birnbaum, The role of FoxO in the regulation of metabolism, Oncogene, 2008, 27(16), 2320–2336 CrossRef CAS PubMed.
- C. Postic, R. Dentin and J. Girard, Role of the liver in the control of carbohydrate and lipid homeostasis, Diabetes Metab., 2004, 30(5), 398–408 CAS.
- P. G. Quinn and D. Yeagley, Insulin regulation of PEPCK gene expression: a model for rapid and reversible modulation, Curr. Drug Targets: Immune, Endocr. Metab. Disord., 2005, 5(4), 423–437 CrossRef CAS.
- H. Tyynismaa, et al., Mitochondrial myopathy induces a starvation-like response, Hum. Mol. Genet., 2010, 19(20), 3948–3958 CrossRef CAS PubMed.
- S. Nadanaciva, et al., Assessment of drug-induced mitochondrial dysfunction via altered cellular respiration and acidification measured in a 96-well platform, J. Bioenerg. Biomembr., 2012, 44(4), 421–437 CrossRef CAS PubMed.
- R. Scatena, et al., The role of mitochondria in pharmacotoxicology: a reevaluation of an old, newly emerging topic, Am. J. Physiol.: Cell Physiol., 2007, 293(1), C12–C21 CrossRef CAS PubMed.
- Q. Chen, et al., Production of reactive oxygen species by mitochondria: central role of complex III, J. Biol. Chem., 2003, 278(38), 36027–36031 CrossRef CAS PubMed.
- P. Bernardi and V. Petronilli, The permeability transition pore as a mitochondrial calcium release channel: a critical appraisal, J. Bioenerg. Biomembr., 1996, 28(2), 131–138 CrossRef CAS PubMed.
- P. Bernardi, The permeability transition pore. Control points of a cyclosporin A-sensitive mitochondrial channel involved in cell death, Biochim. Biophys. Acta, 1996, 1275(1–2), 5–9 CrossRef.
- V. Petronilli, et al., Regulation of the permeability transition pore, a voltage-dependent mitochondrial channel inhibited by cyclosporin A, Biochim. Biophys. Acta, 1994, 1187(2), 255–259 CrossRef CAS.
- M. Zoratti and I. Szabo, The mitochondrial permeability transition, Biochim. Biophys. Acta, 1995, 1241(2), 139–176 CrossRef.
- J. J. Lemasters, et al., The mitochondrial permeability transition in toxic, hypoxic and reperfusion injury, Mol. Cell. Biochem., 1997, 174(1–2), 159–165 CrossRef CAS PubMed.
- B. G. Hill, et al., Importance of the bioenergetic reserve capacity in response to cardiomyocyte stress induced by 4-hydroxynonenal, Biochem. J., 2009, 424(1), 99–107 CrossRef CAS PubMed.
- B. P. Dranka, B. G. Hill and V. M. Darley-Usmar, Mitochondrial reserve capacity in endothelial cells: The impact of nitric oxide and reactive oxygen species, Free Radicals Biol. Med., 2010, 48(7), 905–914 CrossRef CAS PubMed.
- N. R. Perron, C. Beeson and B. Rohrer, Early alterations in mitochondrial reserve capacity; a means to predict subsequent photoreceptor cell death, J. Bioenerg. Biomembr., 2013, 45(1–2), 101–109 CrossRef CAS PubMed.
- J. E. Carre and M. Singer, Cellular energetic metabolism in sepsis: the need for a systems approach, Biochim. Biophys. Acta, 2008, 1777(7–8), 763–771 CrossRef CAS PubMed.
- E. P. Marbach and M. H. Weil, Rapid enzymatic measurement of blood lactate and pyruvate. Use and significance of metaphosphoric acid as a common precipitant, Clin. Chem., 1967, 13(4), 314–325 CAS.
- R. A. Irizarry, et al., Exploration, normalization, and summaries of high density oligonucleotide array probe level data, Biostatistics, 2003, 4(2), 249–264 CrossRef PubMed.
- L. E. Solem and K. B. Wallace, Selective activation of the sodium-independent, cyclosporin A-sensitive calcium pore of cardiac mitochondria by doxorubicin, Toxicol. Appl. Pharmacol., 1993, 121(1), 50–57 CrossRef CAS PubMed.
- D. L. Santos, et al., Carvedilol protects against doxorubicin-induced mitochondrial cardiomyopathy, Toxicol. Appl. Pharmacol., 2002, 185(3), 218–227 CrossRef CAS PubMed.
- G. W. Rogers, et al., High throughput microplate respiratory measurements using minimal quantities of isolated mitochondria, PLoS One, 2011, 6(7), e21746 CAS.
Footnote |
| † Electronic supplementary information (ESI) available. See DOI: 10.1039/c5tx00197h |
| This journal is © The Royal Society of Chemistry 2016 |