miR-122 plays an important role in ochratoxin A-induced hepatocyte apoptosis in vitro and in vivo
Liye
Zhu
a,
Tao
Yu
a,
Xiaozhe
Qi
a,
Bo
Yang
a,
Lei
Shi
a,
Haoshu
Luo
b,
Xiaoyun
He
ac,
Kunlun
Huang
ac and
Wentao
Xu
*ac
aCollege of Food Science and Nutritional Engineering, China Agricultural University, 100083, Beijing, China
bCollege of Biological Sciences, China Agricultural University, Beijing, 100083, China
cThe Supervision, Inspection and Testing Center of Genetically Modified Organisms, Ministry of Agriculture, Beijing, 100083, China. E-mail: xuwentao@cau.edu.cn; Fax: +(8610)62738793; Tel: +(8610)62738793
First published on 8th October 2015
Abstract
OTA can induce hepatotoxicity. Our previous research has shown that miRNAs play important roles in the OTA-induced hepatotoxicity. And miR-122 is the most abundant miRNA in the liver and is involved in diverse biological processes. This study was performed to clarify the role of miR-122 in OTA-induced hepatotoxicity. The expression levels of miR-122 and the target genes were quantified by real-time PCR. The OTA-induced apoptosis of hepatocyte and HepG2 cells was evaluated using a TUNEL kit, a CCK-8 kit, a flow cytometer and Hoechst 33342. miR-122 was inhibited in HepG2 cells. The results revealed that OTA affected rat hepatocyte apoptosis. miR-122 decreased at 4 weeks but increased at 13 weeks in the OTA-treated livers, and increased in the OTA-treated HepG2 cells; and the mRNA levels of CCNG1 and Bcl-w increased at 4 weeks and decreased at 13 weeks in the high-dose OTA-treatment groups and decreased in HepG2 cells. The apoptosis of HepG2 cells displayed a dose-related increase with OTA. However, the inhibition of miR-122 greatly reduced OTA-induced apoptosis. p53 decreased in vivo and in vitro. miR-122 is a primary effector of OTA-induced hepatocyte apoptosis through the CCNG1/p53 pathway and Bcl-w/caspase-3 pathway in vivo and in vitro. And miR-122 plays an important role in OTA-induced hepatotoxicity.
Introduction
Ochratoxin A (OTA) is a secondary fungal metabolite produced by molds.1 OTA displays extensive toxicity, including hepatotoxicity, nephrotoxicity, genotoxicity, and teratogenicity.2 Previous studies have shown that the liver is one of the major target organs of OTA-induced toxicity. The liver is a vital metabolic regulation organ.3 The mechanisms of OTA action in the liver are controversial and thus warrant further study.miRNAs are a type of endogenous, conserved, non-coding small RNA. Their length is 20–25 nucleotides. And they are involved in many biological processes. miRNAs can regulate the target genes via post-transcriptional regulation of mRNA translation and stability. Studies have suggested that some fungal toxins resulted in toxicities based on the regulation of miRNAs expression, such as OTA and AFB1.4–7 A new avenue to understand OTA-induced hepatotoxicity is worth studying.
In our previous studies, we treated F344 male rats with OTA and analyzed the expression levels of miRNAs using multiple omics profiling technologies. We found an abnormal expression of some miRNAs.6,8 Among them, miR-122 is the most abundant miRNA in the liver, which is expressed in the developing liver and at a high level in the adult liver. miR-122 constitutes approximately 70% of all of the miRNAs in the liver,9 which appears to correlate with a key role in various functions in both normal and diseased livers. The most well-known function of miR-122 in the mammalian liver is to regulate lipid and cholesterol metabolism.10miR-122 is involved in cancer cell metabolism, apoptosis, and transfer and is also considered to be a tumor suppressor in the liver.11 Previous research has indicated that miR-122 was significantly downregulated in 70% of human and mouse hepatocellular carcinomas. Furthermore, another investigation showed that miR-122 may be a biomarker for the liver toxicity of AFB1,4 one of the well-known hepatotoxic mycotoxins. Additionally, miR-122 was shown to regulate the target gene CCNG1, and an inverse relationship between miR-122 and CCNG1 was observed in HCC.12 The regulation of p53 by CCNG1 results in cell survival.13 Also, a target gene of miR-122, Bcl-w, promotes cell survival in HCV.14,15 Until now, few studies have reported on how OTA regulates miRNAs and results in hepatotoxicity. And the relationship between miR-122 and hepatotoxicity induced by OTA also has not been reported.
Therefore, our study aimed to investigate the relationship between the OTA-induced hepatotoxicity and the aberrant expression of miR-122 using in vivo and in vitro models.
Results and discussion
OTA affected rat hepatocyte apoptosis
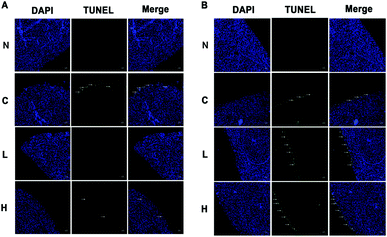
In our previous study, we reported that the serum biochemical indices were higher at 13 weeks in the low- and high-dose livers compared to the controls.16 LDH and AST mRNA levels at 13 weeks were lower in the high-dose compared to control rats, while at 4 weeks, LDH and AST were not significantly different. Because LDH and AST could reflect liver damage, this result suggests that liver damage was more severe in the high-dose group at 13 weeks compared to the OTA-treated animals for 4 weeks.16 Based on the changes of the physicochemical indices, we selected 4 weeks and 13 weeks as the critical time points to analyze OTA-induced hepatotoxicity in vivo.In the low- and high-dose groups, hepatocyte apoptosis had a dose-dependence on OTA. A significant decrease of hepatocyte apoptosis was observed at 4 weeks compared to the control group (Fig. 1A). At 13 weeks, hepatocyte apoptosis significantly increased in a dose-dependent manner. The green fluorescence signal indicated the positions of the apoptotic cells (Fig. 1B). The results indicated that the hepatocyte apoptosis had a different relationship with the OTA-treatment doses at different time points.
Dose-dependent OTA-induced HepG2 cell apoptosis
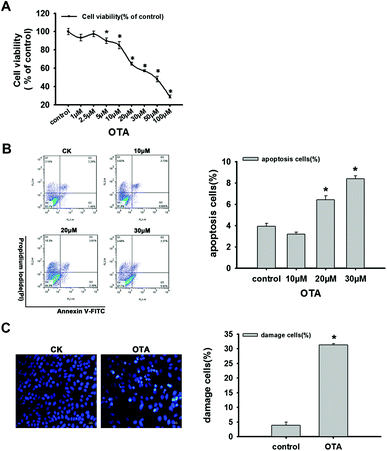
HepG2 cell viability was detected using the CCK-8. The treatment with different doses of OTA leads to a decrease in HepG2 cell viability (Fig. 2A). The cell survival rates appeared significantly reduced with the treatment of 5 μM OTA (p < 0.05). The IC50 of OTA for a 24 h treatment of HepG2 cells was approximately 50 μM (Fig. 2A).Previous reports have suggested that OTA can trigger programmed cell death (apoptosis) and influence the apoptotic signaling pathways.17–19 In our research, HepG2 cell apoptosis was detected using flow cytometry. The result clearly showed that the percentage of apoptotic cells increased with OTA treatment in a dose-dependent manner. The significant difference was at 20 μM OTA (p < 0.05) (Fig. 2B).
To further reflect the cytotoxicity of OTA, the nucleus and apoptotic body formation were detected. The results revealed that the HepG2 cells treated with 20 μM OTA were stained deep blue compared to the untreated cells. Additionally, the OTA-treated cells displayed a shriveled nucleus, a marker of apoptosis, while the control group did not. Moreover, we can clearly observe the condensation, chromatin marginalization and fragmentation of nuclear chromatin (Fig. 2C). These results all suggest that treatment with 20 μM OTA leads to significant apoptosis in the HepG2 cells (p < 0.05).
OTA induced changes in the expression of miR-122 in the liver and in HepG2 cells
In recent studies on the mechanisms of toxication, microRNAs provided a new perspective. Our laboratory has previously used transcriptomic and proteomic in vivo analyses to explore the roles of miRNAs in OTA-induced early hepatotoxicity.8 There is sufficient evidence supporting the aberrant expression of miR-122 in many hepatic diseases.20–22 Based on these findings, we chose to explore the role of miR-122 in the OTA-induced hepatotoxicity.The expression of miR-122 in the livers of rats treated with OTA at 4 weeks and 13 weeks was detected. At 4 weeks, miR-122 was lower in both the low- and high-dose animals compared to the controls (p < 0.05) (Fig. 3A). In contrast, miR-122 was significantly higher in both the low-and high-dose groups compared to the controls at 13 weeks (p < 0.05) (Fig. 3A). The results indicated that the expression of miR-122 at different time and dose points were different in vivo.
In HepG2 cells, we discovered that 20 μM OTA can lead to significant apoptosis of the HepG2 cells; however, the treatment affected the signaling pathway. After the treatment of HepG2 cells with 20 μM OTA, the expression of miR-122 was significantly upregulated (p < 0.05) compared to the control group (Fig. 3B).
miR-122 was downregulated at 4 weeks and upregulated at 13 weeks in vivo. Additionally, miR-122 was upregulated in vitro. Apoptosis increased with the upregulation of miR-122 induced by OTA in vivo and in vitro. Some studies have reported that the upregulation of miR-122 can inhibit cell proliferation and promote apoptosis. In cancer cells, the antitumor activity of Ad-miR-122 was most likely due to the induction of apoptosis.23 And in Pax-8–/– mice, the upregulation of miR-122 influenced cell viability and regulated the expression of apoptotic genes.24 The overexpression of miR-122 can induce cell cycle arrest and result in tumorigenicity.25 Lian et al. reported that in the carcinogenesis of renal cancer, miR-122 was upregulated by the P13 K/Akt signaling pathway.26
OTA induced changes in the expression of CCNG1/p53 in the liver and in HepG2 cells
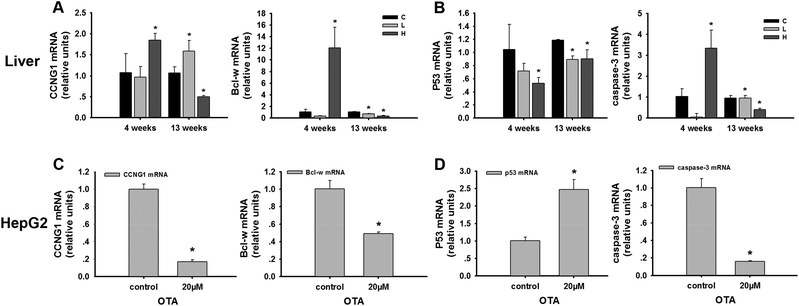
In the liver, CCNG1, a target gene of miR-122, was detected. CCNG1 was discovered as a member of the cyclin family, a protein family that regulates the cell cycle. CCNG1 was potently elevated in the high-dose group (p < 0.05) compared to the control group at 4 weeks, while its level significantly declined (p < 0.05) in the high-dose group at 13 weeks (Fig. 4A). p53 is regarded as one of the most important tumor suppressor genes and the downstream genes of CCNG1. In our study, p53 was significantly decreased at 4 weeks and 13 weeks in the high-dose group compared to the control groups (p < 0.05) (Fig. 4B).In HepG2 cells, the results indicated the downregulation of CCNG1 (Fig. 4C). The reduced levels of CCNG1 reflected the altered functional levels of cellular miR-122. To verify the signaling pathway, p53 was determined. p53 was significantly upregulated in the treatment group compared to the control group (p < 0.05) (Fig. 4D). These results are in agreement with the group treated in vivo partly.
OTA treatment affected the expression of CCNG1. In the current study, CCNG1 was higher after 4 weeks and lower after 13 weeks of treatment in the high-dose group in vivo. Additionally, CCNG1 was decreased in HepG2 cells after OTA-treatment. Consistent with the previous report, acute alcohol treatment induced miR-122 up-regulation and decreased CCNG1 in Huh-7.5 cells.27 In our study, p53 was lower in the high-dose group after 4 weeks and 13 weeks of treatment in vivo, and also was increased in vitro. CCNG1 and p53 display a feedback relationship.28 In HCC, miR-122 influenced the activity of p53 through the regulation of CCNG1, resulting in a lower survival of HCC-derived cell lines.13miR-122 can interrupt the interaction between CCNG1 and p53, which can favor carcinogenesis.29 Studies also have indicated that p53 can inhibit tumor cell proliferation via the induction of DNA damage and cell cycle arrest which then induces the production of CCNG1.30 Kato et al. found that in a murine erythroleukemic cell line, p53-CCNG1-COXII was involved in inducing cell apoptosis.31 In our study, at 13 weeks, OTA leads to the downregulation of p53, which may not occur through the miR-122/CCNG1 pathway alone, as an increase in the level of p53 via miR-122 regulation of p53/Akt signaling can induce apoptosis in cutaneous T-cell lymphoma.32 In human gastric epithelium GES-1 cells, OTA treatment can increase p53 expression.33 This finding is in agreement with our results in vitro, because hepatocarcinogenesis always follows hepatocyte apoptosis and regeneration.34 These results may also indicate that OTA may induce hepatocellular carcinoma after long-time treatment by regulating the expression of miR-122 and affecting the CCNG1/p53 pathway.
OTA induced changes in the expression of Bcl-w/Caspase-3 in the liver and in HepG2 cells
In vivo, the expression of Bcl-w, miR-122 target gene, was significantly increased at 4 weeks and decreased at 13 weeks (p < 0.05) in the high-dose OTA group (Fig. 4A). Caspase-3, a member of the caspase family, is a predictor of apoptosis. We detected that caspase-3 increased at 4 weeks and decreased at 13 weeks in the high-dose animals (Fig. 4B).In the HepG2 cells, Bcl-w was also determined. The expression level of Bcl-w decreased after OTA treatment (p < 0.05) (Fig. 4C). And caspase-3, the downstream genes of Bcl-w, decreased significantly in the treatment group compared to the control group (p < 0.05) (Fig. 4D). These results are also in agreement with the group treated for 13 weeks.
Bcl-w is an anti-apoptotic gene of the Bcl-2 family. and caspase-3 is a key protein that is involved in the apoptosis. They all exist in the mitochondria. OTA can induce apoptosis via regulating the mitochondrial pathway35 and miR-122 is also a regulator of the mitochondrial metabolic gene network.21 The mitochondrial pathway is regulated by the Bcl-2 family.36miR-122 can downregulate the expression of Bcl-w in HepG2 cells and result in the apoptosis of the HCC-derived cell lines by downregulating the Bcl-w/Bax ratio.15 The treatment with miR-122 mimetics or miR-122 inhibitor affects the activity of caspase-3 in H9C2 myocytes.24 OTA can induce the activities of caspase-3 and result in the apoptosis of neuronal cells accompanied by the disappearance of the MMP.37 When the MMP collapses, cytochrome c is released into the cytosol and binds to Apaf-1, resulting in the recruitment of pro-caspases, which further activates the effector caspases. In our study, Bcl-w and caspase-3 were significantly downregulated at 13 weeks in the high-dose group both in vivo and in vitro, while the apoptosis is induced compared to the control group. Consistent with this result, OTA can affect apoptosis by influencing caspase-3 and Bcl-2 in HKC cells.38Caspase-3 was decreased in the HEK293 cells after the OTA treatment.39 In agreement with our result, the inhibition of caspase-3 may be affected by the inhibitor-of-apoptosis (IAP) family of genes, which regulate apoptosis, block the activity of procaspase-9 induced by cytochrome c, and further prevent the activity of caspase-3; however, IAPs cannot prevent the activity of caspase-8.40,41 These findings suggest that the OTA-induced apoptosis in the liver and HepG2 cells resulted from the abnormal expression of miR-122 and the disturbance of the mitochondrial pathway, which resulted in hepatotoxicity.
miR-122 inhibitor relieved HepG2 cell apoptosis induced by OTA
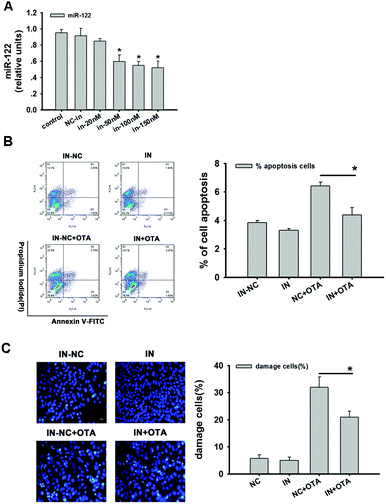
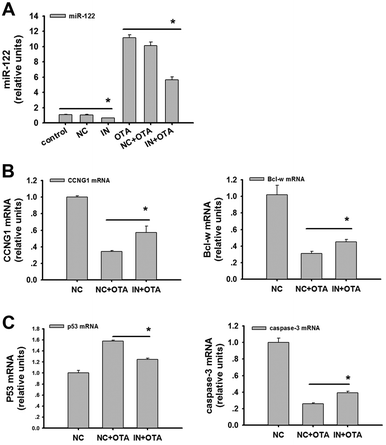
The inhibition efficiency of the miR-122 inhibitor was detected. There was no difference between the control group (CK) and the inhibitor-negative control group (NC). However, the expression of miR-122 was decreased with an increase in the concentration of the miR-122 inhibitor. According to the results, a 50 nM inhibitor was confirmed to be the optimal concentration. Compared to the negative control, there was a significant difference (p < 0.05) (Fig. 5A). The inhibition efficiency was approximately 41% compared to the inhibitor-negative group.After the HepG2 cells were transfected with the 50 nM inhibitor, the cells were analyzed for the presence of apoptosis after OTA treatment. The results showed that cell apoptosis was significantly reduced in the inhibitor group compared to the negative group (p < 0.05) both treated with 20 μM OTA. Apoptosis in the cells treated only with the inhibitor did not significantly differ compared to the negative group (Fig. 5B). Additionally, in the group transfected with the inhibitor and also treated with OTA, the apoptotic cells were significantly decreased compared to the inhibitor-negative group (p < 0.05).
Hoechst 33342 was used to further observe the apoptosis of HepG2 cells. In Fig. 5C, we can clearly observe that the cells, which were only treated with OTA, were markedly more apoptotic than the other groups. Moreover, after OTA treatment, the apoptotic cells were significantly decreased with inhibitor treatment than with inhibitor-negative treatment (p < 0.05). The deep blue staining appeared in the group treated with OTA and revealed the fragmentation, condensation, and chromatin marginalization of nuclear chromatin, and the shriveled nucleus and chromatin condensation decreased in the inhibitor group compared to the inhibitor-negative group both treated with OTA (Fig. 5C).
These results clearly revealed that the inhibition of miR-122 can relieve HepG2 cell apoptosis induced by OTA. Consistent with this, the apoptosis of Huh-7 cells transfected with anti-miR-122 was significantly decreased.42
The inhibitor of miR-122 downregulated the expression of miR-122 and elevated CCNG1 and Bcl-w in the HepG2 cells treated with OTA
To assess the role of miR-122 in promoting OTA-induced apoptosis in HepG2 cells, we detected miR-122 and its target genes after transfecting the cells with the miR-122 inhibitor. We found that the inhibitor caused potent downregulation of miR-122 (Fig. 6A) (p < 0.05). Importantly, the mRNA levels of CCNG1 and Bcl-w were upregulated after the transfection with the inhibitor (Fig. 6B) (p < 0.05). Furthermore, the mRNA levels of p53 and caspase-3 were both significantly downregulated after the transfection with the inhibitor (Fig. 6C) (p < 0.05).Further, these results showed that CCNG1/p53 and Bcl-w/caspase-3 were regulated by miR-122 to induce the apoptosis of the HepG2 cells after the OTA treatment.
Experimental
Animals
Male F344 rats (6–7 weeks old) were purchased from Vital River (Beijing, China). All of the experimental procedures involving animals were approved by the Ethics Committee of China Agricultural University (permission number: 120020). The rats were fed at the Supervision and Testing Center for GMOs Food Safety, Ministry of Agriculture (Beijing, China). The rats were gavaged with OTA dissolved in corn oil (Aladdin, Shanghai, China) at the respective dosage (0, 70, 210 μg per kg body weight (b.w.), denoted as C, L, H groups) for 4 or 13 weeks.16Cell culture and treatment
HepG2 cells were cultured in high glucose Dulbecco's Modified Eagle's Medium (DMEM), 10% (v/v) fetal bovine serum, 100 U per ml penicillin, 100 U per ml streptomycin at 37 °C in a humidified 5% CO2 and 95% saturated atmospheric humidity incubator. After the HepG2 cells were seeded into plates for 24 h, the cells were treated with OTA. The HepG2 cells treated with serum-free medium act as a control. After 24 h, the cells were collected for various experiments.TUNEL assay
TUNEL (Roche, USA) is used to detect the apoptotic cells. The liver sections were deparaffinized, rehydrated, and washed in PBS. After the microwave antigen retrieval, the sections were incubated with 0.1 M Tris-HCl (pH 7.5) buffer containing 3% BSA and 20% fetal bovine serum. The TUNEL reaction mixture and the negative control were added. After that, the sections were incubated with DAPI. Digital photographs were taken using a fluorescence microscope.CCK8 assay
CCK-8 (Beyotime, China) was used to detect HepG2 cell viability. The kit is based on dehydrogenases within the cell that reduce WST-8 to a soluble formazan dye, the accumulation of which was used to analyze cell proliferation and toxicity. The cells were seeded into a 96-well plate. After 24 h, the cells were treated with different concentrations of OTA, and then CCK8 was added for incubation. The fluorescence intensity at 450 nm was determined using a microplate reader (Thermo, USA).Hoechst 33342 assay
Hoechst 33342 was used to detect the apoptotic HepG2 cells. Hoechst 33342 combines with the DNA of the apoptotic cells and they appear dark blue. After the cells were seeded for 24 h, they were treated with 20 μM OTA for 24 h and the control cells were treated with the serum-free medium. The cells were incubated with Hoechst 33342 in an incubator and kept in the dark. A fluorescence microscope was used to observe the cells.Flow cytometry analyses of HepG2 cell apoptosis
The apoptosis of HepG2 cells was examined using a FITC-Annexin V/Propidium Iodide (PI) Apoptosis Detection Kit (Kaiji, China). The HepG2 cells were seeded into a 6-well plate. Then, they were treated with OTA. The control was treated with a serum-free medium. For flow cytometric analysis, the cells were stained with FITC-Annexin V and PI in the dark. The cells were analyzed using a FACSCalibur flow cytometer (BD Biosciences, USA). For statistical analysis, 20![[thin space (1/6-em)]](https://www.rsc.org/images/entities/char_2009.gif) 000 total cells per sample were counted.
000 total cells per sample were counted.
Real-time PCR analyses of miR-122 and the target genes
miR-122 was measured using a Quantitative Real-Time PCR Kit, TaKaRa. First, total RNA was extracted from the liver tissue and the sample cells using a RNAiso Plus kit (TaKaRa, Dalian, China). U6 was selected as a control gene for miRNA expression. The RNA was reversed transcribed into cDNA. The reverse transcription was performed in a DNA Thermal Cycler 4800.β-Actin was used as a control gene for mRNA expression. The cDNA of the target genes was synthesized using an oligo(dT) primer. The reaction was carried out in a water bath kettle.
Real-time PCR was performed using an Applied Biosystems 7500 Real-time PCR System (Applied Biosystems, CA). The primers are listed in Tables 1–3. The relative expression of each target gene was expressed as 2−ΔΔCT. All of the experiments were performed at least thrice.
| Gene name | RT-primer |
|---|---|
| miR-122-RT | CTCAACTGGTGTCGTGGAGTCGGCAATTCAGTTGAGCAAACACC |
| U6-RT | AACGCTTCACGAATTTGCGT |
| Gene name | Forward primer | Reverse primer |
|---|---|---|
| miR-122 | ATCGACATCTGGAGTGTGACAATG | CTCAACTGGTGTCGTGGAGTC |
| U6 | CTCGCTTCGGCAGCACA | AACGCTTCACGAATTTGCGT |
| Gene name | Forward primer | Reverse primer |
|---|---|---|
| rat-CCNG1 | CTCTGTGGCAGTTGGGCTAA | AACAGCTAACGTGGTGAGGG |
| rat-p53 | GTCGGCTCCGACTATACCACTATC | CTCTCTTTGCACTCCCTGGGGG |
| rat-Bcl-w | CACCCAGGTCTCCGATGAAC | TTGTTGACACTCTCAGCACAC |
| rat-Caspase3 | CTGGACTGCGGTATTGAGAC | CCGGGTGCGGTAGAGTAAGC |
| hsa-CCNG1 | AGCTGCAGTCTCTGTCAAG | ATGTCTCTGTGTCAAAGCCA |
| hsa-p53 | TAACAGTTCCTGCATGGGCGGC | AGGACAGGCACAAACACGCACC |
| hsa-Bcl-w | CACCCAGGTCTCCGATGAAC | TTGTTGACACTCTCAGCACAC |
| hsa-Caspase3 | CTCCTTCCATCAAATAGAAC | AATTAACAATCATTGCCTCT |
| rat-β-actin | CCCATCTATGAGGGTTACGC | TTTAATGTCACGCACGATTTC |
| hsa-β-actin | TCGTGCGTGACATTAAGGAG | AGGAAGGAAGGCTGGAAGAG |
miR-122 inhibitor transfection
A hsa-miR-122 inhibitor (5′-UCAAACACCAUUGUCACACUCCA-3′) was synthesized by GenePharma (Shanghai, China). An NC-inhibitor (5′-CAGUACUUU UGUGUAGUACAA-3′) was used as a negative control. The HepG2 cells were seeded into plates. Transfection was carried out using HTF (Nuolanxin, China). After 6 h, OTA was added into the plates. Then, the cells were harvested for various experiments.Statistical analysis
The results are expressed as the means ± standard deviation (SD). The experiments were repeated at least twice, and each experiment was conducted at least thrice. The data were subjected to analysis of variance (ANOVA) or t-test, and the significance was analyzed using the SPSS16.0 software. Differences were considered to be significant when p < 0.05.Conclusion
Our results suggest that OTA induces apoptosis via regulating the expression of miR-122 and its target genes (Fig. 7). By regulating the expression of miR-122, OTA may result in hepatocyte apoptosis through the mitochondrial pathway; OTA also induces the hepatocellular carcinoma after long periods of treatment. These findings imply that cell apoptosis is the primary mode of action for OTA-induced hepatotoxicity.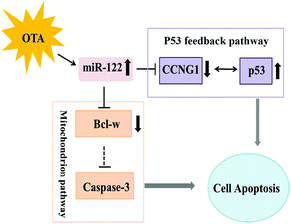 | ||
| Fig. 7 A model for the role of miR-122 in ochratoxin A-induced hepatocyte apoptosis in vivo and in vitro. | ||
Abbreviations
| OTA | Ochratoxin A |
| TUNEL | TdT-mediated dUTP nick end labeling |
| CCK-8 | Cell Counting Kit-8 |
| AFB1 | Aflatoxin B1 |
| HCC | Hepatocellular carcinoma |
| HCV | Hepatitis C virus |
| DMEM | Dulbecco's Modified Eagle's Medium |
| GMOs | Genetically modified organisms |
| PI | Propidium iodide |
| SD | Standard deviation |
| NC | Negative control |
| LDH | Lactate dehydrogenase |
| AST | Aspartate transaminase |
| IC50 | Half maximal inhibitory concentration of a substance |
| MMP | Mitochondrial membrane potential |
| IAP | Inhibitor-of-apoptosis |
Acknowledgements
This work was funded by “National High Technology Research and Development Program 863 and Laboratory of Food quality and safety, Beijing 100083, China” (Grant No. 2012AA101606). The funders had no role in the study design, data collection and analysis, the decision to publish, or the preparation of the manuscript.Notes and references
- K. J. van der Merwe, P. S. Steyn, L. Fourie, D. B. Scott and J. J. Theron, Nature, 1965, 205, 1112–1113 CrossRef CAS PubMed.
- M. Marin-Kuan, S. Nestler, C. Verguet, C. Bezencon, D. Piguet, R. Mansourian, J. Holzwarth, M. Grigorov, T. Delatour, P. Mantle, C. Cavin and B. Schilter, Toxicol. Sci., 2006, 89, 120–134 CrossRef CAS PubMed.
- D. Mochly-Rosen, M. H. Disatnik and X. Qi, Rare Dis., 2014, 2, e28637 CrossRef PubMed.
- R. Valencia-Quintana, J. Sanchez-Alarcon, M. G. Tenorio-Arvide, Y. Deng, J. M. Montiel-Gonzalez, S. Gomez-Arroyo, R. Villalobos-Pietrini, J. Cortes-Eslava, A. R. Flores-Marquez and F. Arenas-Huertero, Front. Microbiol., 2014, 5, 102 Search PubMed.
- W. Yang, J. Lian, Y. Feng, S. Srinivas, Z. Guo, H. Zhong, Z. Zhuang and S. Wang, Toxicol. Lett., 2014, 226, 140–149 CrossRef CAS PubMed.
- Q. Dai, J. Zhao, X. Qi, W. Xu, X. He, M. Guo, H. Dweep, W. H. Cheng, Y. Luo, K. Xia, N. Gretz and K. Huang, BMC Genomics, 2014, 15, 333 CrossRef PubMed.
- X. Qi, X. Yang, S. Chen, X. He, H. Dweep, M. Guo, W.-H. Cheng, W. Xu, Y. Luo, N. Gretz, Q. Dai and K. Huang, Sci. Rep., 2014, 4, 1–14 Search PubMed.
- Y. Sheng, X. Qi, Y. Liu, M. Guo, S. Chen, X. He, K. Huang and W. Xu, Food Chem. Toxicol., 2014, 72C, 242–246 CrossRef PubMed.
- M. Girard, E. Jacquemin, A. Munnich, S. Lyonnet and A. Henrion-Caude, J. Hepatol., 2008, 48, 648–656 CrossRef CAS PubMed.
- A. P. Lewis and C. L. Jopling, Biochem. Soc. Trans., 2010, 38, 1553–1557 CrossRef CAS PubMed.
- R. Nassirpour, P. P. Mehta and M. J. Yin, PLoS One, 2013, 8, 1–10 Search PubMed.
- L. Gramantieri, M. Ferracin, F. Fornari, A. Veronese, S. Sabbioni, C. G. Liu, G. A. Calin, C. Giovannini, E. Ferrazzi, G. L. Grazi, C. M. Croce, L. Bolondi and M. Negrini, Cancer Res., 2007, 67, 6092–6099 CrossRef CAS PubMed.
- F. Fornari, L. Gramantieri, C. Giovannini, A. Veronese, M. Ferracin, S. Sabbioni, G. A. Calin, G. L. Grazi, C. M. Croce, S. Tavolari, P. Chieco, M. Negrini and L. Bolondi, Cancer Res., 2009, 69, 5761–5767 CrossRef CAS PubMed.
- B. K. Elamin, E. Callegari, L. Gramantieri, S. Sabbioni and M. Negrini, Mutat. Res., 2011, 717, 67–76 CrossRef CAS PubMed.
- C. J. Lin, H. Y. Gong, H. C. Tseng, W. L. Wang and J. L. Wu, Biochem. Biophys. Res. Commun., 2008, 375, 315–320 CrossRef CAS PubMed.
- J. Cui, T. Wei, L. N. Liu, X. Zhang, X. Qi, Z. F. Zhang and Z. Q. Wang, Parasitol. Res., 2014, 113, 3511–3516 CrossRef PubMed.
- E. Essid and E. Petzinger, Mycotoxin Res., 2011, 27, 167–176 CrossRef CAS PubMed.
- M. Chopra, P. Link, C. Michels and D. Schrenk, Cell Biol. Toxicol., 2010, 26, 239–254 CrossRef CAS PubMed.
- G. B. E. El, A. Rodriguez-Enfedaque, C. Bouaziz, M. Ladjimi, F. Renaud and H. Bacha, J. Biochem. Mol. Toxicol., 2009, 23, 87–96 CrossRef PubMed.
- H. Kutay, S. Bai, J. Datta, T. Motiwala, I. Pogribny, W. Frankel, S. T. Jacob and K. Ghoshal, J. Cell. Biochem., 2006, 99, 671–678 CrossRef CAS PubMed.
- J. Burchard, C. Zhang, A. M. Liu, R. T. Poon, N. P. Lee, K. F. Wong, P. C. Sham, B. Y. Lam, M. D. Ferguson, G. Tokiwa, R. Smith, B. Leeson, R. Beard, J. R. Lamb, L. Lim, M. Mao, H. Dai and J. M. Luk, Mol. Syst. Biol., 2010, 6, 402 CrossRef PubMed.
- O. Cheung, P. Puri, C. Eicken, M. J. Contos, F. Mirshahi, J. W. Maher, J. M. Kellum, H. Min, V. A. Luketic and A. J. Sanyal, Hepatology, 2008, 48, 1810–1820 CrossRef CAS PubMed.
- L. Ma, J. Liu, J. Shen, L. Liu, J. Wu, W. Li, J. Luo, Q. Chen and C. Qian, Cancer Biol. Ther., 2010, 9, 554–561 CrossRef CAS.
- X. Huang, F. Huang, D. Yang, F. Dong, X. Shi, H. Wang, X. Zhou, S. Wang and S. Dai, J. Cell. Mol. Med., 2012, 16, 2637–2646 CrossRef CAS PubMed.
- J. Xu, X. M. Zhu, L. J. Wu, R. Yang, Z. R. Yang, Q. F. Wang and F. S. Wu, Liver Int., 2012, 32, 752–760 CrossRef CAS PubMed.
- J. H. Lian, W. H. Wang, J. Q. Wang, Y. H. Zhang and Y. Li, Asian Pac. J. Cancer Prev., 2013, 14, 5017–5021 CrossRef.
- W. Hou, T. N. Bukong, K. Kodys and G. Szabo, Alcohol.: Clin. Exp. Res., 2013, 37, 599–608 CrossRef CAS PubMed.
- T. Ohtsuka, H. Ryu, Y. A. Minamishima, A. Ryo and S. W. Lee, Oncogene, 2003, 22, 1678–1687 CrossRef CAS PubMed.
- S. F. Wang, L. P. Qiu, X. L. Yan, W. S. Jin, Y. Z. Wang, L. Z. Chen, E. J. Wu, X. Ye, G. F. Gao, F. S. Wang, Y. Chen, Z. P. Duan and S. D. Meng, Hepatology, 2012, 55, 730–741 CrossRef CAS PubMed.
- M. B. Kastan, C. E. Canman and C. J. Leonard, Cancer Metastasis Rev., 1995, 14, 3–15 CrossRef CAS.
- M. V. Kato, Leuk. Lymphoma, 1999, 33, 181–186 CAS.
- V. Manfe, E. Biskup, A. Rosbjerg, M. Kamstrup, A. G. Skov, C. M. Lerche, B. T. Lauenborg, N. Odum and R. Gniadecki, PLoS One, 2012, 7, e29541 CAS.
- J. Cui, J. Liu, S. Wu, Y. Wang, H. Shen, L. Xing, J. Wang, X. Yan and X. Zhang, Arch. Toxicol., 2013, 87, 1829–1840 CrossRef CAS PubMed.
- W. C. Tsai, S. D. Hsu, C. S. Hsu, T. C. Lai, S. J. Chen, R. Shen, Y. Huang, H. C. Chen, C. H. Lee, T. F. Tsai, M. T. Hsu, J. C. Wu, H. D. Huang, M. S. Shiao, M. Hsiao and A. P. Tsou, J. Clin. Invest., 2012, 122, 2884–2897 CAS.
- J. Folch, D. Alvira, M. Lopez-Querol, M. Tajes, F. X. Sureda, A. Forsby, V. Rimbau, A. Camins and M. Pallas, Toxicol. In Vitro, 2010, 24, 465–471 CrossRef CAS PubMed.
- B. Antonsson, Cell Tissue Res., 2001, 306, 347–361 CrossRef CAS PubMed.
- X. Zhang, C. Boesch-Saadatmandi, Y. Lou, S. Wolffram, P. Huebbe and G. Rimbach, Genes Nutr., 2009, 4, 41–48 CrossRef CAS PubMed.
- Z. N. Li, X. H. Zhang, J. F. Cui and W. J. Kang, J. Biochem. Mol. Toxicol., 2012, 26, 139–146 CrossRef CAS PubMed.
- X. L. Shen, B. Zhang, R. Liang, W. H. Cheng, W. Xu, Y. Luo, C. Zhao and K. Huang, Food Chem. Toxicol., 2014, 69, 202–209 CrossRef CAS PubMed.
- Q. L. Deveraux, R. Takahashi, G. S. Salvesen and J. C. Reed, Nature, 1997, 388, 300–304 CrossRef CAS PubMed.
- Q. L. Deveraux, N. Roy, H. R. Stennicke, T. Van Arsdale, Q. Zhou, S. M. Srinivasula, E. S. Alnemri, G. S. Salvesen and J. C. Reed, EMBO J., 1998, 17, 2215–2223 CrossRef CAS PubMed.
- X. Wu, S. Q. Wu, L. Tong, T. A. Luan, L. X. Lin, S. L. Lu, W. R. Zhao, Q. Q. Ma, H. M. Liu and Z. H. Zhong, Scand. J. Gastroenterol., 2009, 44, 1332–1339 CrossRef CAS PubMed.
| This journal is © The Royal Society of Chemistry 2016 |

