 Open Access Article
Creative Commons Attribution 3.0 Unported Licence
Structure evolution and photoluminescence of Lu3(Al,Mg)2(Al,Si)3O12:Ce3+ phosphors: new yellow-color converters for blue LED-driven solid state lighting†
Haipeng
Ji
ab,
Le
Wang
c,
Maxim S.
Molokeev
 de,
Naoto
Hirosaki
b,
Rongjun
Xie
*bf,
Zhaohui
Huang
*a,
Zhiguo
Xia
*g,
Otmar M.
ten Kate
b,
Lihong
Liu
b and
Victor V.
Atuchin
hij
aNational Laboratory of Mineral Materials, Beijing Key Laboratory of Materials Utilization of Nonmetallic Minerals and Solid Wastes, School of Materials Science and Technology, China University of Geosciences (Beijing), Beijing 100083, China. E-mail: huang118@cugb.edu.cn
bSialon Group, National Institute for Materials Science, 1-1 Namiki, Tsukuba 305-0044, Japan
cCollege of Optical and Electronic Technology, China Jiliang University, Hangzhou 310018, China
dLaboratory of Crystal Physics, Kirensky Institute of Physics, SB RAS, Krasnoyarsk 660036, Russia
eDepartment of Physics, Far Eastern State Transport University, Khabarovsk, 680021, Russia
fCollege of Materials, Xiamen University, Xiamen 361005, China. E-mail: rjxie@xmu.edu.cn
gThe Beijing Municipal Key Laboratory of New Energy Materials and Technologies, School of Materials Sciences and Engineering, University of Science and Technology Beijing, Beijing 100083, China. E-mail: xiazg@ustb.edu.cn
hLaboratory of Optical Materials and Structures, Institute of Semiconductor Physics, SB RAS, Novosibirsk 630090, Russia
iFunctional Electronics Laboratory, Tomsk State University, Tomsk 634050, Russia
jLaboratory of Semiconductor and Dielectric Materials, Novosibirsk State University, Novosibirsk 630090, Russia
First published on 20th June 2016
Abstract
This paper reports the development of new phosphors using the chemical unit cosubstituting solid solution design strategy. Starting from Lu3Al5O12, the Al3+–Al3+ couple in respective octahedral and tetrahedral coordination was simultaneously substituted by a Mg2+–Si4+ pair forming the Lu3(Al2−xMgx)(Al3−xSix)O12:Ce3+ (x = 0.5–2.0) series; as a result, the CeO8 polyhedrons were compressed and the emission got red-shifted from green to yellow together with the broadening. The evolution of, the unit cell, the local structural geometry as well as the optical properties of Ce3+ in these garnet creations, in response to the gradual Mg–Si substitution for Al–Al, were studied by combined techniques of structural refinement and luminescence measurements. The new composition Lu2.97Ce0.03Mg0.5Al4Si0.5O12 was comprehensively evaluated regarding its potential application in blue LED-driven solid state white lighting: the maximum emission is at 550 nm under λex = 450 nm; the internal and external quantum efficiencies can reach 85% and 49%, respectively; a 1-phosphor-converted wLED lamp fabricated using the as-prepared phosphor exhibits the luminous efficacy of 105 lm W−1, the correlated color temperature of 6164 K and the color rendering index (Ra) of 75.6. The new solid solution composition series is open for further optimization to enhance the competence for commercial consideration.
Introduction
White light emitting diodes (wLEDs) exhibit many advantages, such as long lifetime, high luminous efficacy and eco-friendliness over conventional incandescent bulbs or fluorescent lamps.1 Nowadays, the lighting market undergoes an accelerating replacement of such traditional lighting sources by the wLEDs. Besides, it is also entering into several new application fields,2 including backlights for liquid-crystal displays and portable electronics, automobile headlights, medical and architecture lighting, plant cultivation, etc.The dominating technique to achieve white light output in commercial wLEDs is the optical frequency conversion in the phosphor layer: typically, (Y,Gd)3(Al,Ga)5O12:Ce3+ (YAG:Ce) is dispersed in a transparent polymer matrix, and then, coated on a blue InGaN LED chip. The blue light from the LED is absorbed by the Ce3+ ions of YAG:Ce via the allowed 4f → 5d transition that generates the excited state, which then gives a wide-band yellow emission band through the inverse 5d → 4f transition. By combining the blue chip radiation and the yellow phosphor emission, the cool white light is obtained.3,4 Initially, YAG:Ce was proposed for use in displays in 1967,5 and later, it was quickly employed for white light generation when the bright blue InGaN diode was invented.6 Although applying YAG:Ce in wLEDs (patented by Nichia, Japan) is nearly ideal, there is still a strong drive in developing new yellow phosphors that can be considered as alternative candidates for YAG:Ce, so that wLED devices could be produced in an IP (intellectual patent)-complication free manner. For example, (Tb, Re)3(Al, Ga)5O12:Ce was developed by Osram to avoid IP-complication. The rapid development of new solid-state lighting devices also motivates the search for new phosphors with specific properties; studies reporting any ideas to discover/develop new phosphor are of high scientific interest. So far, several yellow (oxy)nitride phosphors excitable by blue LEDs, such as Ca-α-Sialon:Eu2+,7 (La,Ca)3Si6N11:Ce3+,8 Sr0.5Ba0.5Si2O2N2:Eu2+,9 have been reported; but the costly synthesis and the irreversible oxidation degradation of (oxy)nitrides are still the obstacle and weakness. In this paper, we report the development of new yellow oxide phosphor via the solid solution design, the emission feature of which is observed to be readily similar to that of YAG:Ce. The solid solution design starts with Lu3Al5O12:Ce (LuAG:Ce) where a wide-range Mg–Si for Al–Al substitution is performed to create the artificial garnet series of Lu3(Al,Mg)2(Al,Si)3O12:Ce3+.
The solid solution design in partial changes of the host compound through cation/anion,10–12 cation-pair,13 or chemical-unit substitition14 has been adopted as a way to tune the spectroscopic properties of Eu2+/Ce3+ which are ligand-sensitive activators in phosphors.15 In modern photonic technology, doping at, for example, the cation site, is widely used for tuning the structural, linear/nonlinear optical, ferroelectric and other physical properties of functional crystals.16–18 One doping element, as a rule, is applied to doping and the expected solid solution property can be speculated over the solubility range by different empirical relations. When two doping elements with different ion charges and radii are taken, the situation becomes more complicated and the solid solution behavior is less predictable, because, in many cases, the doping ion distribution over the crystallographic sites and the defect formation mechanism are unclear.19,20 Two doping elements with appropriate ion radii should be selected correlatively to maintain the electroneutrality of the crystal lattice and suppress the point defect generation. Frequently, the search for the optimal solid solution composition is nontrivial as more conditions should be fulfilled in parallel to reach the wide-concentration-range low-defect solid solution formation. Such observation in tuning these physical properties provides a hint at the photoluminescent solid solution composition design.
In a number of solid solution phosphor cases, desired tuning of a certain optical property has led to undesired negative trends in other significant properties; for example, the color rendering improvement was accompanied by a drop of quantum efficiency. Therefore, when developing new phosphors via the solid solution design, it is necessary to wisely choose the composition design strategy and the starting host. In our practice, several principles have been used to guarantee that the new phosphor creations are of: (1) ease in pure phase formation; (2) less defects generated in the crystal structure; (3) high quantum efficiency and (4) high thermal stability of emission. These rules, based on our experience, consist of (but not limited to) (1) starting with a crystal structure that associates with simple dopant-site geometry; (2) starting from a crystal structure that has a comparatively rigid framework; (3) starting with a phosphor that has the emission already close to a desired emission spectral position; (4) designing the substitution on a low-symmetry site; (5) designing the cation/anion substitution in equal valence and similar radius, or substitution using chemical units with an equal valence and a similar polyhedron size.
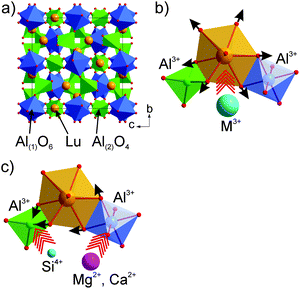
Here, LuAG:Ce is chosen as the starting composition to achieve the yellow emission. First, the garnet structure is, at present, the only known oxide host wherein the Ce3+ dopant can be effectively excited by blue light and emit in the green-orange spectral region with high quantum efficiency and high thermal stability. Reasonably, such advantages can be inherited by the solid solutions derived from it. Second, LuAG:Ce emits a green color, which makes it much easier to reach yellow emission via red-shift. Third, as seen in earlier studies, the garnet structure is comparatively stable in reference to various cation substitutions at the Lu3+ or Al3+ crystallographic sites. LuAG, in the cubic garnet structure (Fig. 1a), has a stoichiometric formula of Lu3Al(1)2Al(2)3O12 or Lu3Al(1)2[Al(2)O4]3, which can be generalized as A3B2C3O12 or A3B2(CO4)3. Atoms A occupy the 24c positions with point symmetry 222; its coordination polyhedron, a square antiprism, is built with eight coordinating oxygen atoms; atoms B occupy the 16a positions (symmetry of −3) in the oxygen octahedron centers, and atoms C occupy the 24d positions with symmetry 4 in the oxygen tetrahedron centers. The existence of three different oxygen polyhedrons, which considerably differ from each other in geometry and occupy ∼30% of the unit cell volume, opens a wide opportunity for the substitution design and provides the developed isomorphism.21
Theoretically, the spectral red-shift of the Ce3+ emission can be induced by a larger centroid shift, crystal field splitting or Stokes shift. From the compositional viewpoint, a higher lattice covalency such as using less electronegative N3− to replace O2− will benefit for such a purpose. As a case, the emission red-shift of Y3Al5O12:Ce3+ has been previously reported by introducing the Si4+–N3− bond into the lattice.22 However, such a red-shift induced simultaneously a severe drop in quantum efficiency and thermal emission stability. The O2− ion in Y3Al5O12 occupies the general site (96 h) which is highly multiplied with a lot of operation symmetry; substitution of O by N will generate too many defects and decrease the rigidity of the framework structure. Therefore, introduction of a foreign N ion into the O site is reasonable to increase the host lattice covalency but fails to be a wise choice for the emission red-shift. Alternatively, from the crystal structure viewpoint, compression of CeO8 may lead to a larger crystal field splitting and the aimed emission red-shift. Potential ways for the crystal structure modification via the solid solution design can be: (1) replacing Lu3+ at the dodecahedral site with bigger trivalent cations (Fig. 1b); for example, (Y,Lu)3Al5O12:Ce shows the green to greenish-yellow emission shift with increasing Y/Lu ratio;4,23 (2) replacing Al–Al in tetrahedral/octahedral coordinations with an equal-valence cation pair such as Mg(Ca)–Si (Fig. 1c); for example, the Mg–Si(Ge) incorporation into YAG has been seen to induce the red-shift effect.24 Compared with the first approach, the second one is more likely to save the structure stability because the tetrahedron (octahedron) expansion can be compensated by a nearby octahedron (tetrahedron) contraction, so that the unit cell volume variation is minimal.
Applying this way where Al(1) is partially replaced by Si, Ge or Ti, SiO4, GeO4 or TiO4 tetrahedra are formed; simultaneously, Al(2) is replaced by a divalent cation (for charge neutrality) like Ca/Mg, new garnet structural crystals, Lu2CaMg2(Si,Ge)3O12,25 Lu3Ca3Si3O12,26 Lu1.5Mg1.5Al3.5Si1.5O12,27 Lu2CaAl4SiO12,28 Lu2CaMg2Si3O12,29 (Lu,Ca)3(Sc,Mg)2Si3O12,30 LuCa2ScMgSi3O12,31 Lu2CaMg2Si2.9Ti0.1O12,32 and Lu3MgAl3SiO12,33,34 have been developed. The Mg–Si cation pair substitution of Al–Al in YAG:Ce, where red-shift of the emission is obtained, seems to be the most interesting variant.24 Therefore, in LuAG:Ce, the Mg–Si for Al–Al substitution with high probability could result in a stable garnet structure, and meanwhile, the emission can be tuned to be a pure yellow position. Thus, the new solid solution phosphors are designed as Lu3(Al2−xMgx)(Al3−xSix)O12:Ce3+ (x = 0.5–2.0) to see the substitution effect. Several critical parameters of the new phosphor for application in the blue LED-driven solid state white lighting including the emission/excitation, quantum efficiency, and thermal emission stability were evaluated.
Experimental
Lu2.97Ce0.03(Al2−xMgx)(Al3−xSix)O12 (x = 0–2.0) phosphors were prepared by firing the homogeneously ground mixtures of high purity oxides (>99.9%, Kanto Chemical Co., Tokyo, Japan), Lu2O3, Al2O3, MgO, SiO2, and CeO2, under H2(5%)–N2(95%) gas flow in an alumina tubular furnace at 1350 °C for 6 h. Phosphor compositions hereinafter quoted are the nominal ones.The powder XRD data were collected on an X-ray diffractometer (XRD) (Smartlab, Rigaku, Tokyo, Japan) with CuKα radiation (λ = 1.54056 Å), operating at 45 kV and 200 mA, and using the step size of 0.02° with a scan speed of 4° min−1. Crystal structure refinements employing the Rietveld method were implemented using TOPAS.35 The morphology of the phosphors was observed by field-emission scanning electron microscopy (FE-SEM, S4800, Hitachi, Tokyo, Japan). Photoluminescence spectra were recorded using a fluorescence spectrophotometer (F-4500, Hitachi, Tokyo, Japan) with a 200 W Xe-lamp as an excitation source. The thermal stability of the emission was investigated in the range of 30–200 °C using a combined setup consisting of a Xe-lamp, a Hamamatsu MPCD-7000 multichannel photodetector and a computer-controlled heater. The method to determine the internal and external quantum efficiency can be found in our previous publications.36,37 The wLED lamps were fabricated by Everfine Co., Hangzhou, China, using the as-prepared Lu3Mg0.5Al3Si0.5O12:Ce3+; the phosphor was mixed with blending resin (Dow Corning® OE2140) and then coated onto a blue InGaN LED chip (450 nm). The spatial radiation spectrum was measured using a goniophotometer (LED626, Everfine Co., Hangzhou, China). The optical properties of the wLEDs were evaluated using a spectroradiometer (LHS-1000, Everfine Co., Hangzhou, China).
Results and discussion
Crystal structure evolution
The phosphor series show bright green-to-yellow bodycolor under sunlight and the emission undergoes red-shift as per the Mg–Si incorporation. To explore the crystal structure evolution, Rietveld refinement analysis was performed on the powder XRD patterns, as shown in Fig. 2. All samples exhibit patterns similar to pure LuAG, but in the solid solution garnets, the diffraction peaks slightly shift to the lower 2θ angles. Almost all peaks of each pattern can be well indexed by a cubic cell (Ia![[3 with combining macron]](https://www.rsc.org/images/entities/char_0033_0304.gif) d) with parameters close to those of LuAG.38 The samples of x = 0 and 0.5 are phase-pure, while the patterns related to x = 1.0, 1.5 and 2.0 contain a small amount (<5 wt%) of Lu2SiO5. For the refinements, the crystal structure of LuAG was taken as a starting model: the C site (24d) was occupied by Al/Si ions, the B site (16a) was occupied by Al/Mg ions and the A site (24c) was occupied by Lu/Ce with fixed occupancies according to the nominal solid solution formulas. The processes were stable and ended with low R-factors, as provided in Table S1 (ESI†). The atom coordinates and main bond lengths are given in Tables S2 and S3 (ESI†), respectively.
d) with parameters close to those of LuAG.38 The samples of x = 0 and 0.5 are phase-pure, while the patterns related to x = 1.0, 1.5 and 2.0 contain a small amount (<5 wt%) of Lu2SiO5. For the refinements, the crystal structure of LuAG was taken as a starting model: the C site (24d) was occupied by Al/Si ions, the B site (16a) was occupied by Al/Mg ions and the A site (24c) was occupied by Lu/Ce with fixed occupancies according to the nominal solid solution formulas. The processes were stable and ended with low R-factors, as provided in Table S1 (ESI†). The atom coordinates and main bond lengths are given in Tables S2 and S3 (ESI†), respectively.
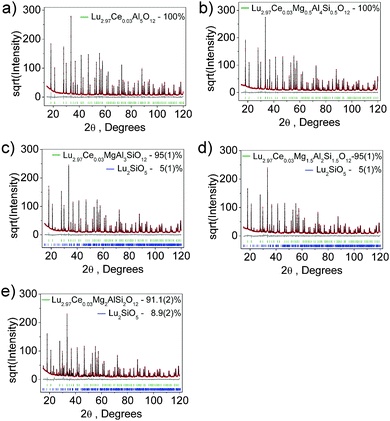 | ||
| Fig. 2 X-ray Rietveld refinement profiles for Lu3(Al2−xMgx)(Al3−xSix)O12:Ce3+, x = 0 (a), 0.5 (b), 1.0 (c), 1.5 (d) and 2.0 (e). | ||
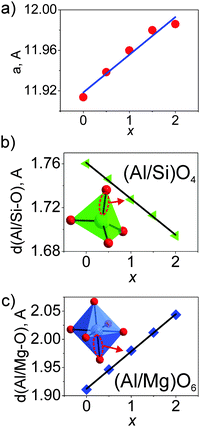
The cell parameters show a linear increase with increasing x (Fig. 3a), which confirms the suggested chemical formulas of these compounds, as the averaged effective ion radius (IR) of the Mg–Si pair is larger than that of Al–Al in respective octahedral and tetrahedral coordination. One can get IR (Mg–Si, CN = 4) = (0.57 + 0.26)/2 Å = 0.415 Å, but IR of Al (CN = 4) is 0.39 Å (CN: Coordination Number).39 At the same time, the linear decrease of d(Al/Si–O) bond lengths with increasing x (Fig. 3b and Table S3, ESI†) proves the incorporation of Si replacing a larger Al at the C site. In comparison, the linear increase of d(Al/Mg–O) bond lengths with increasing x (Fig. 3c and Table S3, ESI†) indicates the incorporation of bigger Mg replacing a smaller Al at the B site. Therefore, the proposed structural model is appropriate, and accordingly, the local structure evolution around the CeO8 polyhedron with x variation can be revealed, as depicted in Fig. 4.
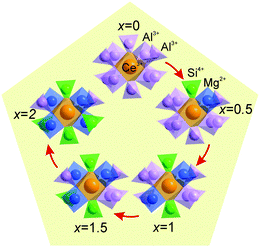 | ||
| Fig. 4 Local structure evolution around the CeO8 polyhedron upon the substitution of Mg–Si for Al–Al in LuAG:Ce. | ||
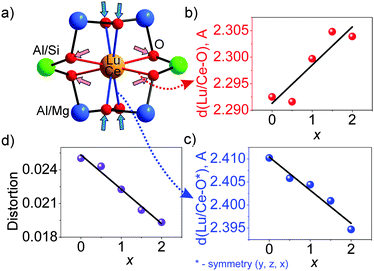
This model for local structure evolution enables us to explain the observed trend of the four increasing Lu/Ce–O bond lengths (Fig. 5b and Table S3, ESI†) and the other four decreasing Lu/Ce–O bond lengths (Fig. 5c and Table S3, ESI†) with the x increase. The preferable site occupation of the Si/Mg ions leads to the contraction of the (Al/Si)O4 tetrahedron and enlargement of the (Al/Mg)O6 octahedron with x increase. Accordingly, the O atom positions get shifts followed by the local structure variation around the Lu/Ce ions (Fig. 5a). Previously, such bond length evolution was assumed in an analogue study on Y3(Al2−xMgx)(Al3−xSix)O12:Ce3+,24 which gave them a way to explain the emission red-shift, but the structural variations have not been quantified. The bond length changes in the Lu3(Al2−xMgx)(Al3−xSix)O12:Ce3+ series are here identified for the first time.
The distortion of the (Lu/Ce)O8 polyhedron was then evaluated. Generally, three modes, the symmetric/asymmetric stretching (breathing), bending, or twisting, can cause displacement of (Lu/Ce)O8.34,40 In particular, the contribution of the bond length change to the polyhedron distortion can be quantitatively calculated using the equation,41D = (1/n)∑((Li − Lav)/Lav), where Li is the distance from the central atom to the i-th coordinating atom and Lav is the averaged bond length. As seen from Fig. 5d, the D value decreases with increasing x. This is due to the fact that the initially long d(Lu/Ce–O) bond lengths gradually decrease with increasing x (Fig. 5c), while the initially short d(Lu/Ce–O) bond lengths increase with the increase of x (Fig. 5b). As a result, all the (Lu/Ce–O) bond lengths are becoming closer to the averaged value, and the distortion of the (Lu/Ce)O8 polyhedron decreases if solely considering the effect of the bond length variation. Moreover, it should be noted that not only the bond length change leads to the polyhedron distortion: synchronously with the bond length uniforming, the bond angles also change with increasing x. The two bond angle groups vary in the opposite directions (Fig. 6). This process also distorts the (Lu/Ce)O8 square antiprism and somewhat changes the local crystal field strength on Ce3+.
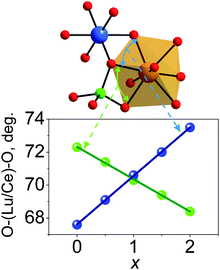 | ||
| Fig. 6 The evolution of O–Lu(Ce)–O bond angles with increasing x in Lu3(Al2−xMgx)(Al3−xSix)O12:Ce3+. | ||
Micro-morphology
The morphology of the Lu3(Al2−xMgx)(Al3−xSix)O12:Ce3+ (x = 0.5) phosphor was observed (Fig. 7). The powder products of the solid state reaction, after post-grinding, contain microcrystalline particles with different sizes (1–8 μm) and morphologies (Fig. 7a). Those relatively big ones mainly consist of aggregated grains with a diameter of 1–2 μm (Fig. 7b), and these grains tend to be of semi-spherical shape due to the intrinsic cubic garnet structure-governed crystallization. To meet the requirement for advanced wLED application, it is necessary to reduce/eliminate the aggregation by further synthesis optimization of the solid state reaction or employing other synthesis options such as spray-pyrolysis, co-precipitation or sol–gel.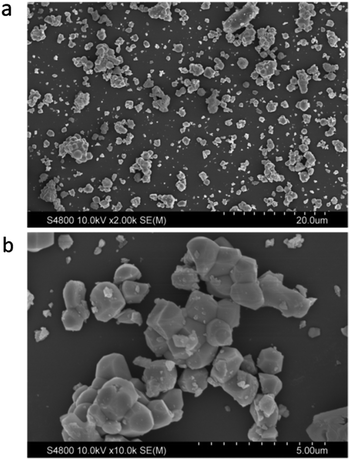 | ||
| Fig. 7 (a) SEM image of the phosphor particles; (b) enlarged image showing phosphor grain aggregation in a particle. | ||
It is suggested that well-dispersion of fine phosphor particles with spherical morphology will have less scattering of incident light from LEDs and benefit for the efficiency performance. Recently, a pressure-stimulated method (1623 K for 5 h under a N2–H2 gas pressure of 1.5 × 10⁷ Pa)4 was used to synthesize YAG/LuAG phosphors with a faceted particle of low surface defect concentration. This method may be potentially used for the preparation of Lu3(Al,Mg)2(Al,Si)3O12:Ce.
Photoluminescence property
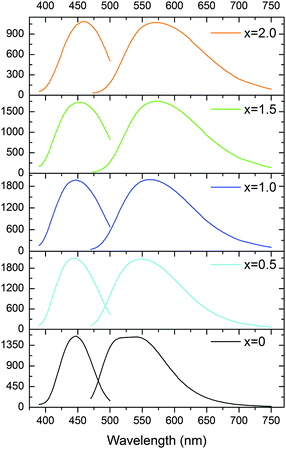
The body-color change of the phosphor series suggests the emission red-shift, which can be confirmed by the excitation/emission spectra (Fig. 8). The x = 0 sample exhibits a wide asymmetric emission band with two peaks at 512 nm and 542 nm under λex = 450 nm; the well-resolved double-peak emission originates from the transitions from the lowest Ce3+ 5d excited state to the two 4f ground state levels (2F5/2 and 2F7/2) split by the spin–orbit coupling effect. As the Mg–Si pair is incorporated, the maximum emission gradually red-shifts from 542 nm (x = 0) to 571 nm (x = 2.0). The x = 1.5 and 2.0 samples show very similar emission properties, though the maximum excitation peak slightly shifts from 456 nm to 462 nm. It is seen that the x = 0.5 sample possesses the peaking emission wavelength of 550 nm, which is already close to the emission of typical YAG:Ce phosphor.42 The fwhm (full-width at half-maximum) of this emission is seen to be 122 nm. Under the identical excitation, the x = 0.5 sample exhibits the highest emission intensity among this phosphor series.The energy position of the Ce3+ 4f65d1 excited state and the 4f7 → 4f65d1 transition in the inorganic host will be modified by the case-sensitive covalence and polarizability of the Ce-ligand interaction,43 as the Ce 5d electron is exposed to its surrounding ligands. The introduction of the Mg–Si pair alters the Ce–O bond lengths (four bond lengths increase and four bond lengths decrease), and the as-observed “sum” effect of this structural evolution is the shift of the emission transitions towards lower photon energies (Fig. 8). We tried to probe the energy structure of the Ce 5d and 4f levels in Lu3(Al,Mg)(Al,Si)O12:Ce3+ by analyzing the excitation and emission spectra using band-deconvolution by Gaussian components,44 but the Gaussian fitting gave unsuitable results. The reason can be that the Ce3+ ions occupy the sites with the cubic-like symmetry but with a high distortion degree; besides, the complicated composition would make the as-synthesized samples more likely to contain different kinds of inherent defects and Ce3+ ions in the host lattice slightly differ from each other regarding the specific local environment (such as bond length, bond–bond angle).34 Therefore, the PL spectrum of the x = 0 sample clearly consists of two peaks but that of the solid solution derivatives becomes to be of the Gaussian type despite being slightly asymmetric.
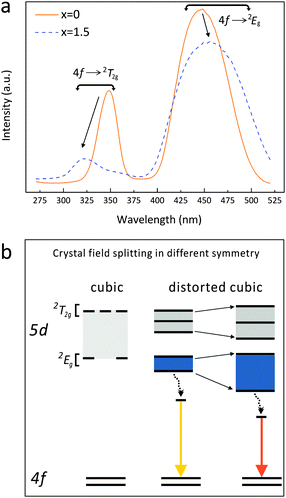
Though it is difficult to quantify the Ce3+ 5d energy level structure in this series, it is evident that the 4f → 2T2g (higher energy levels of the 5d excited state) excitation band shifts to the shorter wavelengths, while the 4f → 2Eg (lower energy levels of the 5d excited state) excitation band shifts to longer wavelengths when x increases from 0 to 1.5 (Fig. 9a). Thus, the energy difference between the 4f7 ground states and the lowest 4f65d1 excited state reduces, suggesting a stronger crystal field splitting effect on the Ce 5d orbital energy. Besides, the broadening of the energy transition bands (Table 1 and Fig. 8) indicates a higher diversity of local environments of Ce3+ ions in the highly Mg–Si doped garnets, which offsets the average coordinating situation identified by the XRD plus the Rietveld refinement.
| x | λ ex (nm) | λ em (nm) | fwhm (nm) | Stokes shift (cm−1) |
|---|---|---|---|---|
| 0 | 447 | 542 | 110 | 3783 |
| 0.5 | 447 | 551 | 122 | 3883 |
| 1.0 | 448 | 562 | 129 | 3931 |
| 1.5 | 455 | 571 | 133 | 3911 |
| 2.0 | 460 | 571 | 136 | 3987 |
The 5d level of Ce3+ splits into two groups of excited states (2T2g and 2Eg) when occupying a site with ideal cubic symmetry. If the cubic symmetry is distorted, the 2T2g and 2Eg states further split into five sub-levels. With Mg–Si substitution for Al–Al in the garnet phosphors, the structure distortion degree decreases (if the effect of the bond angle variation on the CeO8 distortion is neglected) while the crystal field splitting of Ce3+ increases (Fig. 9a). Such an effect leads to the observed 4f → 2Eg excitation transition shifting to lower energies (longer wavelengths) and the red-shift of the 5d → 4f emission transition from green to yellow. Based on such transition paths, the energy level scheme for Ce3+ in Lu3(Al,Mg)(Al,Si)O12:Ce3+ is accordingly proposed, as depicted in Fig. 9(b).
The Stokes shift is also roughly estimated, i.e., by the energy difference between the maximums of the excitation and emission. The Stokes shift (listed in Table 1) is in the range of 3783–3987 cm−1, which, together with the increased crystal field splitting, contributes to the emission red-shift of Lu3(Al,Mg)(Al,Si)O12:Ce compared with LuAG:Ce.
Thermal stability of emission
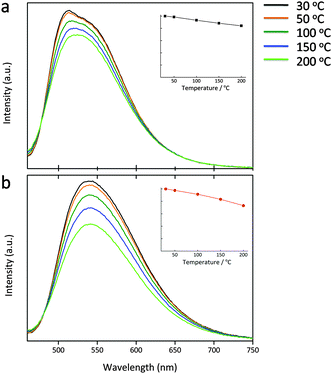
Lu3(Al2−xMgx)(Al3−xSix)O12:Ce3+ (x = 0, 0.5) were subjected to the temperature-dependent emission measurements over a test range of 30–200 °C (Fig. 10). Due to the thermal quenching effect, the emission intensity shows a continuous decrease upon the temperature increase. When it turns up to 150 °C, the peak intensity of the x = 0 and 0.5 phosphors becomes 86% and 83% of those recorded at 30 °C. With the Mg–Si introduction, the thermal emission stability decreases, perhaps due to the narrowed band gap of the host and the increased Ce3+ crystal field splitting, which reduces the energy displacement between the host conduction band and the Ce 5d levels, and the thermal-assisted ionization becomes easier. Anyway, such performance still remains to be relatively good. The maximum emission is nearly constant upon the temperature variation which benefits for providing the stable luminous performance of a wLED lamp.Quantum efficiency
Besides the desired emission/excitation spectra, quantum efficiency (QE) is another critical criterion for a new phosphor. The QE values under the excitation of 450 nm are provided in Table 2. The IQE values are ranging from 89% to 66%, which show a continuous decrease when a higher Mg–Si quantity is introduced; however, due to the increasing absorption efficiency, the EQE values of the phosphors firstly increase and then slightly decrease, as compared with the initial LuAG:Ce composition. For the x = 0.5 phosphor, the absorption, internal and external quantum efficiencies are 57.9%, 85.1% and 49.3%, respectively.| Phosphor | Absorption (%) | IQE (%) | EQE (%) |
|---|---|---|---|
| x = 0 | 47.0 | 89.1 | 41.8 |
| x = 0.5 | 57.9 | 85.1 | 49.3 |
| x = 1.0 | 58.9 | 80.5 | 47.4 |
| x = 1.5 | 61.7 | 70.8 | 43.7 |
| x = 2.0 | 58.6 | 66.4 | 39.0 |
Luminescence performance of white LEDs
White LED lamps were fabricated by combining a blue LED chip with the Lu3Mg0.5Al4Si0.5O12:Ce3+ phosphor. A reference lamp employing a commercial yellow phosphor was also fabricated. As seen from the electroluminescence spectra (Fig. 11), the primary emission bands are centered at 450 nm and ∼550 nm, respectively. The two emission bands constitute a spectrum that appears white to the naked eye. The two lamps show luminous efficacies of 105 lm W−1 (lamp 1) and 139 lm W−1 (reference lamp), respectively. The CIE color coordinates, the correlated color temperature (CCT) and the color rendering index (CRI) are provided in Table 3. The lamp using the as-developed yellow phosphor emits cool white light (6164 K) with a moderate CRI (Ra) value of 75.6. The CCT and the CRI can be further tuned by varying the x value of the solid solution formula, and the luminous efficacy is readily improved by enhancing the absorption efficiency of the phosphors.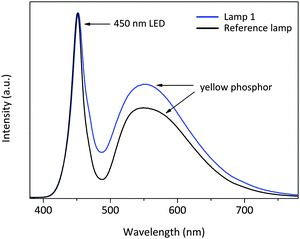 | ||
| Fig. 11 Electroluminescence spectra (normalized at the chip emission) of the wLEDs encapsulated with a blue LED and the Lu3Mg0.5Al4Si0.5O12:Ce3+ or a commercial yellow phosphor. | ||
| Lamp | Luminous efficacy (lm W−1) | CIE color coordinates (x, y) | Correlated color temperature (K) | Color rendering index (Ra) |
|---|---|---|---|---|
| Lamp 1 | 105 | (0.3171, 0.3505) | 6164 | 75.6 |
| Reference lamp | 139 | (0.3178, 0.3325) | 6216 | 73.6 |
Further improvement and comparison with commercial LuAG:Ce
As a tentative try, following a recently reported pressure-stimulated method,4 new phosphor samples with a nominal composition of Lu2.95Ce0.05(Al2−xMgx)(Al3−xSix)O12 were prepared at 1450 °C for 4 h under a N2 pressure of 1 MPa (digital images shown in Fig. 12). The samples exhibit improved emission intensity compared with the previous ones. The LuAG-derived x = 0.5 and x = 1.0 compositions are then compared with a commercial LuAG:Ce product. As seen from Fig. 13, under the same excitation by 450 nm blue light, the x = 0.5 and 1.0 compositions show a yellow emission which is much red-shifted and broader compared with the commercial LuAG:Ce. While, the integrated emission intensities of the two compositions are 83.5% and 79.8% of the commercial LuAG, respectively, which suggests a relatively good performance. Thus, (Lu,Ce)3(Al2−xMgx)(Al3−xSix)O12 (0.5 ≤ x ≤ 1.0) is promising to act as a yellow color converter; and further optimization on aspects of synthesis, Ce concentration, crystallinity/defect and particle size/morphology is necessary prior to commercial consideration.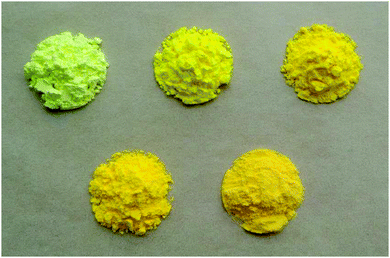 | ||
| Fig. 12 Digital images of the as-prepared Lu2.95Ce0.05(Al2−xMgx)(Al3−xSix)O12 (x = 0, 0.5, 1.0, 1.5, 2.0) phosphors under sunlight. The sample body-color turns from green to orange as x increases. | ||
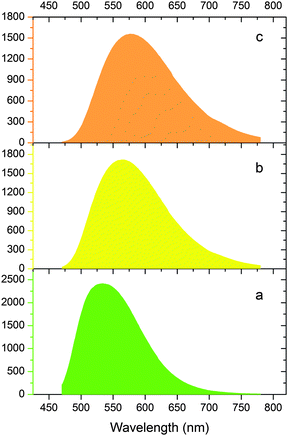 | ||
| Fig. 13 Emission comparison (λex = 450 nm) between a commercial LuAG:Ce product (a), and the as-prepared x = 0.5 (b) and x = 1.0 (c) phosphor samples. | ||
Conclusions
A set of Lu3(Al2−xMgx)(Al3−xSix)O12:Ce3+ garnet phosphors were developed by solid solution design through the Mg–Si pair substitution for Al–Al in LuAG:Ce. Incorporation of the Mg–Si pair into the garnet structure enlarges the unit cell and alters the local coordinating environment around Ce3+. The emission band maximum under λex = 450 nm shows the red-shift from 542 nm to 571 nm upon composition variation due to the increased crystal field splitting of 5d energy levels and Stokes shifts. The internal and external quantum efficiencies of the as-prepared Lu3Mg0.5Al4Si0.5O12:Ce3+ phosphor under λex = 450 nm are measured as 85% and 49%, respectively. The emission peak intensity of Lu3Mg0.5Al4Si0.5O12:Ce3+ at 150 °C decreased to be 83% of the initial value at 30 °C, indicating a relatively good thermal stability. The 1-phosphor-converted wLED lamp fabricated employing the Lu3Mg0.5Al4Si0.5O12:Ce3+ phosphor exhibits a luminous efficacy of 105 lm W−1, a correlated color temperature of 6164 K, and a color rendering index (Ra) of 75.6, suggesting the relatively high potential to be applied in practical solid state lighting after further enhancement of the external quantum efficiency. The optimization of the new compositions Lu3(Al2−xMgx)(Al3−xSix)O12 (0.5 ≤ x ≤ 1.0) calls for more efforts.Acknowledgements
This work was partially supported by the National Natural Science Foundations of China (Grant No. 51511130035, 51272259, 61575182, 51561135015, and 51572232) and the Russian Foundation for Basic Research (Grant No. 15-52-53080). We are also grateful to financial support from the JSPS KAKENHI (No. 15K06448). H. J. thanks the China Scholarship Council (CSC) for scholarship support. V. V. A. was partially supported by the Ministry of Education and Science of the Russian Federation.References
- S. Pimputkar, J. S. Speck, S. P. DenBaars and S. Nakamura, Nat. Photonics, 2009, 3, 180–182 CrossRef CAS.
- P. Pust, P. J. Schmidt and W. Schnick, Nat. Mater., 2015, 14, 454–458 CrossRef CAS PubMed.
- Y. Tian, J. Solid State Light., 2014, 1, 11 CrossRef.
- V. V. Atuchin, N. F. Beisel, E. N. Galashov, E. M. Mandrik, M. S. Molokeev, A. P. Yelisseyev, A. A. Yusuf and Z. Xia, ACS Appl. Mater. Interfaces, 2015, 7, 26235–26243 CAS.
- G. Blasse and A. Bril, Appl. Phys. Lett., 1967, 11, 53–55 CrossRef CAS.
- S. Nakamura, T. Mukai and M. Senoh, Appl. Phys. Lett., 1994, 64, 1687–1689 CrossRef CAS.
- R. J. Xie, N. Hirosaki, K. Sakuma, Y. Yamamoto and M. Mitomo, Appl. Phys. Lett., 2004, 84, 5404–5406 CrossRef CAS.
- T. Suehiro, N. Hirosaki and R. J. Xie, ACS Appl. Mater. Interfaces, 2011, 3, 811–816 CAS.
- L. Wang, H. Zhang, X. J. Wang, B. Dierre, T. Suehiro, T. Takeda, N. Hirosaki and R. J. Xie, Phys. Chem. Chem. Phys., 2015, 17, 15797–15804 RSC.
- H. Ji, Z. Huang, Z. Xia, M. S. Molokeev, V. V. Atuchin, M. Fang and S. Huang, Inorg. Chem., 2014, 53, 5129–5135 CrossRef CAS PubMed.
- H. Ji, Z. Huang, Z. Xia, M. S. Molokeev, V. V. Atuchin and S. Huang, Inorg. Chem., 2014, 53, 11119–11124 CrossRef CAS PubMed.
- H. Ji, Z. Huang, Z. Xia, M. S. Molokeev, V. V. Atuchin, M. Fang and Y. Liu, J. Phys. Chem. C, 2015, 119, 2038–2045 CAS.
- Z. Xia, Y. Zhang, M. S. Molokeev, V. V. Atuchin and Y. Luo, Sci. Rep., 2013, 3, 3310 Search PubMed.
- Z. Xia, C. Ma, M. S. Molokeev, Q. Liu, K. Rickert and K. R. Poeppelmeier, J. Am. Chem. Soc., 2015, 137, 12494–12497 CrossRef CAS PubMed.
- G. Li, Y. Tian, Y. Zhao and J. Lin, Chem. Soc. Rev., 2015, 44, 8688–8713 RSC.
- V. V. Atuchin, B. G. Bazarov, T. A. Gavrilova, V. G. Grossman, M. S. Molokeev and Z. G. Bazarova, J. Alloys Compd., 2012, 515, 119–122 CrossRef CAS.
- I. Savatinova, I. Savova, E. Liarokapis, C. C. Ziling, V. V. Atuchin, M. N. Armenise and V. M. N. Passaro, J. Phys. D: Appl. Phys., 1998, 31, 1667 CrossRef CAS.
- H. Jo, Y. H. Kim, D. W. Lee and K. M. Ok, Dalton Trans., 2014, 43, 11752–11758 RSC.
- Z. Xia, G. Liu, J. Wen, Z. Mei, M. Balasubramanian, M. S. Molokeev, L. Peng, L. Gu, D. J. Miller, Q. Liu and K. R. Poeppelmeier, J. Am. Chem. Soc., 2016, 138, 1158–1161 CrossRef CAS PubMed.
- V. V. Atuchin, C. C. Ziling, I. Savatinova, M. N. Armenise and V. M. N. Passaro, J. Appl. Phys., 1995, 78, 6936–6939 CrossRef CAS.
- B. V. Mill, G. Ronniger and Y. K. Kabalov, Russ. J. Inorg. Chem., 2014, 59, 1208–1213 CrossRef CAS.
- A. A. Setlur, W. J. Heward, M. E. Hannah and U. Happek, Chem. Mater., 2008, 20, 6277–6283 CrossRef CAS.
- J. Li, X. Su, X. Li, S. Liu and Q. Zhu, J. Inorg. Mater., 2015, 30, 177–182 CrossRef CAS.
- M. Shang, J. Fan, H. Lian, Y. Zhang, D. Geng and J. Lin, Inorg. Chem., 2014, 53, 7748–7755 CrossRef CAS PubMed.
- A. A. Setlur, W. J. Heward, Y. Gao, A. M. Srivastava, R. G. Chandran and M. V. Shankar, Chem. Mater., 2006, 18, 3314–3322 CrossRef CAS.
- K. V. Ivanovskikh, A. Meijerink, F. Piccinelli, A. Speghini, E. I. Zinin, C. Ronda and M. Bettinelli, J. Lumin., 2010, 130, 893–901 CrossRef CAS.
- Y. Jia, Y. Huang, N. Guo, H. Qiao, Y. Zheng, W. Lv, Q. Zhao and H. You, RSC Adv., 2012, 2, 2678–2681 RSC.
- A. Katelnikovas, J. Plewa, D. Dutczak, S. Möller, D. Enseling, H. Winkler, A. Kareiva and T. Jüstel, Opt. Mater., 2012, 34, 1195–1201 CrossRef CAS.
- G. Li, D. Deng, Y. Li, Q. Wang, Y. Hua and S. Xu, J. Rare Earths, 2012, 30, 193–196 CrossRef CAS.
- Y. Liu, X. Zhang, Z. Hao, Y. Luo, X. Wang and J. Zhang, J. Lumin., 2012, 132, 1257–1260 CrossRef CAS.
- X. Zhang, Y. Liu, Z. Hao, Y. Luo, X. Wang and J. Zhang, Mater. Res. Bull., 2012, 47, 1149–1152 CrossRef CAS.
- Y. Chu, Q. Zhang, J. Xu, Y. Li and H. Wang, J. Solid State Chem., 2015, 229, 213–218 CrossRef CAS.
- Y. Shi, G. Zhu, M. Mikami, Y. Shimomura and Y. Wang, Dalton Trans., 2015, 44, 1775–1781 RSC.
- H. Ji, L. Wang, M. Molokeev, N. Hirosaki, Z. Huang, Z. Xia, O. M. ten Kate, L. Liu and R. J. Xie, J. Mater. Chem. C, 2016, 4, 2359–2366 RSC.
- TOPAS V4.2: General profile and structure analysis software for powder diffraction data-User's Manual, Bruker AXS, Karlsruhe, Germany, 2008 Search PubMed.
- C. Zhang, T. Uchikoshi, R. J. Xie, L. Liu, Y. Cho, Y. Sakka, N. Hirosaki and T. Sekiguchi, J. Mater. Chem. C, 2015, 3, 7642–7651 RSC.
- Q. Q. Zhu, X. J. Wang, L. Wang, N. Hirosaki, T. Nishimura, Z. F. Tian, Q. Li, Y. Z. Xu, X. Xu and R. J. Xie, J. Mater. Chem. C, 2015, 3, 10761–10766 RSC.
- F. Euler and J. A. Bruce, Acta Crystallogr., 1965, 19, 971–978 CrossRef CAS.
- R. Shannon, Acta Crystallogr., Sect. A: Cryst. Phys., Diffr., Theor. Gen. Crystallogr., 1976, 32, 751–767 CrossRef.
- L. Seijo and Z. Barandiarán, Opt. Mater., 2013, 35, 1932–1940 CrossRef CAS.
- W. Baur, Acta Crystallogr., Sect. B: Struct. Crystallogr. Cryst. Chem., 1974, 30, 1195–1215 CrossRef CAS.
- V. Bachmann, C. Ronda and A. Meijerink, Chem. Mater., 2009, 21, 2077–2084 CrossRef CAS.
- J. Li and Y. Sakka, Sci. Technol. Adv. Mater., 2015, 16, 014902 CrossRef.
- W. B. Im, N. N. Fellows, S. P. DenBaars, R. Seshadri and Y.-I. Kim, Chem. Mater., 2009, 21, 2957–2966 CrossRef CAS.
Footnote |
| † Electronic supplementary information (ESI) available: Crystallographic information files (CIFs) of the compounds; main parameters of Rietveld refinements of the XRD patterns; atomic coordinates and main bond lengths of the compounds. See DOI: 10.1039/c6tc00966b |
| This journal is © The Royal Society of Chemistry 2016 |

