 Open Access Article
Creative Commons Attribution 3.0 Unported Licence
Chemical vapour deposition of rhenium disulfide and rhenium-doped molybdenum disulfide thin films using single-source precursors†
Naktal
Al-Dulaimi
a,
David J.
Lewis
ab,
Xiang Li
Zhong
b,
M.
Azad Malik
b and
Paul
O'Brien
*ab
aSchool of Chemistry, The University of Manchester, Oxford Road M13 9PL, UK. E-mail: Paul.O’Brien@manchester.ac.uk; Tel: +44 (0)161 275 4652
bSchool of Materials, The University of Manchester, Oxford Road, M13 9PL, UK
First published on 25th February 2016
Abstract
Polycrystalline thin films of rhenium disulfide (ReS2) and the alloys Mo1−xRexS2 (0 ≤ x ≤ 0.06) have been deposited by aerosol-assisted chemical vapour deposition (AA-CVD) using [Re(μ-SiPr)3(SiPr)6] (1) and [Mo(S2CNEt2)4] (2) in different molar ratios at 475 °C. The deposited films were characterised by p-XRD, SEM, and ICP-OE, Raman, and EDX spectroscopies. The p-XRD patterns of the films deposited from (1) correspond to ReS2 (x = 1) and those deposited from (2) matched to MoS2 (x = 0). Re-doping of up to 6% was achieved in MoS2 thin films by using different concentrations of precursor (1), the morphology of the doped films changed from lamellar for pure MoS2 to clusters at 6 mol% alloying with rhenium. The films are promising candidates as models for the incorporation of technetium into transition metal dichalcogenides as a means of immobilisation in nuclear waste processing. Exfoliation of these films is also a potential route towards modification of the optoelectronic properties of 2D molybdenite.
Introduction
Two-dimensional transition metal dichalcogenides (TMDCs) which have the general formula MX2, including molybdenum disulfide (MoS2), tungsten disulfide (WS2), and tungsten diselenide (WSe2) have attracted interest because of their optoelectronic properties in monolayer form1–3 with useful carrier mobilities and mechanical flexibility.4–9 MoS2, in particular, has attracted considerable attention because of its potential applications in hydrogen storage, solid lubricants, capacitors, and electrochemical devices.10–14 MoS2 can also be used as a catalyst (e.g. in hydrogen evolution reactions) due to its high-energy crystal edges.15 The structure of bulk MoS2 is akin to that of graphite in terms of a repeating layer structure,16 held together by non-covalent interactions. 2H-MoS2 bulk shows a change from an indirect bandgap to a direct bandgap as the 1H-MoS2 monolayer form is approached,15 as per MoSe2, WSe2, and WS2.17,18 MoS2 thin films have been synthesised by aerosol assisted chemical vapour deposition (AA-CVD) using metal dithiocarbamate-based precursors.19 Thin films of MoS2 doped with Re have been previously synthesised by using spray pyrolysis.20 We and others have recently developed a general approach to doping MoS2 with transition metal cations such as chromium based on AA-CVD.21,22Rhenium disulfide (ReS2) has a direct bandgap which remains as such in the monolayer form unlike most other TMDCs. Few, if any, changes are observed in the Raman spectrum of monolayer ReS2 compared to bulk and few-layer variants.23 Transition metal doped ReS2 has been reported.24 Single crystals of Mo-doped ReSe2 have been synthesised by chemical vapour transport method with bromine as a transport agent.25 The growth of ReS2 monolayers has been achieved using CVD at 450 °C, the as-deposited ReS2 is an n-type semiconductor.26 Colloidal ReS2 nanoparticles have also been prepared.27 Two-dimensional nanosheets of ReS2 have been synthesised by lithium intercalation, and have unique photocatalytic properties which can potentially be superior to other two-dimensional materials.28 Large area deposition of ReS2 sheets with good crystallinity has been achieved using simple CVD, from ReO3 treated with elemental sulfur vapour at 500 °C.29
Rhenium-doped MoS2 can potentially be used as a model for immobilization of radioactive technetium-99 (99Tc).30 Technetium-99 is very mobile in water hence there is concern about its release into the environment. In 2008 the production of 99Tc was close to 290 metric tonnes worldwide.31 Technetium-99 is produced from uranium fission, and is present in nature at a very low level.3299Tc has a long half-life (ca. 2 × 10⁵ years), and it forms about 6% of the fission product from uranium.33,34 The relatively short-lived isotope 99mTc is a widely used radionuclide in nuclear medicine.35
The ionic radii of Tc(IV), Re(IV) and Mo(IV) are 0.65, 0.63 and 0.65 Å respectively, whilst the Shannon–Prewitt crystal radii of Tc(IV), Re(IV) and Mo(IV) are also similar, 0.79, 0.77 and 0.79 Å respectively.36 The Gibbs free energy change associated with the formation of the M(IV) oxidation state from elemental rhenium and technetium are ΔG = 1.3F and 1.1F kJ mol−1 respectively, where F is the Faraday constant.37 Hence from these data it may be surmised that isovalent substitution of Re into MoS2 may be performed without significant induced strain in the lattice and minimal free energy penalty from disruption of the host lattice and that rhenium(IV) is a good model for technetium(IV). Entrainment of Re into host structures such as iron phosphate glasses is also known38
In this paper we report the deposition of Mo1−xRexS2 (0 ≤ x ≤ 0.06) alloyed thin films using AA-CVD from Mo and Re single source precursors. Molybdenite exists usually as the 2H stacked (ABA) polytype (P63mmc).39,40 Rhenium disulfide has a different layered structure that is classified in the P![[1 with combining macron]](https://www.rsc.org/images/entities/char_0031_0304.gif) space group,41 of much lower symmetry than most transition metal dichalcogenides which seems to be driven by the participation of each d3-Re ion bonding to three others in the same layer which results in the formation of Re4 parallelograms, with vertices linked in a linear fashion throughout the sheet. The Re-based parallelograms dictate the relative displacements of the sulfur atoms in the hexagonal close packed arrays, and due to this, the sulfur atoms in the layer are rippled on the sheet surface, in contrast to MoS2, where the sulfur layers appear smooth. At low levels of rhenium incorporation we find that the parent molybdenite structure holds due to the aforementioned similarities in crystal radii and the thermodynamic similarities in their +4 oxidation state. Significantly, this makes Re-doped MoS2 a potentially useful model system for understanding the thermodynamic stability of 99Tc in a host molybdenum disulfide lattice which will be of particular interest in nuclear chemistry for storage capability-building using inert materials that do not leach radioactive material. This is the first example of single source precursors being used to produce such materials.
space group,41 of much lower symmetry than most transition metal dichalcogenides which seems to be driven by the participation of each d3-Re ion bonding to three others in the same layer which results in the formation of Re4 parallelograms, with vertices linked in a linear fashion throughout the sheet. The Re-based parallelograms dictate the relative displacements of the sulfur atoms in the hexagonal close packed arrays, and due to this, the sulfur atoms in the layer are rippled on the sheet surface, in contrast to MoS2, where the sulfur layers appear smooth. At low levels of rhenium incorporation we find that the parent molybdenite structure holds due to the aforementioned similarities in crystal radii and the thermodynamic similarities in their +4 oxidation state. Significantly, this makes Re-doped MoS2 a potentially useful model system for understanding the thermodynamic stability of 99Tc in a host molybdenum disulfide lattice which will be of particular interest in nuclear chemistry for storage capability-building using inert materials that do not leach radioactive material. This is the first example of single source precursors being used to produce such materials.
Experimental section
All reactions were carried out under dry nitrogen atmosphere using standard Schlenk techniques. Solvents were purchased from Sigma-Aldrich or Fisher and used without further purification. Reagents were purchased from Sigma-Aldrich.Instrumentation
Elemental analysis was performed by the University of Manchester micro-analytical laboratory. A Seiko SSC/S200 model was used for TGA measurements with a heating rate of 10 °C min−1 under nitrogen. Scanning electron microscopy (SEM) was performed in secondary electron mode with a Zeiss Ultra55 microscope with an accelerating voltage of 10 kV. Energy-dispersive X-ray (EDX) spectroscopy was performed on the same system at an accelerating voltage of 30 kV using an Oxford Instruments INCA pentaFETx3 detector. Transmission electron microscopy (TEM) was performed on a FEI Tecnai G2 operating at 200 kV. Nuclear magnetic resonance (NMR) spectra were recorded using a 400 MHz Bruker spectrometer. A Bruker D8 AXE diffractometer was used to record p-XRD patterns, equipped with a Cu-Kα source (1.5406 Å). Thin films were scanned between 10 and 80° with step size 0.02° and a dwell time of 3 s.Synthesis of rhenium nonachloride (Re3Cl9)
The apparatus was dried by heat gun in a stream of dry nitrogen, and then was moved with the stopcock closed into a glove bag. Rhenium pentachloride (ReCl5, 2.35 g) was added into the tube and moved from the glove bag and clamped, with a moderate stream of N2. The tube was heated in a slow Bunsen burner flame, after that the ReCl5 started to melt and the vapour was under reflux. Brown fumes were observed to be liberated. Heating was stopped during the reaction at regular intervals to harvest the crystals which were formed on the wall of tube. This process was repeated until no more brown fumes were liberated and only solid remained.42 The apparatus was allowed to cool, and the tube sealed off and moved to a nitrogen filled glove bag to transfer the product, a black-red solid, into an ampoule. Yield: 72%. Anal. calc. for Re3Cl9 (%): Re, 63.65; Cl, 36.65. Found (%): Re, 61.63; Cl, 36.57.Synthesis of (Re3Cl9(THF)3)
Re3Cl9(THF)3 was prepared as previously reported,43 Re3Cl9 (2.3 g, 2.6 mmol) was placed into a thimble in the Soxhlet, then Re3Cl9 was extracted from a Soxhlet thimble by refluxing with THF (40 mL) under nitrogen over 48 h or more until the solvent passing through the thimble became colorless. The THF solvent was evaporated and then dark purple solid was collected and washed with diethyl ether (2 × 20 mL). Traces of solvent were removed in vacuo to furnish the title product. Yield: 58%. IR (νmax/cm−1): 2956 (w) 1481 (w), 1442 (w), 1336 (w), 1042 (w), 1014 (m), 917 (w), 839 (s), 686 (w).Synthesis of rhenium iso-propylthiolate Re3(μ-SPri)3(SPri)6, (1)
This compound was prepared using the method of Cohen and co-workers.44 Briefly, Re3Cl9(THF)3 (1.7 g, 1.5 mmol) was dissolved in of THF (140 mL). Sodium isopropylthiolate (1.7 g, 17.8 mmol) was added to the red solution of Re3Cl9(THF)3. This mixture was refluxed for 48 h after which the THF was removed under reduced pressure. The resulting solid was then extracted with hexane (5 × 20 mL); the combined organic phase was filtered through Celite, the solvent was removed by reduced pressure then dried by vacuum oven overnight. Yield: 55%. Anal. calc. for Re3S9C27H63 (%) C, 26.28; H, 5.14; found (%) C, 25.82; H, 5.77. 1H NMR (CDCl3, 400 MHz,) δ/ppm: 1.18 (d, J = 6.81 Hz, 3H, SCHMe2), 1.21 (d, J = 6.81 Hz, 3H, SCHMe2) 1.23 (d, J = 6.56 Hz, 3H, SCHMe2) 1.27 (d, J = 6.81 Hz, 3H, SCHMe2), 1.37 (d, J = 6.81 Hz, 4H, SCHMe2), 1.42 (d, J = 6.81 Hz, 4H, SCHMe2), 1.58 (d, J = 6.81 Hz, 4H, SCHMe2), 1.70 (d, J = 4.29 Hz, 3H, SCHMe2), 1.71 (d, J = 4.29 Hz, 3H, SCHMe2), 2.84–2.96 (septet, 1H, SCHMe2), 3.40–3.53 (septet, 1H, SCHMe2), 3.55–3.67 (septet, 1H, SCHMe2), 3.99–4.12 (septet, 1H, SCHMe2), 4.19–4.32 (septet, 1H), 4.34–4.45 (septet, 1H, SCHMe2), 13C NMR {1H} (CDCl3, 101 MHz) δ/ppm: 22.61 (s, 5C), 25.40 (s, 2C), 25.71 (s, 2C), 26.46 (s, 2C), 27.21 (s, 2C) 27.78 (s, 2C), 28.07 (s, 2C), 28.21 (d, J = 2.21 Hz, 5C), 28.50 (s, 2C), 30.95 (s, 2C), 32.23 (s, 1C), 37.32 (s, 1C), 37.78 (s, 1C), 41.46 (s, 2C), 44.02 (d, J = 7.37 Hz, 3C), 44.05–44.28 (m, 2C), 46.89 (s, 1C).Synthesis of tetrakis(diethylaminodithiocarbomato)molybdate(IV) ([Mo(S2CNEt2)4]), (2)
A mixture of Mo(CO)6 (10 g, 37.8 mmol) and bis(diethylthiocarbamoyl)disulfide (22.4 g, 75.6 mmol) was dissolved in degassed acetone (400 mL) and heated under reflux at a temperature range of 55–60 °C for 2 h. The mixture was cooled to room temperature, which prompted violet crystals to appear which were filtered and washed with pentane and dried in vacuo,45 to yield the title product as dark microcrystals. Yield: 63%. Anal calc. for C20H40MoN4S8 (%) C, 34.88; H, 5.86; N, 8.14; S 37.16. Found (%) C, 35.04; H, 6.05; N, 8.08; S 37.33. (mp 126–128 °C). MS (ES+) m/z: 690.1 [M + H]+.Aerosol-assisted chemical vapour deposition (AA-CVD)
AA-CVD was used to deposit the rhenium or molybdenum sulfide thin films by employing [Re(μ-SiPr)3(SiPr)6] (1) or [Mo(S2CNEt2)4] (2), at concentrations of 0.1 mmol in 40 mL of THF at 475 °C. In addition, 0.1 mmol of total precursors (mol [Mo(S2CNEt2)4] and mol [Re(μ-SiPr)3(SiPr)6]) were dissolved in (40 mL) THF to give solutions with differing composition (10, 20, 30, and 50 mol%) to synthesis Re-doped MoS2. Argon was used as inert gas carrier with flow rate 180 sccm in to the furnace where precursors decomposed and deposit on the glass substrates (1 × 2 cm), which has been ultrasonically cleaned in isopropanol prior to use. The flow rate of argon was controlled using Platon flow gauge. Depositions typically lasted for ca. ∼3 h.Results and discussion
Synthesis and characterisation of the rhenium and molybdenum precursors
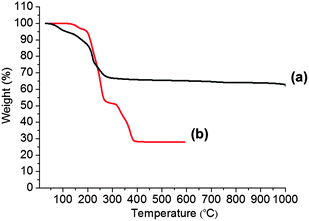
Re(μ-SiPr)3(SiPr)6 (1) and Mo(S2CNEt2)4 (2) were synthesised by literature procedures.44,45 All characterisation data matched with that previously reported. Complex (1) was a dark red powder, whilst complex (2) appeared as dark purple crystals. Both precursors were freely soluble in THF. Thermogravimetric analysis (TGA) of complexes (1) and (2) was used to determine the thermal decomposition range for both complexes (Fig. 1). Precursor (1) decomposed in four steps in the temperature ranges of; 40–90 °C, 140–210 °C, and 215–360 °C, followed by a slower decomposition process in the temperature range 810–1000 °C and complete decomposition occurred after a 10 min. hold at 1000 °C. The remaining mass of residue (62%) suggests the formation of a rhenium sulfide (calc. 61%) (Fig. 1). Precursor (2), had a TGA profile consistent with that previously reported,22 showing four decomposition steps in the range 0–600 °C with a final residue (29%) close to that of MoS2 (calc. 24%).Deposition and characterization of ReS2 thin films
Deposition of ReS2 films was performed using AA-CVD. The reactor temperature for deposition of ReS2, MoS2, and Re-doped MoS2 was chosen based on thermogravimetric analysis results (TGA, vide supra). Varying molar ratios of precursor (1) and (2) were used in a THF aerosol to achieve doped thin films which were deposited at 475 °C. The films were studied by inductively coupled plasma optical emission spectroscopy (ICP-OES), powder X-ray diffraction (p-XRD), scanning electron microscopy (SEM) and Raman and energy dispersive X-ray (EDX) spectroscopies. The p-XRD pattern of rhenium disulfide thin films deposited at 475 °C (Fig. 2) revealed two major reflections at 2θ = 14.37°, which is assigned to the (001) plane of 1T-ReS2, and at 2θ = 27.89° corresponding to the (111) plane. Thus the ReS2 produced by AACVD has an apparent preferred orientation in the (001) plane.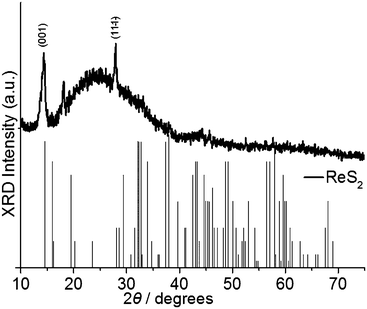 | ||
| Fig. 2 Powder X-ray diffraction pattern for rhenium disulfide (ReS2) deposited by AA-CVD using precursor (1) at 475 °C. The black sticks refer to the powder pattern of ReS2 as reported by Wildervanck et al.46 A simulated powder pattern is also available in the ESI.† The amorphous background is from the glass substrate. | ||
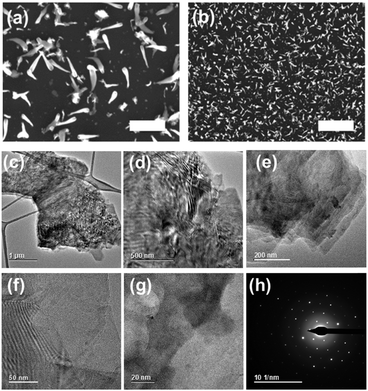
Raman spectroscopy of the films revealed vibrational modes that can be linked to ReS2 films. Eg modes which we ascribe to in-plane vibrations of the Re atoms in ReS2, and Ag modes corresponding to the out-of-plane vibrations of Re atoms (Fig. 3). The morphological features of thin films of rhenium sulfide were investigated by scanning electron microscopy (SEM), which revealed particles with teardrop morphology (Fig. 4a and b). Bright field transmission electron microscopy (TEM) reveals that this material is flake-like in appearance at the nanoscale (Fig. 4c–g), which is consistent with the layered structure of ReS2. Selected area electron diffraction (SAED) patterns taken from these flakes show that they are highly crystalline (Fig. 4h).
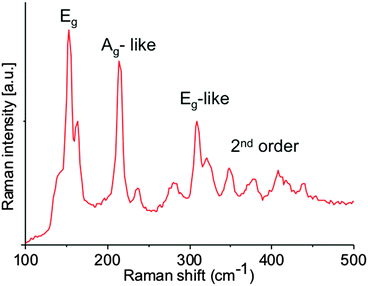 | ||
| Fig. 3 The Raman spectrum of as-deposited ReS2 thin films produced by AA-CVD at 475 °C. The profile is consistent with the Raman spectrum of ReS2 previously reported.28,29 | ||
Elemental analysis of the rhenium sulfide thin films by energy dispersive X-ray (EDX) spectroscopy. Thin films of ReS2 grown from Re(μ-SiPr)3(SiPr)6 at 475 °C analysed as follows: Re 30%, S 70% giving a composition of ReS2.3. Molybdenum sulfide was also grown under the same conditions; SEM and EDX and Raman spectroscopies were consistent with that previously reported for this material (ESI†).19
Deposition and characterization of Mo-doped ReS2 thin films
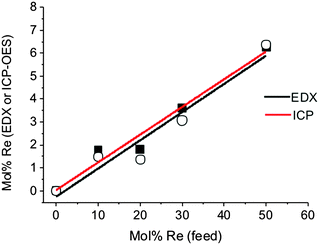
Rhenium-alloyed thin films of molybdenum disulfide (Mo1−xRexS2 where 0 ≤ x ≤ 0.06) were synthesised by AA-CVD at 475 °C. EDX spectroscopy and ICP-OES confirmed that the rhenium dopant was successfully entrained into MoS2 thin films (Fig. 5). In all cases, the incorporation of Re into MoS2 is inefficient and the amount of Re found by EDX and ICP-OES in the films is only ca. 10% of that available Re in the aerosol feed.The p-XRD patterns of Mo1−xRexS2 (0 ≤ x ≤ 0.06) for the ratios 1.79 and 1.80 mol% show four reflections at 2θ = 14.3, 33.2, 39.5, and 58.7° which can be assigned to the (002), (100), (103), and (110) reflections respectively. There was no significant change with the incorporation of 1.79 and 1.80 mol% of Re on the pXRD patterns. However, on increasing the level of Re to more than 1.80 mol%, a change in the appearance of the diffraction patterns was observed; the (002) reflection became weak and broadened (Fig. 6). These changes in the powder pattern can be attributed to increasing Re mol%, which affects the stacking layers of the S–Mo–S layers in the basal plane,47 which has previously been observed for Cr-doped MoS2.21 Bright field TEM of the doped thin films (ESI†) reveal that increasing the level of Re in the films does indeed cause a shift to material with a more amorphous appearance. This could potentially be caused the formation of intra-layer Re–Re bonds that locally disrupt the structure by S displacement (vide supra). The d-spacing for the (002) plane of the MoS2 film was 6.23 Å which is larger than that reported by Schoenfeld et al.40 Indeed, in our and other reports of MoS2 synthesised by AACVD from dithiocarbamato molybdenum(IV) precursors the observed spacings of 6.25 and 6.20 Å,19,21 suggest that MoS2 produced by AA-CVD is lattice expanded in the [002] direction as compared to bulk material. The rhenium doped MoS2 displays a monotonic increase in the d-spacing that is linear with doping, suggesting that doping of Re affords a linear lattice expansion in the [002] direction of the crystal. If the literature value of d(002) for bulk molybdenite is used,46 the trend becomes linear. We tentatively suggest that the effect of doping is pseudo-Vegardian.
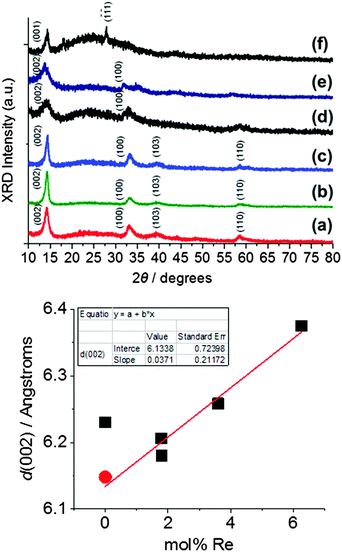 | ||
Fig. 6 Powder X-ray diffraction patterns of Mo1−xRexS2 (0 ≤ x ≤ 0.06) films deposited by AA-CVD on glass substrates at 475 °C. Top: Full pXRD patterns of (a) 0% Re, (b) 1.79 mol% Re, (c) 1.80 mol% Re, (d) 3.60 mol% Re, (e) 6.25 mol% Re., (f) ReS2 thin films. Powder patterns are offset for clarity bottom: the d(002) spacing for Re-doped MoS2 measured by pXRD. ( ) Literature interlayer distance value of crystalline 2H-MoS2 (002) 6.15 Å Schoenfeld et al.40(■) Measured d-spacing of MoS2 and Re-doped MoS2 from this study. Average value reported by this laboratory for MoS2 thin films deposited by AA-CVD is 6.23 Å.19,21 This observation suggests that MoS2 films produced by AA-CVD generally show lattice expansion in the [002] direction as compared to bulk molybdenite. ) Literature interlayer distance value of crystalline 2H-MoS2 (002) 6.15 Å Schoenfeld et al.40(■) Measured d-spacing of MoS2 and Re-doped MoS2 from this study. Average value reported by this laboratory for MoS2 thin films deposited by AA-CVD is 6.23 Å.19,21 This observation suggests that MoS2 films produced by AA-CVD generally show lattice expansion in the [002] direction as compared to bulk molybdenite. | ||
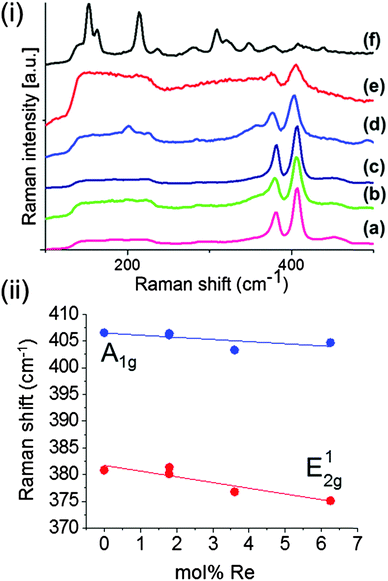
Raman spectroscopy was used to study Mo1−xRexS2 (0 ≤ x ≤ 0.06) films. The MoS2 film had two main bands observed at 407.6 cm−1 and 380.6 cm−1 corresponding to the A1g and E2g optical phonon modes (ESI†). The Raman spectra for the Re-doped MoS2 films are shown in Fig. 7a. Significant changes in Raman spectra occurred at 3.6 mol% Re with the appearance of a band which could correspond to the A1g mode for ReS2. Dependence of the Raman shift of the E12g and A1g optical modes of Mo1−xRexS2 on the amount of Re-dopant is shown in Fig. 7b. The difference in the magnitude of the shifts observed for both bands gives insight into the manner of doping.48 The A1g mode, which consists of the vibrational displacement of sulfur atoms only is only slightly shifted from ca. 407 cm−1 to ca. 406 cm−1. On the other hand, the E12g mode, which involves the vibration of metal and sulfur atoms in a layer is significantly shifted from ca. 382 cm−1 to ca. 376 cm−1. This is consistent with the substitutional doping of the heavier Re atoms into the Mo layer.
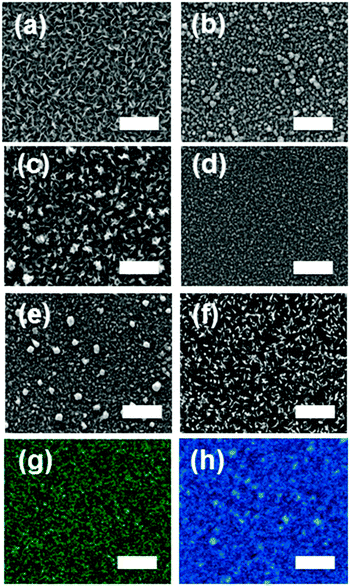
The surface morphology of the Mo1−xRexS2 (0 ≤ x ≤ 0.06) films deposited by AA-CVD at 475 °C were investigated by SEM. Different morphologies were observed on changing the amount of rhenium; MoS2 had a lamellar morphology, but Re-doped MoS2 1.79% gave clusters. Increasing the Re to 3.60% gave feather-like crystals which were also observed for material with 6.25% Re (Fig. 8). Representative elemental mapping of the Re-doped MoS2 thin film at 1.80% revealed that rhenium is evenly distributed in the film (Fig. 8). This was found in all alloyed films, suggesting that the isovalent substitution of Re(IV) for Mo(IV) was homogeneous under the conditions employed in this study.
Conclusions
Thin films of Mo1−xRexS2 (0 ≤ x ≤ 0.06) were deposited by AA-CVD from the single-source precursors Re(μ-SiPr)3(SiPr)6 (1) and Mo(S2CNEt2)4 (2). The Re-doped MoS2 thin films were deposited by using different molar ratios of (1) and (2). The morphology of thin films as investigated by SEM changes as the doping of MoS2 with rhenium is increased The p-XRD patterns for the Re-doped MoS2 shows systematic variations in the peak shape, intensity, and the position of the (002) planes as the rhenium content varies. The d(002) spacing in the alloys increases in a pseudo-Vegardian manner. EDX mapping of films demonstrated the spatial homogeneity of the doping. The MoS2 alloy with Re is a promising as a model system for the stability of 99Tc in the host molybdenum disulfide crystal due to crystal radii and thermodynamic similarities between Re(IV) and Tc(IV). The materials could also be exfoliated either by liquid or mechanical means to make novel 2D materials; we are currently investigating this possibility.Acknowledgements
N. Al-D. thanks the Higher Committee for Education Development in Iraq (HCED) for funding and support, and also, the Chemistry Department and University of Sulaimani, Iraq, for allowing a period of study in the U.K. Some of the equipment used in this study were provided by the Engineering and Physical Sciences Research Council U.K. (Core Capability in Chemistry, EPSRC grant number EP/K039547/1).Notes and references
- Q. H. Wang, K. Kalantar-Zadeh, A. Kis, J. N. Coleman and M. S. Strano, Nat. Nanotechnol., 2012, 7, 699–712 CrossRef CAS PubMed.
- M. Chhowalla, H. S. Shin, G. Eda, L.-J. Li, K. P. Loh and H. Zhang, Nat. Chem., 2013, 5, 263–275 CrossRef PubMed.
- S. Z. Butler, S. M. Hollen, L. Cao, Y. Cui, J. A. Gupta, H. R. Gutiérrez, T. F. Heinz, S. S. Hong, J. Huang, A. F. Ismach, E. Johnston-Halperin, M. Kuno, V. V. Plashnitsa, R. D. Robinson, R. S. Ruoff, S. Salahuddin, J. Shan, L. Shi, M. G. Spencer, M. Terrones, W. Windl and J. E. Goldberger, ACS Nano, 2013, 7, 2898–2926 CrossRef CAS PubMed.
- B. Radisavljevic, A. Radenovic, J. Brivio, V. Giacometti and A. Kis, Nat. Nanotechnol., 2011, 6, 147–150 CrossRef CAS PubMed.
- D. Lembke and A. Kis, ACS Nano, 2012, 6, 10070–10075 CrossRef CAS PubMed.
- D. Jariwala, V. K. Sangwan, L. J. Lauhon, T. J. Marks and M. C. Hersam, ACS Nano, 2014, 8, 1102–1120 CrossRef CAS PubMed.
- H.-Y. Chang, S. Yang, J. Lee, L. Tao, W.-S. Hwang, D. Jena, N. Lu and D. Akinwande, ACS Nano, 2013, 7, 5446–5452 CrossRef CAS PubMed.
- B. W. H. Baugher, H. O. H. Churchill, Y. Yang and P. Jarillo-Herrero, Nano Lett., 2013, 13, 4212–4216 CrossRef CAS PubMed.
- A. Abderrahmane, P. J. Ko, T. V. Thu, S. Ishizawa, T. Takamura and A. Sandhu, Nanotechnology, 2014, 25, 365202 CrossRef CAS PubMed.
- M. Sun, J. Adjaye and A. E. Nelson, Appl. Catal., A, 2004, 263, 131–143 CrossRef CAS.
- W. M. R. Divigalpitiya, R. F. Frindt and S. R. Morrison, Science, 1989, 246, 369–371 CAS.
- S. Ding, J. S. Chen and X. W. (David) Lou, Chem. – Eur. J., 2011, 17, 13142–13145 CrossRef CAS PubMed.
- M. Chhowalla and G. A. J. Amaratunga, Nature, 2000, 407, 164–167 CrossRef CAS PubMed.
- J. Chen, N. Kuriyama, H. Yuan, H. T. Takeshita and T. Sakai, J. Am. Chem. Soc., 2001, 123, 11813–11814 CrossRef CAS PubMed.
- K. F. Mak, C. Lee, J. Hone, J. Shan and T. F. Heinz, Phys. Rev. Lett., 2010, 105, 136805 CrossRef PubMed.
- K. Chang, D. Geng, X. Li, J. Yang, Y. Tang, M. Cai, R. Li and X. Sun, Adv. Energy Mater., 2013, 3, 839–844 CrossRef CAS.
- S. Tongay, J. Zhou, C. Ataca, K. Lo, T. S. Matthews, J. Li, J. C. Grossman and J. Wu, Nano Lett., 2012, 12, 5576–5580 CrossRef CAS PubMed.
- W. Zhao, R. M. Ribeiro, M. Toh, A. Carvalho, C. Kloc, A. H. Castro Neto and G. Eda, Nano Lett., 2013, 13, 5627–5634 CrossRef CAS PubMed.
- A. Adeogun, M. Afzaal and P. O'Brien, Chem. Vap. Deposition, 2006, 12, 597–599 CrossRef CAS.
- V. A. Kuznetsov, A. S. Berdinsky, A. Y. Ledneva, S. B. Artemkina, M. S. Tarasenko and V. E. Fedorov, Sens. Actuators, A, 2015, 226, 5–10 CrossRef CAS.
- (a) D. J. Lewis, A. A. Tedstone, X. L. Zhong, E. A. Lewis, A. Rooney, N. Savjani, J. R. Brent, S. J. Haigh, M. G. Burke, C. A. Muryn, J. M. Raftery, C. Warrens, K. West, S. Gaemers and P. O'Brien, Chem. Mater., 2015, 27, 1367–1374 CrossRef CAS; (b) A. A. Tedstone, D. J. Lewis, R. Hao, S.-M. Mao, P. Bellon, R. S. Averback, C. P. Warrens, K. R. West, P. Howard, S. Gaemers, S. J. Dillon and P. O'Brien, ACS Appl. Mater. Interfaces, 2015, 7, 20829–20834 CrossRef CAS PubMed.
- M. N. McCain, B. He, J. Sanati, Q. J. Wang and T. J. Marks, Chem. Mater., 2008, 20, 5438–5443 CrossRef CAS.
- S. Tongay, H. Sahin, C. Ko, A. Luce, W. Fan, K. Liu, J. Zhou, Y.-S. Huang, C.-H. Ho and J. Yan, et al. , Nat. Commun., 2014, 5, 1–6 Search PubMed.
- D. Çakir, H. Sahin and F. M. Peeters, Phys. Chem. Chem. Phys., 2014, 16, 16771–16779 RSC.
- S. Yang, S. Tongay, Q. Yue, Y. Li, B. Li and F. Lu, Sci. Rep., 2014, 4, 1–6 Search PubMed.
- K. Keyshar, Y. Gong, G. Ye, G. Brunetto, W. Zhou, D. P. Cole, K. Hackenberg, Y. He, L. Machado and M. Kabbani, et al. , Adv. Mater., 2015, 27, 4640–4648 CrossRef CAS PubMed.
- W. Tu and B. Denizot, J. Colloid Interface Sci., 2007, 310, 167–170 CrossRef CAS PubMed.
- T. Fujita, Y. Ito, Y. Tan, H. Yamaguchi, D. Hojo, A. Hirata, D. Voiry, M. Chhowalla and M. Chen, Nanoscale, 2014, 6, 12458–12462 RSC.
- K. Xu, H.-X. Deng, Z. Wang, Y. Huang, F. Wang, S.-S. Li, J.-W. Luo and J. He, Nanoscale, 2015, 7, 15757–15762 RSC.
- H. Matzke and E. Vernaz, J. Nucl. Mater., 1993, 201, 295–309 CrossRef CAS.
- J. P. Icenhower, N. P. Qafoku, J. M. Zachara, D. M. Wellman and W. J. Martin, Waste Management Symposium – WM2009/WM'09: HLW, TRU, LLW/ILW, Mixed, Hazardous Wastes and Environmental Management – Waste Management for the Nuclear Renaissance, United States, 2009.
- B. T. Kenna and P. K. Kuroda, J. Inorg. Nucl. Chem., 1964, 26, 493–499 CrossRef CAS.
- K. Morris, F. R. Livens, J. M. Charnock, I. T. Burke, J. M. McBeth, J. D. C. Begg, C. Boothman and J. R. Lloyd, Appl. Geochem., 2008, 23, 603–617 CrossRef CAS.
- V. Neck and B. Kanellakopulos, Radiochim. Acta, 1987, 42, 135–138 CrossRef CAS.
- B. M. Dantas, A. L. A. Dantas, F. L. N. Marques, L. Bertelli and M. G. Stabin, Braz. Arch. Biol. Technol., 2005, 48, 215–220 CrossRef.
- R. D. T. Shannon, Acta Crystallogr., Sect. A: Cryst. Phys., Diffr., Theor. Gen. Crystallogr., 1976, 32, 751–767 CrossRef.
- G. E. Boyd and Q. V. Larson, J. Phys. Chem., 1956, 60, 707–715 CrossRef CAS.
- K. Xu, P. Hrma, W. Um and J. Heo, J. Nucl. Mater., 2013, 441, 262–266 CrossRef CAS.
- R. G. Dickinson and L. Pauling, J. Am. Chem. Soc., 1923, 45, 1466–1471 CrossRef CAS.
- B. Schoenfeld, J. J. Huang and S. C. Moss, Acta Crystallogr., Sect. B: Struct. Sci., 1983, 39, 404–407 CrossRef.
- H. H. Murray, S. P. Kelty, R. R. Chianelli and C. S. Day, Inorg. Chem., 1994, 33, 4418–4420 CrossRef CAS.
- R. Lincoln and G. Wilkinson, Inorganic synthesis, 1980, vol. XX Search PubMed.
- K. Mertis, P. G. Edwards, G. Wilkinson, K. M. A. Malik and M. B. Hursthouse, J. Chem. Soc., Dalton Trans., 1981, 705–716 RSC.
- W.-W. Zhuang, D. M. Hoffman, D. Lappas and J. Cohen, Polyhedron, 1998, 17, 2583–2586 CrossRef CAS.
- T. Ouyang, K. P. Loh, H. Zhang, J. J. Vittal, M. Vetrichelvan, W. Chen, X. Gao and A. T. S. Wee, J. Phys. Chem. B, 2004, 108, 17537–17545 CrossRef CAS.
- J. C. Wildervanck and F. Jellinek, J. Less-Common Met., 1971, 24, 73–81 CrossRef CAS.
- L. Ye, S. Chen, W. Li, M. Pi, T. Wu and D. Zhang, J. Phys. Chem. C, 2015, 119, 9560–9567 CAS.
- C. Lee, H. Yan, L. E. Brus, T. F. Heinz, J. Hone and S. Ryu, ACS Nano, 2010, 4, 2695–2700 CrossRef CAS PubMed.
Footnote |
| † Electronic supplementary information (ESI) available: Characterization of MoS2 thin films produced by AA-CVD at 475 °C, simulated p-XRD pattern of ReS2 and TEM of Re-doped MoS2. See DOI: 10.1039/c6tc00489j |
| This journal is © The Royal Society of Chemistry 2016 |

