 Open Access Article
Cellular internalisation, bioimaging and dark and photodynamic cytotoxicity of silica nanoparticles doped by {Mo6I8}4+ metal clusters†
Anastasiya O.
Solovieva
a,
Yuri A.
Vorotnikov
b,
Kristina E.
Trifonova
a,
Olga A.
Efremova
c,
Anna A.
Krasilnikova
a,
Konstantin A.
Brylev
bd,
Elena V.
Vorontsova
e,
Pavel A.
Avrorov
f,
Lidiya V.
Shestopalova
d,
Alexander F.
Poveshchenko
a,
Yuri V.
Mironov
bd and
Michael A.
Shestopalov
 *abd
*abd
aScientific Institute of Clinical and Experimental Lymphology, 2 Timakova st., 630060 Novosibirsk, Russian Federation
bNikolaev Institute of Inorganic Chemistry SB RAS, 3 Acad. Lavrentiev ave., 630090 Novosibirsk, Russian Federation. E-mail: shtopy@niic.nsc.ru
cDepartment of Chemistry, University of Hull, Cottingham Road, HU6 7RX, Hull, UK
dNovosibirsk State University, 2 Pirogovast., 630090 Novosibirsk, Russian Federation
eThe Institute of Molecular Biology and Biophysics, 2/12 Timakova st., 630117 Novosibirsk, Russian Federation
fScientific Research Institute of Physiology and Basic Medicine, 4 Timakova st., 630117 Novosibirsk, Russia Federation
First published on 14th June 2016
Abstract
Silica nanoparticles (SNPs) doped by hexanuclear molybdenum cluster complexes [{Mo6X8}L6]n (X = Cl, Br, or I; L = various inorganic or organic ligands) have been recently suggested as materials with high potential for biomedical applications due to both their outstanding photoluminescence properties and their ability to efficiently generate singlet oxygen upon photoirradiation. However, no studies were undertaken so far to prove this concept. Therefore, here we examined the potential of photoluminescent SNPs doped by {Mo6I8}4+ for applications such as bioimaging and photodynamic therapy using the human epidermoid larynx carcinoma (Hep-2) cell line as a model. Our results demonstrated both: (i) significant luminescence from cells with internalised molybdenum cluster-doped SNPs combined with the low cytotoxicity of particles in the darkness and (ii) significant cytotoxicity of the particles upon photoirradiation. Thus, this research provides strong experimental evidence for high potential of molybdenum-cluster-doped materials in biomedical applications such as optical bioimaging, biolabeling and photodynamic therapy.
Introduction
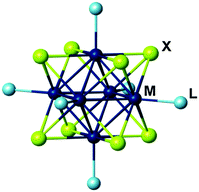
Hexanuclear molybdenum cluster complexes with the general formula [{Mo6X8}L6]n (X = Cl, Br, or I; L = various inorganic or organic ligands) (Fig. 1) have recently attracted significant interest in the context of application in biomedical technologies.1–3This is due to an outstanding balance of physical and chemical properties that these materials offer. Firstly, similar to their structural analogues, hexarhenium clusters [{Re6Q8}L6]m (Q = S or Se), these complexes demonstrate high chemical and photostability of the cluster cores {Mo6X8}4+ that are primarily responsible for their triplet excited state photoluminescence (i.e. phosphorescence). Secondly, their broad emission spectra extend in the red/near infra-red region (from ∼550 to more than 950 nm)4–13 overlapping the so-called “optical tissue window” (650–900 nm), where the boundaries of the region are defined by the minimal light absorption of hemoglobin (<650 nm) and water (>900 nm).14 Thirdly, such complexes are characterised by impressive photoluminescence quantum yields (PLQYs) for inorganic compounds.4,5,11,15 Additionally, the metal cluster complexes can also act as powerful photosensitisers in the singlet oxygen (1O2) generation,5–8,16–18 which makes them especially interesting for applications associated with the generation of singlet oxygen in vivo, such as, for example, photodynamic therapy (PDT).19–22 Fourthly, the cluster complexes are inherently highly electron dense and therefore can be used as contrast agents in transmission electron microscopy (TEM) and X-Ray imaging.23 Finally, the low toxicity of the molybdenum octahedral cluster complexes and derived materials was evidenced by different research groups.24–26
All together these properties make hexamolybdenum cluster complexes very attractive for biomedical applications (e.g. biolabeling and diagnostic bioimaging), and therapeutic (PDT agents) and even combined diagnostic and therapeutic (theranostic) applications.27
Despite the mentioned potential for biomedical applications, the known hexamolybdenum cluster complexes themselves are not ideally suited for these purposes. Most of them are either insoluble in water or, after being dissolved in water, they hydrolyse forming insoluble products. Both the poor water solubility and the susceptibility to hydrolysis hinder the application of molybdenum metal cluster complexes within a physiological environment.
The necessary water solubility could be achieved by the ligation of the {Mo6X8}4+-cluster core with hydrophilic ligands, by analogy with hexarhenium cluster complexes.23,28–33 Indeed, this approach was successfully realised with the use of inorganic hydrophilic ligands NCS− and N3−.25,30 However, these ligands do not protect the molybdenum cluster from the hydrolysis. To avoid the possible exchange of the ligands L by water molecules or OH− ions and simultaneously achieve biocompatibility, the molybdenum metal cluster complex can be encapsulated within an inert biocompatible carrier matrix, such as polystyrene (PS) micro-beads11,18,26 or SiO2.5,24,34,35 Despite the significant progress made in the development of PS and SiO2 supported metal cluster complexes, biological properties were not sufficiently studied for any of the above materials apart from the cytotoxicity of {Mo6I8}@PS-SH, which demonstrated low toxicity to Hep-2 human epidermoid larynx carcinoma,26 and Cs2[{Mo6Br8}Br6]@SiO2, which showed moderate toxicity to Caco-2 gut epithelial cells and MRC-5 lung fibroblasts.24
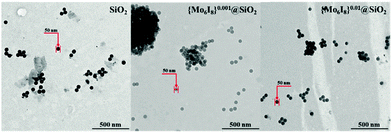
To fill this lapse, we selected silica nanoparticles (SNPs) of two different compositions – {Mo6I8}0.001@SiO2 and {Mo6I8}0.01@SiO2 (Fig. 2 and Fig. S1–S3, ESI†) – prepared according to an earlier described method from [{Mo6I8}(NO3)6]2− bearing labile nitrato ligands as a convenient source of {Mo6I8}4+.35 Although the cluster loading in the particles is quite low, the particles demonstrate decent PLQY values (0.12 and 0.03, respectively) and relatively good efficiencies of singlet oxygen generation.35 The particles also have an optimal size of 50 nm and shape for biological studies.36–39 In order to evaluate the potential of {Mo6I8}@SiO2 for bioimaging and/or photodynamic activity, we studied their ability to be internalised into Hep-2 cells, cellular distribution and cellular efflux degree and bench-marked them against similar neat SiO2 particles.40 We also studied the toxicity of {Mo6I8}@SiO2 for Hep-2 cells in the darkness and upon light irradiation.
Results and discussion
Cell viability and proliferation of SNPs
The effect of neat SiO2, {Mo6I8}0.001@SiO2 and {Mo6I8}0.01@SiO2 nanoparticles on viability of Hep-2 cells was evaluated by the MTT assay.41 The percentage of the metabolically active cells was determined against the negative control. It was shown that SNPs in the concentration range from 0.0015 to 0.375 mg mL−1 did not influence the viability of the cells. However, the increase of concentration of all types of SNPs above 0.75 mg mL−1 caused a slight reduction of the number of metabolically active cells down to 80% (Fig. 3).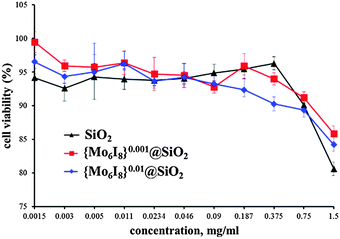 | ||
| Fig. 3 Viability of Hep-2 cells incubated with neat SiO2 and {Mo6I8}@SiO2 NPs determined by MTT assay. | ||
We also studied the influence of SNPs on the viability and proliferation of Hep-2 cells and their apoptosis degree using dual staining with Hoechst 33342/propidium iodide (PI). A representative fluorescence microscopy image of cells (Fig. 4) shows the morphological changes of the Hep-2 cells. We found that the treatment of the cells with 0.02 to 0.18 mg mL−1 of cluster-doped SNPs affected neither cell density nor cell viability (Fig. 5). This finding agrees well with the data of the MTT assay. However, we observed that treatment of cells with {Mo6I8}@SiO2 nanoparticles taken in the concentration range of 0.375–1.5 mg mL−1 led to a decrease of the cell density. The usable concentrations of {Mo6I8}@SiO2 for practical biomedical applications are thus recommended to not exceed 0.18 mg mL−1.
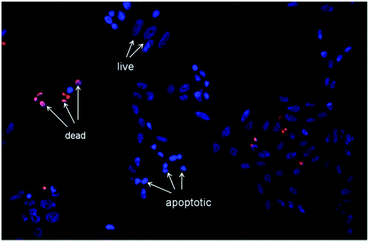 | ||
| Fig. 4 Representative image that shows the morphological changes of Hep-2 cells after incubation with {Mo6I8}0.001@SiO2 (1.5 mg mL−1), as detected by dual staining by Hoechst 33342/PI. | ||
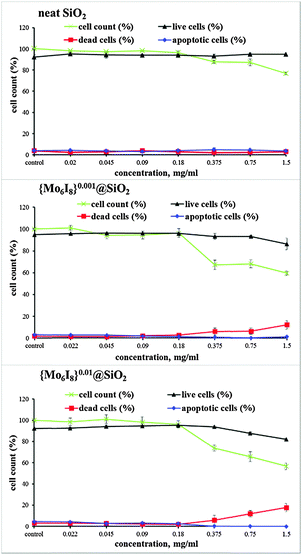 | ||
| Fig. 5 Effect of neat SiO2 and {Mo6I8}@SiO2 NPs on the viability and proliferation of Hep-2 cells determined by dual staining with Hoechst 33342/PI. | ||
Cellular uptake and elimination kinetics
The quantitative analyses of the cellular uptake and elimination kinetics of SNPs were carried out using flow cytometry (FACS). The Hep-2 cells were treated with {Mo6I8}@SiO2 nanoparticles at a concentration of 0.1 mg mL−1. According to FACS data, the luminescence intensity of the treated cells was found to be much higher than that of the untreated control cells. To determine the kinetics of {Mo6I8}@SiO2 uptake by the cells we plotted the mean photoluminescence intensity of the cells vs. the incubation time (Fig. 6A). Maximal cellular uptake of both types of photoluminescent SNPs was observed after 2 h of incubation, after which it plateaued and did not significantly change for up to 24 h. Since the maximal accumulation of SNPs occurred after 2 h of incubation, the study of {Mo6I8}@SiO2 cellular elimination kinetics was performed on the cells incubated for this period of time (Fig. 6B). It was shown that SNPs are actively excreted during the first 2 h, after that the photoluminescence intensity of the incubated cells did not significantly change and remained at a high level thereafter. Thus, our findings suggest both that SNPs rapidly enter the cells and remain there for a long time and that the loading of the metal cluster in SNPs does not affect the rate of internalisation and efflux of the particles.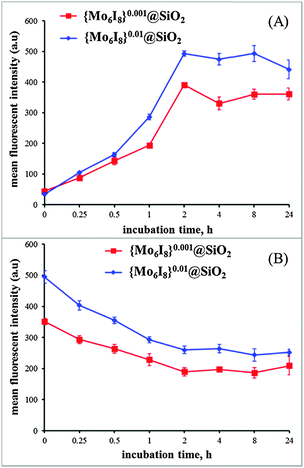 | ||
| Fig. 6 (A) Kinetics of {Mo6I8}@SiO2 NP uptake by Hep-2 cells. (B) Cellular elimination kinetics of {Mo6I8}@SiO2 NPs. | ||
Cellular internalisation and intracellular distribution
While FACS provides valuable quantitative data of the uptake and efflux, it however lacks the ability to determine the intracellular distribution of the particles. In order to determine the cellular distribution of {Mo6I8}@SiO2 nanoparticles we visualised the cells by confocal microscopy and TEM. Upon confocal microscopy imaging of the treated cells (λex = 405 nm) we indeed observed the intense red photoluminescence located in the cells (Fig. 7 and Fig. S4, ESI†). Moreover, Z-stack analysis (Fig. S5, ESI†) clearly showed that the fluorescence intensity is located inside the cells, confirming that SNPs entered the cells and were not just adherent on the cell surface. Specifically, confocal microscopy revealed that localisation of SNPs was in the cell cytoplasm, on the periphery of the cell and in the space near the nuclei.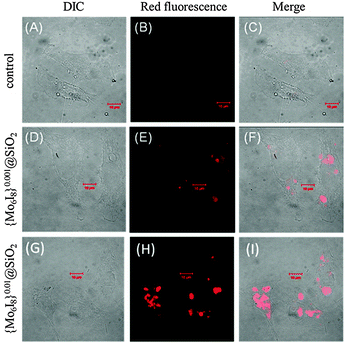 | ||
| Fig. 7 Cellular uptake of cluster-doped SNPs by confocal fluorescence microscopy. Differential interference contrast (DIC) (A, D and G), red fluorescence (B, E and H), and merged images (C, F and I). | ||
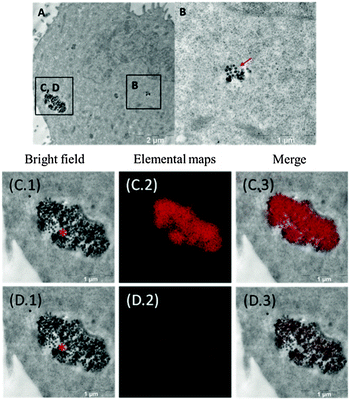
TEM imaging of the cells incubated with SNPs under identical conditions as for confocal microscopy assay gave us even more details on localisation of the particles within the Hep-2 cells and also some initial ideas about the possible cellular uptake mechanisms. TEM images did not show any signs of abnormal changes of the cell ultrastructure. We also observed no difference in the intracellular distribution between neat SiO2, {Mo6I8}0.001@SiO2 and {Mo6I8}0.01@SiO2. TEM images showed that SNPs were mostly located within membrane-enclosed vesicles of different sizes, i.e. endosomes (Fig. 8, Fig. S6 and S7, ESI†). Also zeta-potential measurements of neat SiO2, {Mo6I8}0.001@SiO2 and {Mo6I8}0.01@SiO2 showed that they all had negative charges with the corresponding values of −23 ± 2 mV, −40 ± 1 mV, and −21 ± 1 mV. These supported the general assumption that silica particles entered the cells by the endocytosis mechanism.42,43 However, alternative mechanisms such as, for example, uptake with the extracellular fluid by micropinocytosis are also possible.44 In some cases, we also observed free SNPs in the cytosol that could be due to some mechanism of endosomal escape. We also observed free SNPs localised in the cytosol near the nucleus. Such localisation may cause stronger effects of SNPs directly on the nucleus (for example, upon photoirradiation), even if SNPs themselves do not enter the nucleus.
Therefore, exact mechanisms of cellular uptake and efflux still need to be determined to fully evaluate potential of SNPs for biomedical applications.
In vitro photodynamic toxicity
Having established that molybdenum cluster-doped SNPs can easily enter the cells and remain within for sufficiently a long time and also that they show low toxicity in the darkness, we were keen to examine whether these SNPs could be used as a tool for intercellular photosensitisation. To do that we first confirmed the generation of singlet oxygen by the SNPs after photoirradiation in Hep-2 cells (Fig. S9, ESI†) and then the photodynamic toxicity was studied. Hep-2 cells were treated with neat SiO2, {Mo6I8}0.001@SiO2 and {Mo6I8}0.01@SiO2 in concentrations from 0.0125 to 0.22 mg mL−1, i.e. in the range where both neat and doped SNPs did not show any cellular toxicity in the darkness as it was shown by cytotoxicity assay (Fig. 3). As a positive control, Hep-2 cells were also treated with the second-generation commercial photosensitiser Radachlorin at concentrations typical for in vitro experiments.45 Both treated cells and untreated negative control cells were then irradiated by light with λ ≥ 400 nm and evaluated using viability, apoptosis and proliferation assay.The microscopy images (Fig. 9 and Fig. S8, ESI†) clearly showed that Hep-2 cells in groups without irradiation and in the negative control group and SiO2 after irradiation had a spindle shape, were in close contact with neighbouring cells and adhered to the surface of the culture flask. The images have also shown that Hep-2 cells treated with cluster-doped SNPs in concentrations above 0.18 mg mL−1 became condensed and rounded after light irradiation (Fig. S8 (B.7–B.9), ESI†).
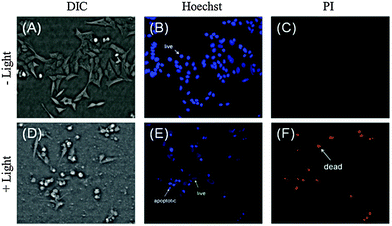 | ||
| Fig. 9 Effect of {Mo6I8}0.01@SiO2 (0.1 mg mL−1) on Hep-2 cells before (top) and after (bottom) photoirradiation determined by dual staining with Hoechst 33342/PI. | ||
The effect of concentration of the photosensitisers on the cells is demonstrated in Fig. 10. Namely, the graphs show that the number of apoptotic cells was the highest after the Hep-2 cells were treated with 0.0125–0.05 mg mL−1 of {Mo6I8}0.001@SiO2, 0.05 mg mL−1 of {Mo6I8}0.01@SiO2 and 0.01525 mg mL−1 of Radachlorin. Moreover, the number of dead cells clearly increased in the samples treated with {Mo6I8}0.001@SiO2 in the concentrations above 0.18 mg mL−1, with {Mo6I8}0.01@SiO2 in the concentrations above 0.025 mg mL−1 and Radachlorin in the concentrations above 0.01525 mg mL−1 (Fig. 10 and Fig. S8(B), ESI†).
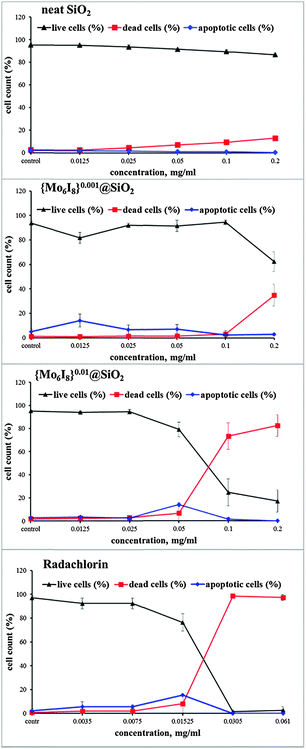 | ||
| Fig. 10 Viability of Hep-2 cells treated with SNPs (SiO2, {Mo6I8}0.001@SiO2 and {Mo6I8}0.01@SiO2) after photoirradiation (λ ≥ 400 nm, 30 min) determined by dual staining with Hoechst 33342/PI. | ||
We were also able to determine IC50 for {Mo6I8}0.01@SiO2 and Radachlorin under light irradiation (0.075 ± 0.007 mg mL−1 and 0.021 ± 0.002 mg mL−1, respectively), while we detected only ∼35% of dead cells in culture samples treated with {Mo6I8}0.001@SiO2 taken at a concentration of 0.22 mg mL−1. Thus, SNPs with the higher loading of the metal cluster demonstrated the stronger photodynamic cytotoxicity. This photodynamic cytotoxicity is of the same order of magnitude as a currently available photosensitiser Radochlorin, which was previously used for fluorescence diagnosis and photodynamic therapy of malignant tumours.46,47 We believe that the photo-induced cytotoxic effect of {Mo6I8}0.001@SiO2 and {Mo6I8}0.01@SiO2 is caused mostly by free particles rather than the ones localised in endosomes, since they extend the cytotoxic effect of ROS within the cytoplasm. Moreover, there is also a possibility that the molybdenum-cluster-doped SNPs could facilitate endosomal escape. Specifically, short-living and highly reactive singlet oxygen generated by {Mo6I8}@SiO2 upon photoirradiation could destroy the endosomal/lysosomal membrane and enable the contents of the organelles to be delivered to the cytosol. Indeed, some earlier works have already shown that photoactive moieties, either alone or incorporated into nanoparticles, can be used to disrupt the endosomal membrane upon exposure to light, consequently facilitating the endosomal escape.48,49
To summarise, the viability of the untreated cells under irradiation was found to be 100%. As expected, neat SNPs did not show any photoinduced cytotoxicity in the chosen range of concentrations. The irradiation of the cells treated with {Mo6I8}@SiO2 demonstrated a concentration-dependent decrease in cellularity and a corresponding increase in the number of dead cells (Fig. 10). SNPs with the higher load of the metal cluster showed increased photoinduced cellular toxicity, comparable with the commercially available photosensitiser Radachlorin. To the best of our knowledge, this is the first in vitro study that demonstrates the cytotoxicity of materials based on Mo6 metal clusters upon photoirradiation. This study, thus, provides the first experimental evidence of the potential of these and similar materials for applications associated with the generation of singlet oxygen in vivo, such as PDT.
Experimental
Synthesis of the nanoparticles
Nanoparticles {Mo6I8}0.001@SiO2 and {Mo6I8}0.01@SiO2 with an average particle size of 50 nm were synthesised according to an earlier described method. In general, (Bu4N)2[{Mo6I8}(NO3)6]11 (1.7 or 17 mg, respectively) dissolved in ethanol (2.5 mL) was added to the distilled water (2.5 mL). To prepare a microemulsion, both the ethanol/water solution of (Bu4N)2[{Mo6I8}(NO3)6] (1.6 mL) and 25% aqueous ammonia solution (1.3 mL) were added to the mixture of n-heptane (47 mL) and Brij L4 surfactant (15 mL). This mixture was stirred for 30 min to ensure the homogeneity of the microemulsion. Finally, tetraethyl orthosilicate (2 mL) was added and the mixture was stirred for 72 h. Thereafter, the obtained yellowish colloidal solution was centrifuged (7000 rpm for 10 min), washed successively with ethanol, water and acetone and dried at 60 °C in air. Neat SiO2 nanoparticles were obtained by the same method, but without (Bu4N)2[{Mo6I8}(NO3)6].Cell culture
The human larynx carcinoma cell line (Hep-2) was purchased from the State Research Center of Virology and Biotechnology VECTOR and cultured in Eagle's Minimum Essential Medium (EMEM, pH = 7.4) supplemented with a 10% fetal bovine serum under a humidified atmosphere (5% CO2 and 95% air) at 37 °C.MTT-assay
The effect of SNPs (neat SiO2, {Mo6I8}0.001@SiO2 and {Mo6I8}0.01@SiO2) on the cell metabolic activity was determined using the 3-[4,5-dimethylthiazol-2-yl]-2,5-diphenyltetrazolium bromide (MTT) colorimetric assay. The Hep-2 cells were seeded into 96-well plates at 5 × 10³ cells per well in a medium containing SNPs with concentrations from 0.0015 to 1.5 mg mL−1 and then incubated for 24 h under a 5% CO2 atmosphere. 10 μL of the MTT solution (5 mg mL−1) was added to each well, the plates were incubated for 4 h and then the formazan formed was dissolved in DMSO (200 μL). The optical density was measured using a plate reader Multiskan FC (Thermo scientific, USA) at a wavelength of 620 nm. The experiment was repeated three times on separate days.Viability, apoptosis and proliferation assay
Cell viability, apoptosis and proliferation were detected by Hoechst 33342/PI staining as previously described by Lee et al.50 The Hep-2 cells were seeded on 96-well plates at 5 × 10³ cells per well in a medium containing SNPs (neat SiO2 and {Mo6I8}@SiO2) at concentrations from 0.0015 mg mL−1 to 1.5 mg mL−1 and incubated for 24 h. The cells incubated in the absence of SNPs were used as a control. Treated cells and control cells were stained with Hoechst 33342 (Sigma-Aldrich) for 30 min at 37 °C and PI (Sigma-Aldrich) for 10 min at 37 °C. An IN Cell Analyzer 2200 (GE Healthcare, UK) was used to perform automatic imaging of six fields per well under 200× magnification, in brightfield and fluorescence channels. The images produced were used to analyse live, apoptotic and dead cells among the whole population using the IN Cell Investigator software (GE Healthcare, UK).Cellular uptake kinetics
Hep-2 cells were seeded in 6-well plates at 3 × 10⁵ cells per well for each time point and were incubated for 24 h to reach a confluency of greater than 50%. SNPs were diluted in EMEM medium to a final concentration of 0.1 mg mL−1 and were sonicated for approximately 15 min prior to all experiments. The cells were then treated with {Mo6I8}@SiO2 in culture medium for 0, 0.25, 0.5, 1, 2, 4 and 8 h at 37 °C under a 5% CO2 atmosphere. After treatment, cells were rinsed three times with ice cold phosphate buffered saline (PBS) to remove any free SNPs. Cells were then trypsinized and resuspended in fresh PBS with 10% FBS.Cell suspensions were analysed using a FACSCanto II (Becton Dickinson, USA). A 488 nm excitation source was used with a 695 nm emission filter. Gating was utilised using a negative sample and the data were expressed as the median fluorescence intensity. All of the data were the mean fluorescence obtained from a population of 10![[thin space (1/6-em)]](https://www.rsc.org/images/entities/char_2009.gif) 000 cells.
000 cells.
Cellular elimination kinetics
Hep-2 cells were seeded in 6-well plates at 3 × 10⁵ cells per well for each time point (0, 0.25, 0.5, 1, 2, 4 and 24 h) and were incubated for 24 h to reach a confluency of greater than 50%. {Mo6I8}@SiO2 was diluted in EMEM medium to a final concentration of 0.1 mg mL−1 and was sonicated for approximately 15 min prior to all experiments. The cells were then exposed to {Mo6I8}@SiO2 in culture medium for 2 h at 37 °C under a 5% CO2 atmosphere. After treatment, the medium containing SNPs was then replaced with a fresh medium and cells were incubated for 0.25, 0.5, 1, 2, 4 and 24 h. Cells were then trypsinized and resuspended in fresh PBS with 10% FBS.Cell suspensions were analysed using a FACSCanto II (Becton Dickinson, USA). A 488 nm excitation source was used with a 695 nm emission filter. Gating was utilised using a negative sample and the data were expressed as the median fluorescence intensity. All of the data were the mean fluorescence obtained from a population of 10![[thin space (1/6-em)]](https://www.rsc.org/images/entities/char_2009.gif) 000 cells.
000 cells.
Confocal laser scanning microscopy
Hep-2 cells were seeded on slides (1.5 × 10⁵ cells per slide) and incubated overnight at 37 °C under a 5% CO2 atmosphere. The medium was then replaced with a fresh medium containing 0.1 mg mL−1 of {Mo6I8}@SiO2 and incubated for 24 h. The cells incubated in the absence of SNPs were used as a control. Finally, the cells were washed twice with PBS, fixed in 4% paraformaldehyde, and washed thrice with PBS. Cells were visualised by using a Zeiss LSM 510 confocal microscope (Carl Zeiss Inc., Jena, Germany) equipped with a laser diode (405 nm) for fluorescence and with a 100× oil immersion objective. The images were obtained and analysed using ZEN 2009 software. Each experiment was repeated three times on separate days.Transmission electron microscopy (TEM)
Hep-2 cells were grown in a 25 cm2 culture flask (6 × 10⁵ cells per flask) for 24 h, after which the cells were exposed to 0.1 mg mL−1 of SNPs for 24 h. Cells were washed with PBS and trypsinized. Then 1 mL medium containing 1 × 10⁶ cells was pipetted into BEEM capsules. Cells were centrifuged at 1000 g for 5 min at room temperature to form a pellet at the bottom of the capsule. The cells were fixed with 2% glutaraldehyde in PBS for 2 h, followed by two 30 min PBS washes. 1% osmium tetroxide in PBS (1 mL) was added to the fixed cell pellet for 1 h. Then the samples were treated according to the general protocols for TEM. The full protocol was previously described by Schrand et al.51 The ultrathin sections (70 nm) without additional staining by uranyl acetate and lead citrate were viewed on a Libra 120 (Zeiss) TEM operating at 120 kV. Energy-filtered transmission electron microscopy (EF-TEM) elemental maps were recorded using the standard three window technique described in Brydson, Electron Energy Loss Spectroscopy, BIOS: Oxford (2001).Evaluation of the photodynamic cytotoxicity
The Hep-2 cells were seeded in 96-well plates at the density of 5 × 10³ cells per well and cultured for 24 h. The medium was then replaced with the fresh medium containing from 0.0125 to 0.22 mg mL−1 of neat SiO2 and {Mo6I8}@SiO2, incubated for 2 h and then irradiated by a 500 W halogen lamp (λ ≥ 400 nm) for 30 min to apply a total light dose of 20 J cm−2. The photosensitiser for the positive control (Radachlorin®) was purchased from the RADA-PHARMA group (RADA-PHARMA Co, Ltd, Moscow, Russia). Radachlorin was used at concentrations typical for in vitro studies (0.0025–0.1 mg mL−1).45 Cells cultured in the medium without SNPs served as a negative control. The viability of treated and control cells was assayed and analysed 24 h later using viability, apoptosis and proliferation assay as described above.Statistical analysis
Statistical analyses were performed using the Mann–Whitney U test for unpaired data and P values of less than 0.01 were considered as significant. Data are presented as mean ± SEM (standard error of the mean).Conclusions
In this work, we established that SNPs doped by photoluminescent molybdenum cluster {Mo6I8}4+ had low cellular toxicity in the darkness and high biocompatibility. In the similar manner as neat SNPs, photoluminescent SNPs rapidly entered the cells (presumably via endocytosis) and remained in the cytoplasm for a long time. Internalised into Hep-2 cells, particles showed significant photoluminescence in the red region even after maximal elimination, as it was demonstrated by confocal imaging and FACS studies. Experiments on photoirradiation of the cells incubated with {Mo6I8}@SiO2 nanoparticles unambiguously showed high photoinduced cellular toxicity of the materials. Moreover, particles with the higher loading of the metal cluster were more toxic to Hep-2 cells upon photoirradiation.Consequently, we suggest that photoluminescent {Mo6I8}@SiO2 nanoparticles have good potential for applications in in vitro bioimaging and cellular photosensitisation, studies on oxidative stress, or PDT. Therefore, the future research will focus on the ways to further improve the PLQYs of the hybrid materials by, for example, developing and immobilisation of labile/non-labile mixed-ligand cluster complex precursors and the surface functionalisation of the particles by specific ligands and/or biological cargos.
Acknowledgements
We are grateful to the Russian Science Foundation for funding (Grant No. 14-14-00192), and to the Microscopic Centre of the Siberian Branch of the Russian Academy of Sciences for granting access to microscopic equipment. Dr O. A. Efremova thanks the University of Hull for the academic starting grant.Notes and references
- S. Cordier, F. Grasset, Y. Molard, M. Amela-Cortes, R. Boukherroub, S. Ravaine, M. Mortier, N. Ohashi, N. Saito and H. Haneda, J. Inorg. Organomet. Polym. Mater., 2015, 25, 189–204 CrossRef CAS.
- J. Elistratova, M. Mikhailov, V. Burilov, V. Babaev, I. Rizvanov, A. Mustafina, P. Abramov, M. Sokolov, A. Konovalov and V. Fedin, RSC Adv., 2014, 4, 27922–27930 RSC.
- J. Elistratova, V. Burilov, A. Mustafina, M. Mikhailov, M. Sokolov, V. Fedin and A. Konovalov, Polymer, 2015, 72, 98–103 CrossRef CAS.
- M. N. Sokolov, M. A. Mihailov, E. V. Peresypkina, K. A. Brylev, N. Kitamura and V. P. Fedin, Dalton Trans., 2011, 40, 6375–6377 RSC.
- K. Kirakci, P. Kubat, M. Dusek, K. Fejfarova, V. Sicha, J. Mosinger and K. Lang, Eur. J. Inorg. Chem., 2012, 3107–3111 CrossRef CAS.
- K. Kirakci, P. Kubat, J. Langmaier, T. Polivka, M. Fuciman, K. Fejfarova and K. Lang, Dalton Trans., 2013, 42, 7224–7232 RSC.
- K. Kirakci, K. Fejfarova, M. Kucerakova and K. Lang, Eur. J. Inorg. Chem., 2014, 2331–2336 CrossRef CAS.
- K. Kirakci, V. Sicha, J. Holub, P. Kubat and K. Lang, Inorg. Chem., 2014, 53, 13012–13018 CrossRef CAS PubMed.
- M. N. Sokolov, M. A. Mikhailov, A. V. Virovets, K. A. Brylev, R. A. Bredikhin, A. M. Maksimov, V. E. Platonov and V. P. Fedin, Russ. Chem. Bull., 2013, 62, 1764–1767 CrossRef CAS.
- M. N. Sokolov, M. A. Mikhailov, K. A. Brylev, A. V. Virovets, C. Vicent, N. B. Kompankov, N. Kitamura and V. P. Fedin, Inorg. Chem., 2013, 52, 12477–12481 CrossRef CAS PubMed.
- O. A. Efremova, M. A. Shestopalov, N. A. Chirtsova, A. I. Smolentsev, Y. V. Mironov, N. Kitamura, K. A. Brylev and A. J. Sutherland, Dalton Trans., 2014, 43, 6021–6025 RSC.
- M. A. Mikhailov, K. A. Brylev, A. V. Virovets, M. R. Gallyamov, I. Novozhilov and M. N. Sokolov, New J. Chem., 2016, 40, 1162–1168 RSC.
- L. Riehl, M. Strövele, D. Enseling, T. Jüstel and H.-J. Meyer, Z. Anorg. Allg. Chem., 2016, 642, 403–408 CrossRef CAS.
- R. Weissleder, Nat. Biotechnol., 2001, 19, 316–317 CrossRef CAS PubMed.
- O. A. Efremova, K. A. Brylev, Y. A. Vorotnikov, L. Vejsadová, M. A. Shestopalov, G. F. Chimonides, P. D. Topham, N. Kitamura and A. J. Sutherland, J. Mater. Chem. C, 2016, 4, 497–503 RSC.
- J. A. Jackson, M. D. Newsham, C. Worsham and D. G. Nocera, Chem. Mater., 1996, 8, 558–564 CrossRef CAS.
- J. A. Jackson, C. Turro, M. D. Newsham and D. G. Nocera, J. Phys. Chem., 1990, 94, 4500–4507 CrossRef CAS.
- K. Kirakci, P. Kubát, K. Fejfarova, J. Martincik, M. Nikl and K. Lang, Inorg. Chem., 2016, 55, 803–809 CrossRef CAS PubMed.
- P. Agostinis, K. Berg, K. A. Cengel, T. H. Foster, A. W. Girotti, S. O. Gollnick, S. M. Hahn, M. R. Hamblin, A. Juzeniene, D. Kessel, M. Korbelik, J. Moan, P. Mroz, D. Nowis, J. Piette, B. C. Wilson and J. Golab, Ca-Cancer J. Clin., 2011, 61, 250–281 CrossRef PubMed.
- A. P. Castano, P. Mroz and M. R. Hamblin, Nat. Rev. Cancer, 2006, 6, 535–545 CrossRef CAS PubMed.
- D. E. J. G. J. Dolmans, D. Fukumura and R. K. Jain, Nat. Rev. Cancer, 2003, 3, 380–387 CrossRef CAS PubMed.
- T. J. Dougherty, C. J. Gomer, B. W. Henderson, G. Jori, D. Kessel, M. Korbelik, J. Moan and Q. Peng, J. Natl. Cancer Inst., 1998, 90, 889–905 CrossRef CAS PubMed.
- A. A. Krasilnikova, M. A. Shestopalov, K. A. Brylev, I. A. Kirilova, O. P. Khripko, K. E. Zubareva, Y. I. Khripko, V. T. Podorognaya, L. V. Shestopalova, V. E. Fedorov and Y. V. Mironov, J. Inorg. Biochem., 2015, 144, 13–17 CrossRef CAS PubMed.
- T. Aubert, F. Cabello-Hurtado, M. A. Esnault, C. Neaime, D. Lebret-Chauvel, S. Jeanne, P. Pellen, C. Roiland, L. Le Polles, N. Saito, K. Kimoto, H. Haneda, N. Ohashi, F. Grasset and S. Cordier, J. Phys. Chem. C, 2013, 117, 20154–20163 CrossRef CAS.
- K. Kirakci, P. Kubát, M. Kučeráková, V. Šícha, H. Gbelcová, P. Lovecká, P. Grznárová, T. Ruml and K. Lang, Inorg. Chim. Acta, 2016, 441, 42–49 CrossRef CAS.
- N. A. Vorotnikova, O. A. Efremova, A. R. Tsygankova, K. A. Brylev, M. V. Edeleva, O. G. Kurskaya, A. J. Sutherland, A. M. Shestopalov, Y. V. Mironov and M. A. Shestopalov, Polym. Adv. Technol., 2016, 27, 922–928 CrossRef CAS.
- K. Y. Choi, G. Liu, S. Lee and X. Y. Chen, Nanoscale, 2012, 4, 330–342 RSC.
- S. J. Choi, K. A. Brylev, J. Z. Xu, Y. V. Mironov, V. E. Fedorov, Y. S. Sohn, S. J. Kim and J. H. Choy, J. Inorg. Biochem., 2008, 102, 1991–1996 CrossRef CAS PubMed.
- M. A. Shestopalov, K. E. Zubareva, O. P. Khripko, Y. I. Khripko, A. O. Solovieva, N. V. Kuratieva, Y. V. Mironov, N. Kitamura, V. E. Fedorov and K. A. Brylev, Inorg. Chem., 2014, 53, 9006–9013 CrossRef CAS PubMed.
- G. Pilet, S. Cordier, S. Golhen, C. Perrin, L. Ouahab and A. Perrin, Solid State Sci., 2003, 5, 1263–1270 CrossRef CAS.
- K. A. Brylev, Y. V. Mironov, V. E. Fedorov, S.-J. Kim, H.-J. Pietzsch, H. Stephan, A. Ito and N. Kitamura, Inorg. Chim. Acta, 2010, 363, 2686–2691 CrossRef CAS.
- K. A. Brylev, Y. V. Mironov, S. G. Kozlova, V. E. Fedorov, S.-J. Kim, H.-J. Pietzsch, H. Stephan, A. Ito, S. Ishizaka and N. Kitamura, Inorg. Chem., 2009, 48, 2309–2315 CrossRef CAS PubMed.
- A. Gandubert, K. A. Brylev, T. T. Nguyen, N. G. Naumov, N. Kitamura, Y. Molard, R. Gautier and S. Cordier, Z. Anorg. Allg. Chem., 2013, 639, 1756–1762 CrossRef CAS.
- F. Grasset, F. Dorson, S. Cordier, Y. Molard, C. Perrin, A. M. Marie, T. Sasaki, H. Haneda, Y. Bando and M. Mortier, Adv. Mater., 2008, 20, 143–148 CrossRef CAS.
- Y. A. Vorotnikov, O. A. Efremova, N. A. Vorotnikova, K. A. Brylev, M. V. Edeleva, A. R. Tsygankova, A. I. Smolentsev, N. Kitamura, Y. V. Mironov and M. A. Shestopalov, RSC Adv., 2016, 6, 43367–43375 RSC.
- K. J. Cho, X. Wang, S. M. Nie, Z. Chen and D. M. Shin, Clin. Cancer Res., 2008, 14, 1310–1316 CrossRef CAS PubMed.
- W. H. De Jong and P. J. A. Borm, Int. J. Nanomed., 2008, 3, 133–149 CrossRef CAS.
- M. Gaumet, A. Vargas, R. Gurny and F. Delie, Eur. J. Pharm. Biopharm., 2008, 69, 1–9 CrossRef CAS PubMed.
- I.-Y. Kim, E. Joachim, H. Choi and K. Kim, Nanomedicine, 2015, 11, 1407–1416 CrossRef CAS PubMed.
- Y. H. Jin, S. Kannan, M. Wu and J. X. J. Zhao, Chem. Res. Toxicol., 2007, 20, 1126–1133 Search PubMed.
- J. C. Sheldon, Nature, 1959, 184, 1210–1213 CrossRef CAS.
- A. Lesniak, F. Fenaroli, M. P. Monopoli, C. Aberg, K. A. Dawson and A. Salvati, ACS Nano, 2012, 6, 5845–5857 CrossRef CAS PubMed.
- K. Shapero, F. Fenaroli, I. Lynch, D. C. Cottell, A. Salvati and K. A. Dawson, Mol. BioSyst., 2011, 7, 371–378 RSC.
- I. M. Adjei, B. Sharma and V. Labhasetwar, Nanomaterials, 2014, 811, 73–91 Search PubMed.
- H. Mirzaei, G. E. Djavid, M. Hadizadeh, M. Jahanshiri-Moghadam and P. Hajian, J. Photochem. Photobiol., B, 2015, 142, 86–91 CrossRef CAS PubMed.
- E. V. Kochneva, E. V. Filonenko, E. G. Vakulovskaya, E. G. Scherbakova, O. V. Seliverstov, N. A. Markichev and A. V. Reshetnickov, Photodiagn. Photodyn. Ther., 2010, 7, 258–267 CrossRef CAS PubMed.
- W. Ji, J.-W. Yoo, E. K. Bae, J. H. Lee and C.-M. Choi, Photodiagn. Photodyn. Ther., 2013, 10, 120–126 CrossRef CAS PubMed.
- L. Prasmickaite, A. Høgset, P. K. Selbo, B. Ø. Engesæter, M. Hellum and K. Berg, Br. J. Cancer, 2002, 86, 652–657 CrossRef CAS PubMed.
- P. K. Selbo, A. Weyergang, A. Høgset, O.-J. Norum, M. B. Berstad, M. Vikdal and K. Berg, J. Controlled Release, 2010, 148, 2–12 CrossRef CAS PubMed.
- Y. Lee and E. Shacter, J. Biol. Chem., 1999, 274, 19792–19798 CrossRef CAS PubMed.
- A. M. Schrand, J. J. Schlager, L. Liming Dai and S. M. Hussain, Nat. Protoc., 2010, 5, 744–757 CrossRef CAS PubMed.
Footnote |
| † Electronic supplementary information (ESI) available: DLS, FTIR, excitation and emission spectra and TEM and confocal laser scanning microscopy images. See DOI: 10.1039/c6tb00723f |
| This journal is © The Royal Society of Chemistry 2016 |

