
 Open Access Article
 This Open Access Article is licensed under a Creative Commons Attribution-Non Commercial 3.0 Unported Licence
A switchable peroxidase mimic derived from the reversible co-assembly of cytochrome c and carbon dots†
Jeremy B.
Essner
,
Richard N.
McCay
,
Chip J.
Smith II
,
Stephen M.
Cobb
,
Charles H.
Laber
and
Gary A.
Baker
*
Department of Chemistry, University of Missouri-Columbia, Columbia, MO 65211, USA. E-mail: bakergar@missouri.edu
First published on 25th February 2016
Abstract
We describe a straightforward tactic to boost the inherently low peroxidase-like activity of the heme-protein equine cytochrome c (cyt c) following its electrostatic assembly onto the carbon nanodot surface. This represents the first time that carbon nanodot interaction has been demonstrated to switch a protein into a high-performance enzyme for speeding up a reaction it was not evolved to catalyze. The dramatic enhancement in peroxidase-like activity stems in part from favorable local perturbations within the heme microenvironment of cyt c which are influenced by the chemistry presented at the carbon dot surface. That is, the observed peroxidase activity is clearly moderated by the choice of molecular precursors used to prepare the carbon dots, a choice which ultimately determines the surface charges present. An exceptional catalytic efficiency (kcat/KM) of 8.04 (±1.74) × 107 M−1 s−1 was determined for carbon dot/cyt c co-assemblies, close to the theoretical diffusion-controlled limit. Notably, the activity of the carbon dot/cyt c assembly can be switched off simply by increasing the ionic strength which results in dissociation into non-catalytic components.
Introduction
With the development of novel nanomaterials that show promise in biological applications, it is vital to arrive at a deeper understanding of these nanomaterials' interactions and effects on the biological systems in which they may be applied. Toward this, it has been reported that various nano-sized materials possess the ability to enhance or hinder enzymatic activities across various research realms such as catalysis and the detection of biological targets.1–3 Even further and as a greener alternative to conventional nanomaterials, carbon-based nanomaterials such as graphenes and fullerenes are gaining traction as protein/biomolecule sensors, enzyme modulators, and intracellular transporters due to their biocompatibility and desirable surface functionalities.2,4–9Recently, Yang et al. demonstrated that the peroxidase-like activity of cytochrome c (cyt c) was modulated through the addition of reduced graphene oxide (rGO) or graphene oxide (GO), which resulted in inhibited or enhanced activity, respectively.2 The observed activity enhancement resulting from the addition of GO was attributed to the perturbation of the cyt c heme microenvironment through electrostatic interactions between the protein and GO functional groups. These functional groups (e.g., epoxide, carboxyl, hydroxyl) have been reported to covalently bond, hydrogen bond, or electrostatically interact with proteins, resulting in efficient biosensors or enzymatic modulators.2,4,5
Carbon nanodots (C-dots), emerging carbon nanomaterials, are thought to possess similar surface functionalities to GO,10 making them intriguing nanoparticle candidates for such enzymatic modulation. In addition to these surface features which impart C-dots with high aqueous solubility, C-dots also sport several other attractive and exploitable properties (especially in relation to bio-applications), such as biocompatibility, low cytotoxicity, excitation wavelength-dependent emission, and relatively high luminescence quantum yields.10,11 One other appealing feature of C-dots is the ability to generate this nanomaterial from virtually any carbon-containing source, including low- and negatively-valued wastes (even human urine12) through an arsenal of top-down (e.g., arc discharge, laser ablation, electrochemical oxidation) and bottom-up (e.g., thermal, hydrothermal, and microwave) approaches.10
While C-dots appear to be interesting candidates for efficient enzymatic modulation, past protein-related C-dot work has focused primarily on protein detection13–15 or insulin fibrillation inhibition,16 with few reports relevant to C-dot modulated enzyme activity, the nature of protein/C-dot interactions, or the effects of C-dots on protein structure.3,17,18 For example, Li et al. demonstrated that phosphate-functionalized C-dots enhance the catalytic activity of laccase through interactions between the C-dot surface groups and the protein's T1 Cu center, with photoirradiation of the system further enhancing the activity.3 Herein, we report, for the first time, the C-dot modulated peroxidase-like activity of cyt c. Cyt c, a globular protein with a unique covalently-bound heme center, serves as an excellent model protein to assess local perturbations arising from protein/C-dot interactions, since the effects on the active heme center can be probed spectroscopically and visualized through peroxidase-mimicking catalysis.1,2 Although cyt c is a known peroxidase mimic, the inherently-low activity limits its widespread implementation in catalytic applications, making the development of efficient nanoscale ‘boosters’ of high interest.
Results and discussion
In this work, four different types of C-dots were synthesized and tested for their ability to enhance the peroxidase-like activity of cyt c. The detailed synthetic procedures are provided within the Experimental but briefly, citric acid, as a carbon source was thermally carbonized alone and in the presence of various dopants/passivating agents,19,20 resulting in citric acid (CA), citric acid–urea (CA–U), citric acid–thiourea (CA–T), and citric acid–mercaptosuccinic acid (CA–M) derived C-dots.21 To the best of our knowledge, this represents the first example wherein C-dots have been shown to repurpose a protein to perform a catalytic reaction it was not evolved to perform (i.e., non-native biocatalysis).The cartoon schematic22 shown in Fig. 1 highlights the postulated interactions between the CA-derived C-dots and cyt c. In the presence of only CA C-dots, hydrogen peroxide (H2O2) was unable to oxidize the leuko-dye 2,2′-azino-bis(3-ethylbenzothiazoline-6-sulphonic acid) (ABTS), indicated by the absence of green color (Fig. 1Ai). Consistent with previous reports, cyt c alone showed minimal peroxidase activity, slowly oxidizing ABTS (Fig. 1Aii).1,2 However, in the presence of C-dots, the peroxidase-like activity of cyt c was markedly enhanced, denoted by the rapid formation of the characteristic green color for oxidized ABTS (Fig. 1Aiii). As we will demonstrate in this study, this activity modulation can best be explained through an electrostatically-driven perturbation of the cyt c heme center by the C-dots. The surface functionality of the C-dots consists of carboxyl, hydroxyl, and epoxide moieties, as determined by infrared spectroscopy (Fig. S1B, ESI†), which yields a negatively-charged surface. Meanwhile, cyt c possesses a largely cationic surface (pI ≈ 10.3), with much of that positive charge residing proximal to the active heme site, as shown by the electrostatic calculations of Fig. 1B.22–24 Therefore, we postulate that the cyt c “docks” with the C-dot surface preferentially near its heme site, resulting in a perturbation of the heme microenvironment of cyt c giving rise to peroxidase-like activity.
 | ||
| Fig. 1 (A) Neat carbon nanodots (C-dots) did not display any catalytic activity, as evidenced by the lack of green color in (Ai), while native cytochrome c (cyt c) was found to exhibit weak peroxidase activity (Aii). When C-dots were combined with cyt c, the peroxidase activity was dramatically enhanced, indicated by the rapid formation of the oxidized form of ABTS (i.e., appearance of intense green color), as shown in (Aiii). (B) Different orientations of the electrostatic calculations performed on cyt c show that a majority of the protein surface is positively charged (blue areas), with the bulk of the positive charge residing in the vicinity of the heme group. | ||
Carbon nanodot characterization
The photophysical and physical properties of the various C-dots were characterized with UV-Vis, Fourier-transform infrared, and fluorescence spectroscopies, as well as transmission electron microscopy. The UV-Vis spectra of the four C-dot samples are provided in Fig. S1A (ESI†). The CA and CA–M derived C-dots display rapidly increasing absorbance in the near-UV region, which is characteristic of the π–π* transitions of aromatic sp2 domains.21 On the contrary, the CA–U and CA–T derived C-dots show small peaks at approximately 340 nm, likely due to nitrogen incorporation within the C-dot. In addition, the CA–T derived C-dots display an additional peak centered near 450 nm.The FTIR spectra (Fig. S1B, ESI†) reveal that, depending upon the precursors employed, the C-dots possess hydroxyl, carboxyl, epoxide, and amine functionalities, which were assigned to the following absorption bands: 3400 cm−1, stretching vibrations of O–H (νO–H) and/or N–H (νN–H); 1700 and 1650 cm−1, stretching vibrations of C![[double bond, length as m-dash]](https://www.rsc.org/images/entities/char_e001.gif) O (νCO); 1650–1550 cm−1, NH/NH2 deformation (νN–H) and skeletal vibrations of aromatic groups (νCC); 1300–1000 cm−1, stretching vibrations of C–O–C and C–OH (νC–O–C and νC–OH); 2900 and 1400 cm−1, aliphatic stretches (νC–H). Due to the presence of these surface functionalities, all of the resulting dots were highly water-soluble. Fluorescent emission spectra (Fig. S2, ESI†) of the CA, CA–U, CA–T, and CA–M derived C-dots show that, in general, upon increasing the excitation wavelength, the fluorescent emission maxima display a slight hypsochromic shift, followed by a larger bathochromic shift. These substantial red-edge effects are further highlighted in the inset plots of Fig. S2 (ESI†). Excitation wavelength-dependent quantum yield measurements (Fig. S1C, ESI†) reveal that the quantum yield values decreased as the excitation wavelength increased, with the CA and CA–T derived C-dots displaying the highest overall quantum yields across all wavelengths. Representative TEM images (Fig. S1D, ESI†) of the CA-derived C-dots show that the dots ranged in size from 30–60 nm, with particles as large as 100 nm seen on rare occasion. All other precursor combinations produced C-dots of a similar size range.
O (νCO); 1650–1550 cm−1, NH/NH2 deformation (νN–H) and skeletal vibrations of aromatic groups (νCC); 1300–1000 cm−1, stretching vibrations of C–O–C and C–OH (νC–O–C and νC–OH); 2900 and 1400 cm−1, aliphatic stretches (νC–H). Due to the presence of these surface functionalities, all of the resulting dots were highly water-soluble. Fluorescent emission spectra (Fig. S2, ESI†) of the CA, CA–U, CA–T, and CA–M derived C-dots show that, in general, upon increasing the excitation wavelength, the fluorescent emission maxima display a slight hypsochromic shift, followed by a larger bathochromic shift. These substantial red-edge effects are further highlighted in the inset plots of Fig. S2 (ESI†). Excitation wavelength-dependent quantum yield measurements (Fig. S1C, ESI†) reveal that the quantum yield values decreased as the excitation wavelength increased, with the CA and CA–T derived C-dots displaying the highest overall quantum yields across all wavelengths. Representative TEM images (Fig. S1D, ESI†) of the CA-derived C-dots show that the dots ranged in size from 30–60 nm, with particles as large as 100 nm seen on rare occasion. All other precursor combinations produced C-dots of a similar size range.
Carbon nanodot screening
Fig. 2A reveals that while native cyt c displays very weak peroxidase-like activity, by themselves, the C-dots display no intrinsic peroxidase activity. However, when C-dots are introduced to cyt c, the peroxidase-mimicking activity of the protein is greatly enhanced. Moreover, this effect is highly dependent on the nature of the C-dot chemistry. Since the largest modulation arises from CA and CA–M, we postulate that more negatively-charged C-dots produce greater peroxidase activity enhancements due to electrostatically-driven coupling with cyt c. Indeed, C-dots derived from CA–U and CA–T are expected to possess cationic surface moieties arising from the (thio)urea component, consistent with the significantly lower peroxidase activities observed for those C-dots. The circular dichroism (CD) measurements summarized in Fig. 2B correlate well with the corresponding activities shown in Fig. 2A, consistent with the notion that the degree of protein perturbation, which depends on the features of the dots (e.g., surface charge), determines the peroxidase activity. | ||
| Fig. 2 (A) Peroxidase-like activities of native cyt c and cyt c in the presence of various C-dots. The chemistry of the C-dot has a marked impact on the observed peroxidase-like cyt c activity, with CA and CA–M derived C-dots yielding the greatest catalytic enhancements. Typical assay conditions: [cyt c] = 515 nM, [C-dot] = 25.5 μg mL−1, [H2O2] = 14.1 mM, [ABTS] = 0.72 mM. (B) Far-UV CD spectra of cyt c alone and in the presence of the four different types of C-dots. These spectra illustrate the role that the C-dot surface functionalities play in denaturing cyt c. The degree to which the protein is denatured correlates with the peroxidase activity shown in panel (A), with CA and CA–M dots showing the greatest structural impact coupled with the highest peroxidase activity. Representative CD conditions were: [cyt c] = 4.2 μM and [C-dot] = 200 μg mL−1. | ||
CA carbon nanodot concentration optimization
To better understand the observed peroxidase activity modulation for cyt c, the interactions between CA-derived C-dots and cyt c were explored more fully since these particular C-dots delivered the highest activity. For the remainder of this article, ‘C-dots’ will refer solely to CA-derived C-dots, unless otherwise noted. Initially, the C-dot loading was optimized by monitoring the peroxidase activity for cyt c in the presence of various C-dot concentrations. Fig. 3 shows that a very low C-dot loading of 0.10 μg mL−1 produced a small, but statistically-significant, enhancement in activity over native cyt c, with the activity increasing greatly at higher C-dot loadings. A sharp increase in the peroxidase-like activity of cyt c was observed upon increasing the C-dot concentration from 5.0 to 10.0 μg mL−1, however, C-dot loadings higher than 10.0 μg mL−1 did not provide any further enhancements. For the remaining studies, we have employed a C-dot concentration of 25.0 μg mL−1 as this gave near-peak activities wherein the cyt c active site appeared to be ‘saturated’ with respect to C-dot interactions.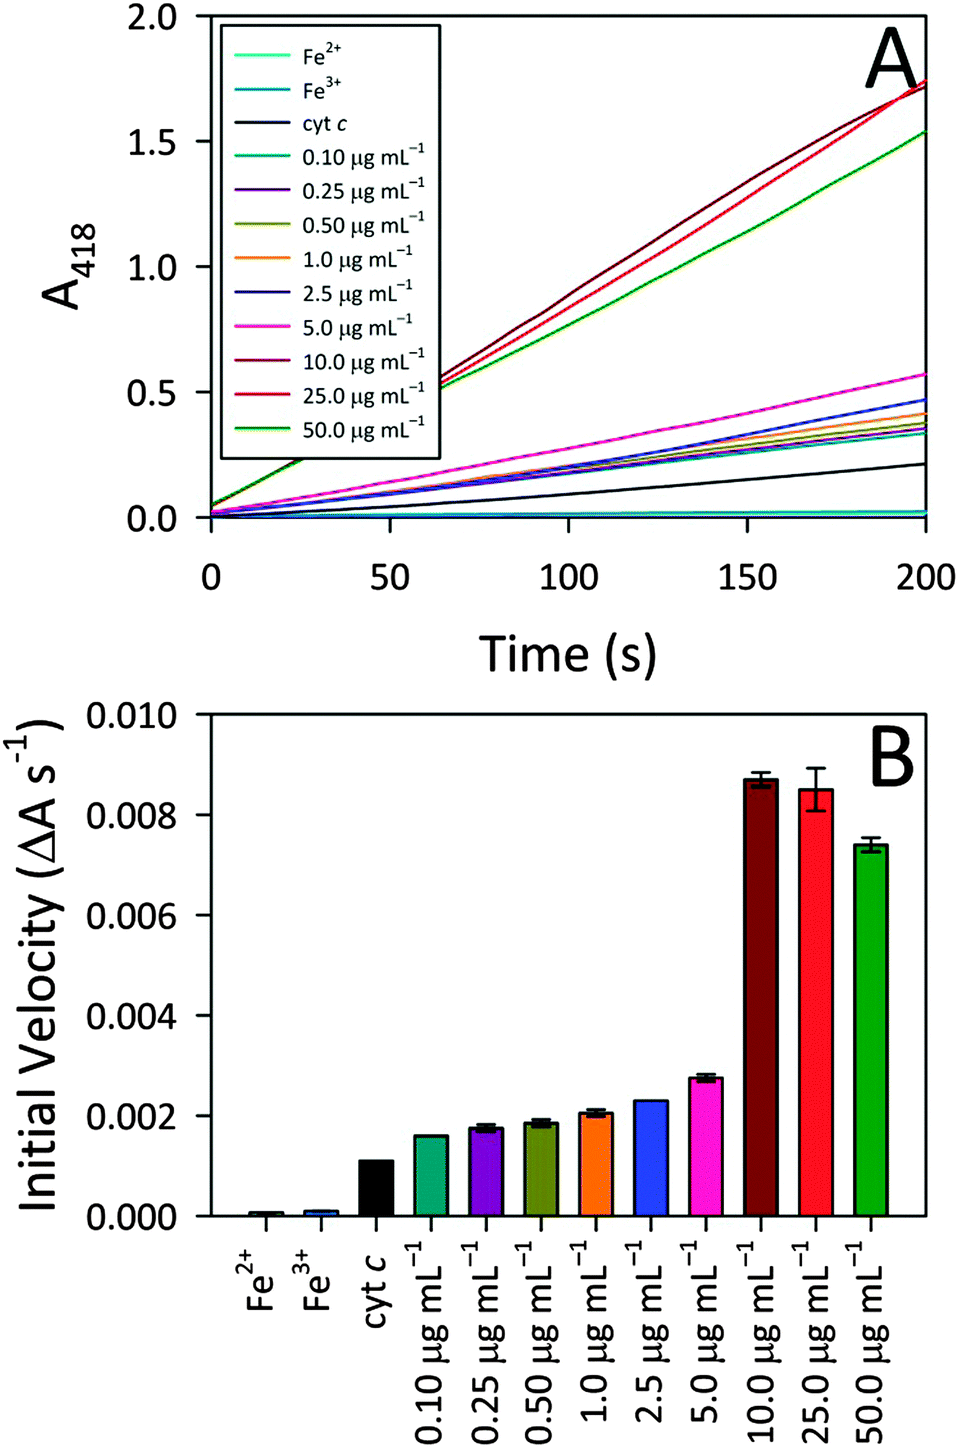 | ||
| Fig. 3 (A) CA-derived C-dot concentration dependence of observed cyt c peroxidase activity, demonstrating that increasing C-dot concentration leads to higher activity. Cyt c and free iron (Fe2+ and Fe3+ ion) controls are included alongside for comparison. (B) Calculated slopes from the activity profiles of panel (A) further highlight that increasing the C-dot concentration yields higher cyt c peroxidase activity whereas free iron itself shows essentially zero peroxidase activity. Typical assay conditions: [cyt c, Fe2+, or Fe3+] = 515 nM, [C-dot] = variable (as shown), [ABTS] = 0.72 mM, and [H2O2] = 14.1 mM. | ||
Iron ion and molecular control studies
Also summarized in Fig. 3 are the results of control studies in which free iron (in the form of either Fe2+ or Fe3+) was tested for peroxidase activity. In both cases, negligible peroxidase activity was shown compared to native cyt c, ruling out the possibility that expulsion of iron from the heme group might contribute to the emergent peroxidase activity. These results further highlight the pivotal role that the C-dots play in turning on the peroxidase-like activity of cyt c.In addition to these iron controls, various molecular analogs were tested for their ability to induce cyt c peroxidase activity via electrostatic interactions. For these studies, the C-dot precursors themselves (i.e., citric acid, urea, thiourea, mercaptosuccinic acid) as well as tannic acid and 10 kDa polyethylenimine (PEI) were tested as model species since they provide a range of molecular sizes as well as surface groups (i.e., charges). The concentration of the model species tested was a decade lower than the C-dot concentration (on a mass basis), to account for the fact that less than 10% of the C-dot atoms are actually surface exposed. Addition of these test molecules to cyt c produced weak or zero enhancement in the peroxidase-like activity (Fig. S3, ESI†). Citric acid produced the highest degree of enhancement. Urea, thiourea, and mercaptosuccinic acid produced similar enhancements, although the mercaptosuccinic acid resulted in an initial induction time prior to catalytic rate increase. The 10 kDa PEI gave no enhancement, in line with an electrostatic interaction mechanism (i.e., mutual repulsion between the positively-charged protein and positively-charged polymer). Surprisingly, however, tannic acid, which possesses negatively-charged groups, also yielded no activity. In fact, the activity of cyt c in the presence of tannic acid is lower than for cyt c alone. Overall, these control studies point to the fact that, while electrostatic interactions appear to play an important role, they cannot fully account for the observed peroxidase activities. That is, the nanoscale dimensions of the C-dots also appear to play a vital part in the protein structure perturbation giving rise to exceptional peroxidase-mimicking activity (i.e., the physical docking of cyt c onto C-dots).
Peroxidase kinetics studies and ionic strength effects
To further describe peroxidase performance, results were placed within a Michaelis–Menten kinetic framework. Toward this, C-dots were mixed with increasing concentrations of the ABTS substrate to obtain saturation plots of cyt c peroxidase activity (Fig. 4A). The initial reaction velocities were plotted against the substrate (ABTS) concentration (Fig. S4A, ESI†), revealing biocatalytic behaviour that follows Michaelis–Menten kinetics, similar to observations for cyt c on GO.2 Using these same data, a Lineweaver–Burk plot (Fig. S4B, ESI†) was generated to determine the characteristic catalytic parameters associated with the observed enzyme kinetics, including the maximum velocity of the enzymatic reaction (Vmax), the Michaelis constant (KM), the turnover number (kcat), and the catalytic efficiency (defined as kcat/KM), a measure of how efficiently an enzyme converts a substrate into product. From the Lineweaver–Burk plot, the Vmax, KM, kcat, and kcat/KM values were calculated as 0.010 ± 0.002 s−1, 0.245 ± 0.021 mM, 1.97 (±0.39) × 104 s−1, and 8.04 (±1.74) × 107 M−1 s−1, respectively. This catalytic efficiency approaches the theoretical upper limit for diffusion of substrate into an active site (108–1010 M−1 s−1), an indicator of the outstanding efficiency for peroxidase activity displayed by co-assemblies of cyt c with C-dots. | ||
| Fig. 4 (A) CA-derived C-dot modulated peroxidase activity for cyt c in the presence of increasing ABTS substrate concentrations. (B) Solvent system effects on cyt c peroxidase-like activities in the presence (solid circles) and absence (open circles) of CA-derived C-dots. Use of a phosphate buffered saline (PBS) solvent system resulted in a drastic reduction in peroxidase activity, even in the presence of C-dots, consistent with the interaction between cyt c and C-dots being electrostatic in nature. Typical assay conditions employed were [cyt c] = 515 nM, [C-dot] = 25.5 μg mL−1, [H2O2] = 14.1 mM. | ||
To further elucidate the nature of the interaction between C-dots and cyt c, catalytic studies were carried out within three different aqueous solvent systems: water, phosphate buffer (PB), and phosphate buffered saline (PBS) (Fig. 4B). Whether performed in deionized water (i.e., ionic strength, μ ≈ 0) or PB (10 mM, pH 7.4; μ ≈ 0.02 M), C-dots were found to similarly enhance the peroxidase activity of cyt c. Conversely, upon increasing the ionic strength of the solvent system by conducting the catalysis in PBS which contains supplemental salt (ionic strength, μ ≈ 0.16 M), the activity falls off completely to levels below that of the cyt c alone. This loss in peroxidase activity is fully consistent with the increased ionic strength resulting in a dissociation of the catalytically-active electrostatic assembly. Namely, the Coulombic screening removes the attraction between cyt c and the oppositely-charged C-dot surface. Now detached from the C-dot surface, the cyt c no longer displays strong peroxidase activity.
Probing the heme microenvironment
To further illuminate the origin of this enzymatic modulation, the absorbance of cyt c at 695 nm was monitored upon the addition of C-dots. It is well established that cyt c presents a characteristic absorption band centered at 695 nm which is a sensitive marker for the native protein conformation.25 The loss of this band is typically associated with a perturbation of the heme microenvironment (weakening or rupture of the axial Met80–Fe3+ bond), resulting in an opening of the heme crevice.25 The UV-Vis results shown in Fig. S5 (ESI†) indicate that, upon addition of C-dots to a native solution of cyt c, the 695 band is completely lost, providing clear evidence that C-dots perturb the heme environment of cyt c. The fact that the positive surface charges of cyt c are concentrated near the heme group likely directs the electrostatic association between cyt c and C-dots to occur at this locus, yielding both global and local (heme) structural changes within cyt c which form the genesis of the strong peroxidase-like activity shown by the co-assembly.It has been reported that a perturbed heme environment, and/or losses in alpha (α) helical content within cyt c, can result in increased peroxidase-like activity.26–29 Circular dichroism (CD) spectroscopy provides a convenient means to monitor such protein conformational changes. The CD measurements presented in Fig. 2B and Fig. 5 support the notion that, in the presence of a sufficient concentration of C-dots, the secondary structure of cyt c is perturbed to the point of losing most of its α-helical character.30 Upon further analysis using secondary structure prediction methods,31 it was found that the approximate α-helical content of the protein decreased from an initial value of 24% to just 2.3% upon the addition of CA-derived C-dots. Meanwhile, the random content rose from 34% to 41%. These results indicate that the global protein fold is seriously altered and, in concert with changes local to the heme group, is responsible for the large catalytic enhancement. Fig. 5B reveals substantial changes in the Soret region of the CD spectrum as well, indicating that the heme microenvironment is critically altered in the presence of C-dots.32 In particular, the Soret-region CD spectrum of cyt c in the presence of C-dots no longer retains the characteristic dichroic signature of ferri-cyt c.
 | ||
| Fig. 5 (A) Far-UV CD spectra of cyt c in the presence of CA-derived C-dots; [cyt c] = 4.2 μM and [C-dot] = 200 μg mL−1. It is evident that the secondary structure of cyt c is completely altered by the introduction of C-dots. (B) The local heme environment of cyt c is also disturbed by the presence of C-dots, as seen in the diminished Soret band at 410 nm. | ||
Conclusions
We have demonstrated that C-dots can function as efficient enzyme modulators to induce strong peroxidase activity in cyt c. Remarkably, by electrostatic assembly of cyt c onto oppositely-charged C-dots, the cyt c becomes an efficient biocatalyst for a reaction it was not evolved to perform. The emergent peroxidase activity is concomitant with significant changes in the protein secondary structure as well as alterations within the local environment surrounding the heme prosthetic group. This modulated behaviour is dependent upon the surface chemistry (particularly, surface charge) of the C-dots, with anionic dots derived from citric acid or citric acid/mercaptosuccinic acid imparting the highest peroxidase-like activity to cyt c. Control experiments suggest that, while electrostatic interactions are key, they may not be the sole contributor giving rise to strong peroxidase mimics and that the physical co-assembly at a nanoscale (high curvature) surface also appears to play a role. This work adds to our growing understanding of the interactions between nanocarbons and enzymes and suggests enticing prospects for nanocarbon-based modulation of other potential Fe-centered peroxidase mimics (e.g., CaHydA),33 with implications in bionanochemistry, sensing, and biocatalysis.Experimental
Materials and reagents
All experiments were carried out using Ultrapure Millipore water (18.2 MΩ cm). Equine heart cytochrome c (C7752, >95%), hydrogen peroxide (216763, 30 wt%), 2,2′-azino-bis(3-ethylbenzothiazoline-6-sulfonic acid) diammonium salt (ABTS, 11557, 98%), citric acid monohydrate (C0706, ≥99.5%), urea (51459, ≥99.5%), thiourea (T7875, ≥99.0%), mercaptosuccinic acid (88460, ≥99.0%), phosphate buffered saline (PBS) tablets (P4417), sodium phosphate monobasic monohydrate (71507, ≥99.5%), sodium phosphate dibasic (71636, ≥99.5%), sodium chloride (S7653, ≥99.5%), potassium bromide (451010, 99.95%), quinine hemisulfate (quinine sulfate) salt monohydrate (22640, ≥98.0%), fluorescein sodium salt (F6377), and tannic acid (16201) were all purchased from Sigma-Aldrich (St. Louis, MO) and used as received. Rhodamine 610 (rhodamine B) chloride (06101) was acquired from Exciton, Inc (Dayton, OH). Polyethylenimine (PEI) (19850, 99%; 10 kDa molecular weight) was purchased from Polysciences, Inc. (Warrington, PA). The chloride salts of Fe3+ (AC423705000, hexahydrate, 97+%) and Fe2+ (AC389350250, anhydrous, 99%) were obtained from Fisher Scientific (Pittsburg, PA). Cellulose dialysis tubing (132105, Spectra/Por 7, 1.0 kDa molecular weight cut-off, MWCO) was acquired from Spectrum Labs.Characterization techniques
UV-Vis absorbance spectra and data for the peroxidase activities and ABTS kinetic measurements were acquired on a Hitachi U-3000 spectrophotometer. All other absorbance spectra and fluorescence data were collected using a Cary Bio 50 UV-Vis spectrophotometer and a Varian Cary Eclipse Fluorometer, respectively. Quantum yield values were calculated based on the expression listed below with quinine sulfate (QS), fluorescein (FL), and rhodamine B (RB) as reference fluorophores (fluorophore and fluorescence measurement information is provided below in Table 1).Here, R and S represent reference and sample, respectively, F is the integrated fluorescence intensity (calculated over the wavelength range of interest), OD stands for optical density (at the excitation wavelength used in the fluorescent measurements), and n is the refractive index of the solvent (Table 1).

Transmission electron microscopy (TEM) studies were conducted on carbon coated copper grids (Ted Pella, Inc. 01822-F, support films, ultrathin carbon type-A, 400 mesh copper grid) using a FEI Tecnai (F30 G2, Twin) microscope operated at a 300 keV accelerating voltage. Fourier-transform infrared spectra were acquired on a Thermo-Nicolet Nexus 670 ESP FT-IR spectrophotometer using potassium bromide pellets. Circular dichroism spectra were collected on a Jasco J-710 spectropolarimeter and an average of 10 scans were used to produce the spectra. The cyt c/C-dot interactions presented in Fig. 1A were generated using protein modeling software (ePMV)22–24 and an open-source 3D creation suite (Blender™). The charge distribution within cyt c (Fig. 1B) was calculated and modeled using Adaptive Poisson–Boltzmann Solver (APBS).23,37
Carbon nanodot synthesis
The carbon nanodots were generated through a thermal pyrolysis approach. In all instances, citric acid (CA) was used as the primary carbon source while various nitrogen- and/or sulfur-containing compounds (e.g., urea, thiourea, and mercaptosuccinic acid) were employed as the dopant/passivating agent. To generate ‘undoped’ carbon nanodots CA (42 g) was carbonized alone. For the ‘doped’ samples, CA was combined with the dopant compound in a 1![[thin space (1/6-em)]](https://www.rsc.org/images/entities/char_2009.gif) :3 molar ratio except in the case of mercaptosuccinic acid in which a 1:1 ratio was employed. More specifically, 21 g of CA was combined with 18 g of urea, 25 g of thiourea, or 15 g of mercaptosuccinic acid to generate the resultant carbon dot samples CA–U, CA–T, and CA–M, respectively. The precursor combinations described were dissolved in 500 g of deionized water and were thermally treated at 200 °C for 24 h in a round-bottom flask immersed within an improvised sand bath consisting of an anodized aluminum round cake pan (Fat Daddio's) filled with copper-coated airgun BBs (0.177 caliber; Crosman Copperhead). Temperature control was achieved to within 2 °C using a digital stirring hotplate (Super-Nuova™; Thermo Scientific™) connected to a J-type thermocouple immersed in the BBs. Stirring was provided at 200 rpm using a PTFE-coated magnetic stir bar. A water addition of 200 g was made at the 12 h mark to prevent the samples from scorching. After naturally cooling to room temperature, the resultant thermally-treated solutions were centrifuged at 5000 rpm for 30 min to remove large particles. The samples were further purified via room temperature dialysis for 48 h against 1.5 L of water using 1 kDa MWCO cellulose tubing. The dialysate was replenished after 24 h and the samples were further dialyzed for an additional 24 h. Finally, the retentates were lyophilized and stored in a lab drawer (protected from light) until needed.
:3 molar ratio except in the case of mercaptosuccinic acid in which a 1:1 ratio was employed. More specifically, 21 g of CA was combined with 18 g of urea, 25 g of thiourea, or 15 g of mercaptosuccinic acid to generate the resultant carbon dot samples CA–U, CA–T, and CA–M, respectively. The precursor combinations described were dissolved in 500 g of deionized water and were thermally treated at 200 °C for 24 h in a round-bottom flask immersed within an improvised sand bath consisting of an anodized aluminum round cake pan (Fat Daddio's) filled with copper-coated airgun BBs (0.177 caliber; Crosman Copperhead). Temperature control was achieved to within 2 °C using a digital stirring hotplate (Super-Nuova™; Thermo Scientific™) connected to a J-type thermocouple immersed in the BBs. Stirring was provided at 200 rpm using a PTFE-coated magnetic stir bar. A water addition of 200 g was made at the 12 h mark to prevent the samples from scorching. After naturally cooling to room temperature, the resultant thermally-treated solutions were centrifuged at 5000 rpm for 30 min to remove large particles. The samples were further purified via room temperature dialysis for 48 h against 1.5 L of water using 1 kDa MWCO cellulose tubing. The dialysate was replenished after 24 h and the samples were further dialyzed for an additional 24 h. Finally, the retentates were lyophilized and stored in a lab drawer (protected from light) until needed.
Buffer preparation
Phosphate buffer (PB) was prepared at a concentration of 10 mM and pH of 7.37 by dissolving 0.406 g of sodium phosphate monobasic and 0.9957 g of sodium phosphate dibasic in 1.0 L of water (ionic strength, μ ≈ 0.02 M). Phosphate buffered saline (PBS) was prepared by dissolving one PBS tablet in 200 mL of water, resulting in a pH 7.4, 10 mM phosphate buffer containing 2.7 mM potassium chloride and 137 mM sodium chloride (μ ≈ 0.16 M). These solutions were then used to dissolve lyophilized cyt c and dry ABTS to prepare appropriately concentrated stocks.Peroxide-like activity measurements
Peroxidase-like activities of CA, CA–T, CA–U, and CA–M derived C-dots were tested by monitoring the absorbance of ABTS at 418 nm. In a typical catalytic experiment, the cyt c concentration was 515 nM, ABTS concentration was 0.72 mM, C-dot concentration was 25.5 μg mL−1, and peroxide concentration was 14.1 mM. To accomplish the study, 20 μL of a 1 mg mL−1 (80.75 μM) cyt c stock, 100 μL of a 12.35 mg mL−1 (22.5 mM) ABTS stock, and 8 μL of a 10 mg mL−1 C-dot solution were added to 3 mL of water in a quartz cuvette. The mixture was inverted 3 times and allowed to incubate for 30 min prior to the addition of 5 μL of cold 30 wt% H2O2. Immediately following the H2O2 addition, UV-Vis absorbance spectra were collected for a duration of at least 5 min. For the CA C-dot loading optimization, the above approach was also employed, varying the final concentration of C-dots within the cuvette from 0.10 to 50 μg mL−1. All other concentrations and volumes were maintained. For the iron control experiments, cyt c was replaced by Fe2+ or Fe3+ at a concentration of 515 nM (identical to the [cyt c] used previously). All other concentrations and volumes remained identical (i.e., [C-dots] = 25.5 μg mL−1). The experimental parameters for the molecular analog control studies were identical to those used for the initial C-dot screening tests except that, in place of C-dots, model molecules at a final concentration of 2.5 μg mL−1 were used. Finally, the same conditions used for C-dot screening were used in different solvent systems (water, PB, or PBS) to elucidate the interaction between the CA derived C-dots and cyt c.Michaelis–Menten kinetics
To characterize the peroxidase activity, kinetic measurements were conducted in the presence of CA-derived C-dots for varying ABTS concentrations that ranged from 0.037 mM to 0.718 mM. The C-dot, peroxide, and cyt c concentrations were held identical to the experiments described above. The initial velocities were determined by linear regression over the first minute of data collection and were plotted as a function of ABTS concentration. Using these values, a double-reciprocal Lineweaver–Burk plot was generated to attain Vmax, KM, kcat, and catalytic efficiency (kcat/KM) values. To calculate Vmax and Km, the equation for the linear fit of the Lineweaver–Burk plot was used. Vmax was calculated (eqn (1)) by taking the reciprocal of the y-intercept (b), and KM was calculated (eqn (2)) by multiplying Vmax by the slope of the line. kcat was then calculated by dividing Vmax by the protein concentration in the cuvette (eqn (3)). Catalytic efficiency was calculated by dividing kcat by KM (eqn (4)). | (1) |
| KM = Vmax × (slope of line) | (2) |
 | (3) |
 | (4) |
Circular dichroism
Circular dichroism (CD) measurements were carried out to probe the effects that the C-dots have on the cyt c secondary structure. For the Soret region, a 1 cm quartz cuvette was used for data collection while for the far-UV region a 1 mm path length quartz cuvette was used. The concentrations of cyt c and C-dots were 4.17 μM and 207 μg mL−1, respectively. The mixture of cyt c and C-dots was allowed to incubate for 30 min prior to data collection. Spectra were collected in the Soret region from 300–500 while the UV was collected from 185–250 nm. The helical content was calculated according to the concentration-independent method of Raussens et al.31695 nm absorbance band of cyt c
Three separate samples were prepared (CA-derived C-dots, cyt c, and cyt c plus CA-derived C-dots) within 3 mL PMMA cuvettes. The freshly-prepared CA-derived C-dot and cyt c stock concentrations were 10 mg mL−1 and 50 μM, respectively. A C-dot concentration of 853 μg mL−1 was used and the cyt c concentration was 32 μM. Specifically, 256 μL of 10 mg mL−1 C-dots and 1.92 mL of 50 μM cyt c stock solutions were added to two separate cuvettes, followed by dilution to a 3 mL total volume using deionized water. For the mixed sample, these volumes remained the same and the total volume was again adjusted to 3 mL using deionized water.References
- W. Shang, J. H. Nuffer, V. A. Muñiz-Papandrea, W. Colón, R. W. Siegel and J. S. Dordick, Small, 2009, 5, 470–476 CrossRef CAS PubMed.
- X. Yang, C. Zhao, E. Ju, J. Ren and X. Qu, Chem. Commun., 2013, 49, 8611–8613 RSC.
- H. Li, S. Guo, C. Li, H. Huang, Y. Liu and Z. Kang, ACS Appl. Mater. Interfaces, 2015, 7, 10004–10012 CAS.
- N. W. S. Kam and H. Dai, J. Am. Chem. Soc., 2005, 127, 6021–6026 CrossRef CAS PubMed.
- S. Radic, P. Nedumpully-Govindan, R. Chen, E. Salonen, J. M. Brown, P. C. Ke and F. Ding, Nanoscale, 2014, 6, 8340–8349 RSC.
- L. Jin, K. Yang, K. Yao, S. Zhang, H. Tao, S.-T. Lee, Z. Liu and R. Peng, ACS Nano, 2012, 6, 4864–4875 CrossRef CAS PubMed.
- T. Kar, S. K. Mandal and P. K. Das, Chem. Commun., 2012, 48, 8389–8391 RSC.
- M. De, S. S. Chou and V. P. Dravid, J. Am. Chem. Soc., 2011, 133, 17524–17527 CrossRef CAS PubMed.
- S. S. Chou, M. De, J. Luo, V. M. Rotello, J. Huang and V. P. Dravid, J. Am. Chem. Soc., 2012, 134, 16725–16733 CrossRef CAS PubMed.
- S. N. Baker and G. A. Baker, Angew. Chem., Int. Ed., 2010, 49, 6726–6744 CrossRef CAS PubMed.
- B. Zheng, T. Liu, M. C. Paau, M. Wang, Y. Liu, L. Liu, C. Wu, J. Du, D. Xiao and M. M. F. Choi, RSC Adv., 2015, 5, 11667–11675 RSC.
- J. B. Essner, C. H. Laber, S. Ravula, L. Polo-Parada and G. A. Baker, Green Chem., 2016, 18, 243–250 RSC.
- S. Huang, H. Qiu, S. Lu, F. Zhu and Q. Xiao, J. Hazard. Mater., 2015, 285, 18–26 CrossRef CAS PubMed.
- T. Han, T. Yan, Y. Li, W. Cao, X. Pang, Q. Huang and Q. Wei, Carbon, 2015, 91, 144–152 CrossRef CAS.
- S. Li, Z. Peng and R. M. Leblanc, Anal. Chem., 2015, 87, 6455–6459 CrossRef CAS PubMed.
- S. Li, L. Wang, C. C. Chusuei, V. M. Suarez, P. L. Blackwelder, M. Micic, J. Orbulescu and R. M. Leblanc, Chem. Mater., 2015, 27, 1764–1771 CrossRef CAS.
- S. Mondal, R. Thirupathi and H. S. Atreya, RSC Adv., 2015, 5, 4489–4492 RSC.
- H. Li, W. Kong, J. Liu, M. Yang, H. Huang, Y. Liu and Z. Kang, J. Mater. Chem. B, 2014, 2, 5652–5658 RSC.
- J. B. Essner, C. H. Laber and G. A. Baker, J. Mater. Chem. A, 2015, 3, 16354–16360 CAS.
- M. J. Krysmann, A. Kelarakis, P. Dallas and E. P. Giannelis, J. Am. Chem. Soc., 2011, 134, 747–750 CrossRef PubMed.
- D. Qu, M. Zheng, P. Du, Y. Zhou, L. Zhang, D. Li, H. Tan, Z. Zhao, Z. Xie and Z. Sun, Nanoscale, 2013, 5, 12272–12277 RSC.
- G. T. Johnson, L. Autin, D. S. Goodsell, M. F. Sanner and A. J. Olson, Structure, 2011, 19, 293–303 CrossRef CAS PubMed.
- M. F. Sanner, A. J. Olson and J.-C. Spehner, Biopolymers, 1996, 38, 305–320 CrossRef CAS PubMed.
- D. Frishman and P. Argos, Proteins, 1995, 23, 566–579 CrossRef CAS PubMed.
- P. A. Mabrouk, Bioconjugate Chem., 1994, 5, 236–241 CrossRef CAS PubMed.
- S. Debnath, D. Das and P. K. Das, Biochem. Biophys. Res. Commun., 2007, 356, 163–168 CrossRef CAS PubMed.
- A. Ranieri, F. Bernini, C. A. Bortolotti, A. Bonifacio, V. Sergo and E. Castellini, Langmuir, 2011, 27, 10683–10690 CrossRef CAS PubMed.
- R. E. M. Diederix, M. Ubbink and G. W. Canters, Eur. J. Biochem., 2001, 268, 4207–4216 CrossRef CAS PubMed.
- R. E. M. Diederix, M. Ubbink and G. W. Canters, ChemBioChem, 2002, 3, 110–112 CrossRef CAS PubMed.
- N. J. Greenfield, Nat. Protoc., 2006, 1, 2876–2890 CrossRef CAS PubMed.
- V. Raussens, J.-M. Ruysschaert and E. Goormaghtigh, Anal. Biochem., 2003, 319, 114–121 CrossRef CAS PubMed.
- G. A. Baker and W. T. Heller, Chem. Eng. J., 2009, 147, 6–12 CrossRef CAS.
- C. Madden, M. D. Vaughn, I. Díez-Pérez, K. A. Brown, P. W. King, D. Gust, A. L. Moore and T. A. Moore, J. Am. Chem. Soc., 2012, 134, 1577–1582 CrossRef CAS PubMed.
- J. R. Lakowicz, Principles of Fluorescence Spectroscopy, Springer, 2007 Search PubMed.
- L. Porrès, A. Holland, L.-O. Pålsson, A. Monkman, C. Kemp and A. Beeby, J. Fluoresc., 2006, 16, 267–273 CrossRef PubMed.
- D. Magde, G. E. Rojas and P. G. Seybold, Photochem. Photobiol., 1999, 70, 737–744 CrossRef CAS.
- N. A. Baker, D. Sept, S. Joseph, M. J. Holst and J. A. McCammon, Proc. Natl. Acad. Sci. U. S. A., 2001, 98, 10037–10041 CrossRef CAS PubMed.
Footnote |
| † Electronic supplementary information (ESI) available: Full experimental details, characterizations, and supporting figures. See DOI: 10.1039/c6tb00052e |
| This journal is © The Royal Society of Chemistry 2016 |