DOI:
10.1039/C6SM00995F
(Paper)
Soft Matter, 2016,
12, 6451-6462
The interaction of protein-coated bionanoparticles and surface receptors reevaluated: how important is the number of bonds?†
Received
28th April 2016
, Accepted 6th July 2016
First published on 6th July 2016
Abstract
Specifically designed bionanoparticles with a function-oriented protein-coating layer interact with self-prepared receptor surfaces as the counterpart. Based on surface plasmon resonance biosensing experiments, a model framework is validated to estimate the number of bonds formed between these bionanoparticles and the receptor surface based on multivalent interactions. Our multi-site kinetic model is able to analyze the adsorption rate constants and the number of bonds from experimental data of natural and synthetic bionanoparticles. The influence of the mass transport on the adsorption kinetics is modeled including a diffusional boundary layer where a helpful analytical solution has been derived. Our model framework extends previous studies to include a higher number of bonds, ranging from 1 up to 1000. An almost linear relationship between the number of bonds and the adsorption amount of bionanoparticles makes the model framework suitable to predict, for example, ligand density and to further assess coating performance. The proposed model framework can serve as a design tool for multivalent interaction experiments under variable process conditions.
1. Introduction
The functionality of a biological system relies on the interaction between the individual parts and components. By these interactions, the fundamental processes of recognition,1 transport2 and signaling3 are driven and regulated. Typically, two parts or entities interact in complex ways, often by multivalent interactions. In order to fulfill a given functionality, for example for transport, these multivalent interactions can be enhancing or inhibiting. If multivalent interactions are enhanced, they can promote for example the avidity between influenza virus nanoparticles and their corresponding receptors in an affinity chromatography downstream purification process of vaccine production.4–6 If multivalent interactions are inhibited, for example by polymer addition,7–9 the attachment of the influenza virus to erythrocytes and subsequently an infection are prevented. The option to switch between enhancement and inhibition relies highly on the inherent properties of the multivalent interactions. In order to manipulate the properties of interacting entities, we require a systematical bank of knowledge, experimentally as well as theoretically. Here, either natural systems or a specifically designed synthetic system can be applied to create this important knowledge base.
Two interacting biological entities in a liquid environment can be either natural or application-oriented synthetic partners. Synthetic systems have been developed by current nanotechnologies, examples are nanocarriers targeting cells as a promising pharmacotherapy,10,11 or virus like particles.12,13 In Fig. 1a, a typical partner system is shown, where a spherical particle (entity 1) interacts with a surface (entity 2) in a liquid flow.14,15 Generally speaking, studies of such a system may include the scaffold and linker,16–20 the liquid environment,21 the ligand of entity 122–24 and the receptors of entity 2.25 All of these parts support the interaction, either monovalent or multivalent as illustrated in Fig. 1b. The valency of interaction is defined by the number of bonds (here, a symbol of n) formed between ligands of entity 1 and receptors of entity 2. For monovalent interaction n = 1, while for multivalent interaction n ≥ 2. The study of the interaction mechanism includes adsorption and desorption. Under changing environmental conditions, the adsorbing and desorbing behavior depends strongly on the number of bonds. This number n is important to evaluate cooperativity (bond strength) or to jointly analyze kinetics and thermodynamics for interacting biological partners.
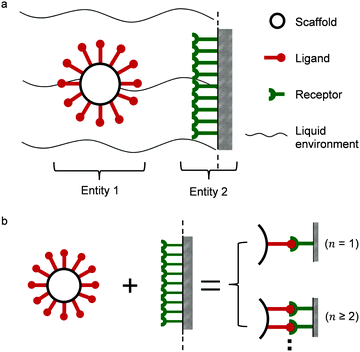 |
| | Fig. 1 (a) Illustration of multivalent interactions between two interacting partners, where entity 1 is a bionanoparticle and entity 2 the receptor surface. (b) Definition of multivalence. n stands for the number of bonds formed between the ligands of entity 1 and the receptors of entity 2. | |
The binding models are developed to understand the adsorption and desorption under the influence of the number of bonds. The most common kinetic model is the Langmuir binding model (n = 1),26–28 which indeed provides an easy way to evaluate the kinetic rate and equilibrium constants in terms of simple equations and the cheap computation. Because of the prevention of the multivalent information in the system, however, efforts have been made to establish alternative models in order to improve the interpretation of the binding behavior between ligands and receptors influenced by the number of bonds. For this purpose, some bivalent binding models (n = 2) were developed. Müller et al., for example, proposed a model to quantitate the influence of bivalent binding.29 Furthermore, Tassa et al. realized the weakness of the Langmuir binding model and extended it to a simple binary interaction model in order to fit the experimental data better.30 Schiavo et al. measured and interpreted the behavior of bivalent attachments under force based on an experimental model system of monovalent attachments.31 A simple extension of bivalent models to include trivalent interactions (n = 3) would not lead to a really appropriate estimation of avidity. If the number of bonds in the experimental system is higher, the deviation between experimental observations and these models would just increase. In general, the higher number of bonds leads to alternative models to study the interaction mechanism. For example, Chou et al. proposed a linear surface reaction scheme to describe the ligand–receptor binding events at the cellular surface as a multistage surface kinetics.32 Dongen et al. proposed a folate-keyed interaction between a dendrimer (entity 1 with a folate as ligand) and a surface (entity 2 with a protein as receptor) in the general framework of slow-onset, tight-binding mechanisms.33 All of the models mentioned here, monovalent, bivalent, or higher-valent, require the information regarding the number of the bond n as a known input value. The question raised is: is it possible to determine the number of bonds formed inherently between two biological partners? With this number, one could then closely relate the experimental observation to theoretical modeling and create a knowledge database for multivalent interactions.
To answer the question, this work aims to establish a suitable kinetic model to estimate the intrinsic number of bonds formed between two multivalent-interacting entities in a biological system as depicted in Fig. 1, and to analyze the correlations of the kinetics and the equilibrium related to this number of bonds. For this purpose, the modeling framework is connected to the experimental surface plasmon resonance (SPR) biosensing system. The broadly applied SPR system can monitor multivalent interactions (see Fig. 1). Accordingly, a geometrical model including the microfluidic domain of the SPR unit is required in our modeling framework. The SPR experimental data may reflect not only the inherent interaction kinetics at the receptor surface but also the transport mechanism between the fluidic bulk and the receptor surface. Thus, the analysis of the mass transport (convection and diffusion) is necessary to improve the estimation of adsorption rate constants.34,35 As a consequence of this consideration, the model framework for the multivalent interaction contains not only the interaction kinetic model, but also the model for the transport phenomena, including momentum and mass. By comparing the transport rates to the intrinsic interaction kinetic rates, there are two limiting cases where the model of the mass transport can be simplified: the transport-limited case36,37 and the kinetic-limited case.38,39 But it is difficult to differentiate between the transport limitation and the kinetic limitation in this interaction process. It is highly possible to either underestimate or overestimate the rate constants.40 In order to improve our estimation, we model the transport phenomena based on the boundary layer theory. The interaction kinetics is simulated by the multisite kinetic model, which we validated in a previous work in order to estimate the number of bonds formed between the influenza virus particles and the biosensing surface.41
Our model framework is then evaluated by adsorption data from the SPR experiments with three examples in terms of entity 1 in Fig. 1. Entity 1 will be termed briefly as the “bionanoparticle” in the following. We study the three bionanoparticles: influenza virus nanoparticles, human IgG ligands, and human IgG coated nanoparticles. The receptor for influenza virus is chosen as Euonymus europaeus lectin in accordance with the avidity.41 The synthetic bionanoparticles were prepared by coating the polystyrene nanoparticles (110 nm in diameter) with polyclonal human IgG with the help of a carbodiimide reaction. Correspondingly, Protein A was chosen as the receptor and immobilized at the SPR sensor surface. A study performed by Yang et al. showed that two IgGs bind to one Protein A,42 which verifies that the interaction in this work belongs to the multivalent interaction. According to the results of nonlinear least square fitting, the model framework is capable to analyze not only the natural entities (influenza viruses and human IgG) but also the synthetic entities (human IgG coated nanoparticles). Furthermore, the developed model framework has been successfully applied to analyze the adsorption kinetics of the established multivalent interactions under the influence of ligand density and receptor density.43 After the evaluations, the model framework is used to simulate the multivalent interactions between the bionanoparticles and the surface, especially focusing on the investigation of the number of bonds.
2. Model framework
A multi-site approach describing the kinetics of the multivalent adsorption at the receptor surface is developed in Section 2.1. This multi-site kinetic model is later validated using experimental data from SPR spectroscopy. In order to incorporate transport phenomena of the SPR system which may partially influence the experimental data set, a model framework combining multi-site kinetics and fluid flow is introduced. Certain assumptions are made according to experimental constraints. As shown in Fig. 2 with a step-input signal (upper part), the SPR device detects the amount of bionanoparticles adsorbed on the probing area on top of the flow cell while the solution flows continuously through the cell (x-direction) at the constant flow rate. A quasi-2D flow is assumed to neglect the model equations in the z-direction due to the large aspect ratio (w/2h ≫ 1). The system equations of the model framework in Fig. 2 (bottom part, middle panel) include three parts: the multisite kinetic model, the equations for the flow field, and the mass balances. In Section 2.2, the 2D momentum balances will be simplified by applying the classical boundary layer theory, which leads to an analytical expression for the flow field in the SPR flow cell. Based on that, the mass balance of the bionanoparticles transported by the fluid flow can be formulated. The mass balance in the fluid is coupled with the mass balance of bionanoparticles adsorbed at the receptor surface through the multivalent interaction (see Section 2.3).
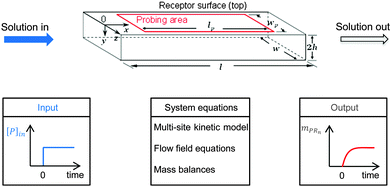 |
| | Fig. 2 Sketch of the fluid domain (upper part) and illustration of the system behavior (bottom part). The geometrical parameters are l = 2 mm, w = 0.5 mm, h = 0.01 mm, lp = 1.8 mm, and wp = 0.2 mm. [P]in is the inlet concentration of the bionanoparticle solution. mPRn(t) is the amount of adsorbed bionanoparticles at the receptor surface. | |
2.1. Multivalent adsorption kinetics
Due to a strong binding and corresponding high avidity of the bionanoparticles to the receptor surface, we assume an irreversible and monolayer adsorption which was also experimentally observed for influenza viruses.40 Regarding the mechanism of the multivalent interaction, it is crucial to consider the binding sequence between the ligands and the receptors. Fig. 3 shows that three main modes can be proposed in terms of binding: all-or-none (a → d), zipper-like (a → b → c → d), or an intermediate mode (a → c → d, or a → b → d). They can be implied from the observed unbinding pathways of the influenza viruses which contained both zipper-like and all-or-none events.44 We employ the all-or-none mode (a → d) and assume the single nanoparticle as one unit and its corresponding group of receptors at the surface as another unit. Then, the kinetic expression for the rate of nanoparticle adsorption, r, is formulated as follows:| | | r = ka·[P](t,x,y = 0)·[Rn] | (1) |
where ka is the adsorption rate constant, [P](t,x,y = 0) is the concentration of bionanoparticles in the vicinity of the adsorbing surface (where y = 0), and [Rn] is the concentration of the group of receptors at the adsorbing surface.
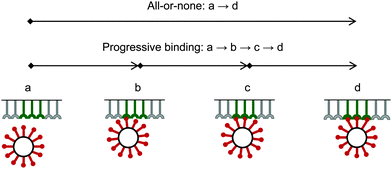 |
| | Fig. 3 Binding modes between bionanoparticles and receptors. For one example, the average number of bonds between one bionanoparticle and receptor surface was finally shown as n = 3. | |
The coating of polystyrene nanoparticles with the polyclonal human IgG is performed in homogenous medium and as a consequence the ligand coverage may be assumed to be homogeneous as well. Furthermore, the distribution of Protein A at the sensing surface has to be considered. The issue of heterogeneity of the SPR surface was discussed in details by Schuck et al.35 and with another statistical approach by Mullen et al.23 We follow the principle of Occam's razor and assume that the distributions of both ligand and receptor are homogeneous.
The bonds between the two biological partners are shared by the ligands of the bionanoparticles and the receptors on the surface. Thus, there are two possible ways to formulate the number of bonds as a key parameter studied here, either related with the ligands or with the receptors. A linear lattice model proposed first by McGhee and von Hippel is employed45 to formulate the number of bonds, i.e. the multivalent interaction. By comparing the flat plane of the receptor surface to the sphere of the bionanoparticle, the multivalence is directly modeled at the receptor side with the term [Rn], [receptors per mm2]:
| | 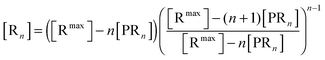 | (2) |
where
n is the number of the bonds as shown in
Fig. 1, [R
max] is the capacity of the receptor surface, [receptors per mm
2] which was experimentally determined, and [PR
n] stands for the bionanoparticle concentration adsorbed at the surface, [particles per mm
2].
2.2. Flow field equations
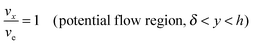
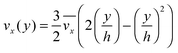
The fluid flow in the SPR channel is assumed to be steady and laminar with a constant total mass density and constant viscosity. The force of gravity is neglected. The bionanoparticles are assumed to have the same velocity as the fluid. The feed profile is assumed to be an ideal plug flow with a given velocity: 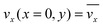 and vy(x,y) = 0. As illustrated in Fig. 4, in the entrance region (0 < x < le), the flow profiles are developing until the boundary layers meet in the middle of the channel. Within the entrance region, the velocity profile is approximated by the following functions:
| | 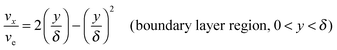 | (3) |
| |  | (4) |
with ve = ve(x) and the thickness of the velocity boundary layer δ = δ(x). Based on this profile, the 2D momentum balances along with the 2D total mass balance were solved using the integral method of von Kármán.46 This yields the following analytical expression for the length of the entrance region:| |  | (5) |
where,  is the average velocity and v is the kinematic viscosity.
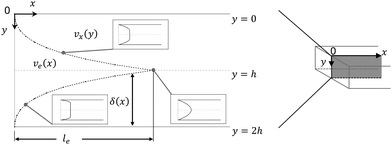 |
| | Fig. 4 Entrance region of the SPR flow cell in terms of the velocity profile. δ(x) is the thickness of the velocity boundary layer. vx(y), eqn (4), is the velocity of the fluid in the velocity boundary-layer region and ve(x), eqn (1) and (2), is the velocity of the fluid in the potential flow region between two velocity boundary layers. Velocity profiles at three different positions are depicted. le, eqn (5), is the length of the entrance region. | |
Thus, the length ratio, le/l ≈ 5 × 10⁻⁴ (see ESI†), clearly indicates that the entrance region can be neglected, i.e. a fully developed velocity profile is assumed throughout the SPR flow cell.
The applied fluid flow equation reads as:
| |  | (6) |
2.3. Mass balances of bionanoparticles
As already highlighted in the introduction section, if the rate of the mass transport is not faster than the rate of the adsorption, the experimental curves reflect not only the adsorption kinetics but also the mass transport. Considering the experimental time in this work, the solution of the nanoparticles was injected in a timeframe of 390 seconds. The experimental data do not show an equilibration in this timeframe from which we may assume that adsorption is still in its initial range. It implies that the adsorption rate is relatively fast compared to the rate of the mass transport in the experimental system studied here, and that a diffusional boundary layer of the bionanoparticles in the neighborhood of the receptor surface is present. To incorporate the mass transport phenomena we model the mass balances using the boundary layer theory in this section. The derivation starts with the classical mass balance of bionanoparticles in the fluid. Then the mass balance equations can be reduced by the analysis of the order of magnitude. The formulation of the bionanoparticle concentration in the fluid is another point to help formulate the final equation of the thickness of the diffusional boundary layer.
Based on the velocity profile in the flow field section, the 2D mass balance of bionanoparticles in the fluid is given by
| | 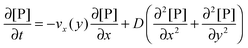 | (7) |
where [P] stands for the bionanoparticle concentration, [particles per mm
3]. The diffusivity of bionanoparticles
D is estimated from the Stokes–Einstein equation
D =
kT/(6π
rPηw) (see ESI
†). By introducing dimensionless time, space, and concentration variables:
τa =
t/
ta,
X =
x/
l,
Y =
y/
δD,
θP,l = [P]/[P]
in,

,
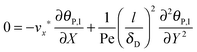
eqn (7) can be reformulated as follows:
| | 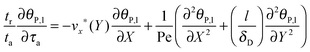 | (8) |
where

stands for the Peclet number and
δD is the thickness of the diffusional boundary layer. From
eqn (8) it is concluded that, due to the fact that
l/
δD ≫ 1, the diffusional transport of virus particles in
y-direction is dominant,
i.e. the diffusional transport in
x-direction is negligible. Furthermore, the importance of the accumulation term of
eqn (8) depends on the ratio of the residence time,
tr, to the characteristic time constant of the adsorption,
ta. The residence time of the nanoparticle solution in the flow cell is
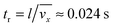
. The characteristic adsorption time can be estimated from the experimental observations and is in the order of
ta = 100 s. The ratio of characteristic time constants is therefore
tr/
ta ≪ 1. Thus, the accumulation term in
eqn (8) is several orders of magnitude smaller than the convective transport term. Consequently, as we are interested to analyze experimental SPR data on the time scale of
ta = 100 s, the following simplified mass balance of the bionanoparticles in the liquid solution is applied:
| |  | (9) |
The bionanoparticle concentration profile in the diffusional boundary layer, [P](
t,
x,
y), can be approximated by a third-order polynomial profile: [P](
t,
x,
y) =
a +
by +
cy2 +
dy3 (0 ≤
y ≤
δD(
x)), where
a,
b,
c, and
d are functions of
x and
t. There are four boundary conditions (BC) in total. BC 1 results from
eqn (9) by introducing the non-slip condition of the velocity at the surface (
vx(
y = 0) = 0). BC 2 expresses the fact that the bionanoparticle diffusion rate to the receptor surface is equal to the bionanoparticle adsorption rate,
r, at the receptor surface. BC 3 and BC 4 are assumed at the outer edge of the diffusional boundary layer.
| |  | (10) |
| | 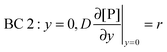 | (11) |
| | 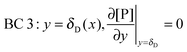 | (12) |
| | | BC 4: y = δD(x), [P](t,x,y = δD) = [P]in | (13) |
By introducing the four boundary conditions to the polynomial profile, the bionanoparticle concentration in the boundary layer is given by
θP,l = 1 −
r*
δD*/3 +
r*
Y/2 −
r*
Y3/6(
δD*)
2 for (0 ≤
Y ≤ 1). Finally, the governing equation for the diffusional boundary layer thickness is yielded by integrating
eqn (9) from
Y = 0 to
Y = 1, and combined with
eqn (6):
| |  | (14) |
with the dimensionless thickness of the diffusional boundary layer,
δD* =
δD/
h, and the dimensionless adsorption rate,
r* = (2
hr)/(
D[P]
in).
The mass balance of bionanoparticles at the receptor surface is given by ∂[PRn]/∂t = r. It is solved simultaneously with the mass balance of bionanoparticles in the fluid, eqn (14), and the dimensionless formulation is:
| |  | (15) |
where
θP,s = [PR
n]/[R
max],
τ =
t/(2
h[R
max]/(
D[P]
in)).
The two coupled mass balances, eqn (14) and (15), require the formulation of two initial conditions (IC):
| | | IC 2: θP,s(τ = 0, X) = 0 | (17) |
Finally, the multi-site kinetic model in the dimensionless formulation is derived by introducing
θP,l(
Y = 0) and putting
eqn (2) into
eqn (1):
| |  | (18) |
where Da stands for the Damköhler number, Da = 2
h[R
max]
ka/
D (see
ref. 41).
For the special case n = 1, eqn (18) turns into the classical Langmuir binding model:
| |  | (19) |
As a summary, the model framework to evaluate the multivalent interaction consists of three key equations:
eqn (14), (15), and (18). There are two independent variables (
τ and
X), three dependent variables (
θP,s,
δD* and
r*), and four dimensionless parameters (Pe, (
l/
h), Da, and
n). Only Da and
n are unknown and have to be estimated from the adsorption experiments, while all other quantities are determined either from the SPR flow cell geometry or the operating conditions. When comparing the model simulations with the experimental data, one has to account for the fact that the probing area represents only a certain proportion of the whole flow cell surface. The observable cell response is expressed in terms of the width and length of the probing area in
Fig. 2,
wp and
lp respectively, and the amount of adsorbed bionanoparticles:

.
mPRn(
t) is the output quantity which is fitted to the SPR experimental data with the dimensionless quantity of
Θ =
mPRn/([R
max]
lpwp). The parameter estimation of Da and
n is implemented by the least squares fitting based on the Gauß–Newton method. The calculation details of the equations are included in the ESI.
†
3. Experimental
3.1. Synthesis of the bionanoparticles
The nanoparticles were purchased from Invitrogen™, Life Technologies (F8803) and have an average diameter of 110 nm with the carboxylate groups stretching out from the particle surface. The synthetic bionanoparticles were prepared by coating the nanoparticles with polyclonal human IgG (I2511, Sigma Aldrich, Germany) via a carbodiimide reaction. First, 5.4 × 10¹² particles per ml nanoparticle solution was activated by 0.2 M EDC (N-(3-dimethylaminopropyl)-N′-ethylcarbodiimide hydrochloride, 03449, Sigma Aldrich, Germany) and 0.05 M NHS (N-hydroxysuccinimide, 130672, Sigma Aldrich, Germany) in 10 mM MES (2-(N-morpholino) ethanesulfonic acid monohydrate, 6066, Carl Roth, Germany), pH 6 at 25 °C for 2 hours. After the activation, the mixture was dialyzed against 10 mM sodium phosphate, 150 mM NaCl, pH 7.4, at room temperature for 24 hours to remove the unreacted EDC and NHS and to change the buffer condition as well. Then, the nanoparticle solution was added into 130 μg ml−1 human IgG in 10 mM sodium phosphate, 150 mM NaCl, pH 7.4. The solution was kept for 24 hours at 1 °C. After expiry of this period, the unreacted groups were blocked by 100 mM glycine (G8898, Sigma Aldrich, Germany) for 2 hours at 25 °C. Finally, all unreacted materials were removed from the coated nanoparticles with Vivaspin 20 (VS2061, Sartorius AG, Germany). Here, the centrifugation was performed with an Eppendorf Centrifuge 5702 RH under the conditions: 2000 × g, 4 °C, 5 minutes per time and 3 times. The prepared bionanoparticles were then stored at 4 °C for further use. The size of the synthetic bionanoparticles was measured with a Malvern Zetasizer Nano ZS device.
3.2. SPR experiments
The SPR experiments were performed with a BIAcoreTM 3000 device (GE Healthcare, Sweden) at 25 °C. Virus particle experiments were carried out under conditions given in ref. 41. Protein A (B-2001, Vector Laboratories) was immobilized at the surface of the sensor chip C1 (GE Healthcare Bio-Sciences AB, Sweden) by an ammine coupling kit under the same operating conditions as in the case of the influenza virus particles.41 The running buffer (RB) here was 10 mM sodium phosphate, 150 mM NaCl, 0.005% Tween 20, pH 7.4. Before the injections of the synthetic bionanoparticles, human IgG solutions were injected to determine the surface capacity of the receptor surface, [Rmax]. The synthetic bionanoparticles (3 × 10⁶ particles per μl) were then injected through the flow cells at 50 μl min−1, 6.5 minutes, twice with regeneration steps in between. The bionanoparticle covered surfaces were regenerated by 0.1 M glycine pH 2 at 50 μl min−1, 30 seconds, followed by another injection of RB at 50 μl min−1, 6.5 min.
4. Results and discussion
4.1. Evaluating the model framework by SPR experiments
As discussed in the introduction, due to the combination of mass transport and multivalent interaction kinetics, the model of the transport phenomena was developed, using estimated parameters.37,40,47 The lumped parameters would provide us with a quick approach to analyze the SPR data, but prevent us to know the dynamics of the particle transport in the flow direction and its correlation with the adsorption kinetics. In view of these limitations, we formulate the momentum and mass transport equations in a distributed way by using the boundary layer theory. In Section 2, we have shown that for the microfluidic flow analyzed here by the appropriate assumptions, the concentration of the bionanoparticles is still in the entrance region of the diffusional boundary layer while the particle velocity is already in a fully developed field (see Section 2.2). The model of the mass transport is finally derived as an equation of the thickness of the diffusional boundary layer, see eqn (14). Coupled with the adsorption rate r, the diffusional boundary layer is also influenced by the other parameters: the geometrical size of the flow cell (l, h, w), the diffusivity of the bionanoparticles (D), the flow rate (Q), and the inlet concentration ([P]in).
Using flow field conditions from experiments with influenza virus nanoparticles,41Fig. 5 illustrates the dynamic distribution of the diffusional boundary layer in the flow direction and the profile development of the concentration of the bionanoparticles diffusing laterally to the receptor surface. By comparing the longitudinal profiles of the diffusional boundary layer at τ = 0 and τ = 1 in Fig. 5a, one can see that the thickness of the diffusional boundary layer decreases with time. Furthermore, the decreasing size of the lateral distance is small enough to be negligible within the timeframe of our experiments of around hundreds of seconds. The decrease of the thickness of the diffusional boundary layer corresponds to a lower adsorption rate (see eqn (1)). The decrease of this adsorption rate in turn is due to a lower availability of receptors because of their occupation by bound bionanoparticles. With all parameters fixed we use eqn (14) to study the influence of the inlet concentration [P]in on the mass transport in Fig. 5b. It can be seen that even with a 5-fold increase in concentration, the thickness of the diffusional boundary layer decreases only slightly. We conclude that smaller changes in inlet concentration will not influence the thickness of the diffusional boundary layer.
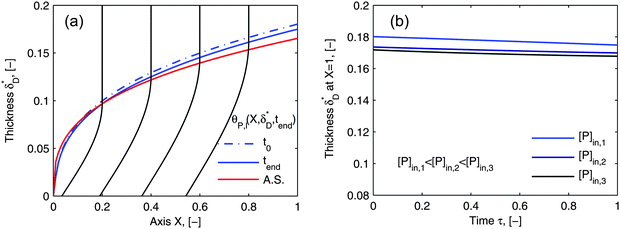 |
| | Fig. 5 Profiles of the diffusional boundary layer thickness δD*. (a) Development in X-direction at the beginning, t0, and end, tend, of the adsorption experiment. “A.S.” stands for the analytical solution of eqn (20). Concentration profiles, θP,l(X,δD*,tend), at four different X-positions are depicted in the black lines. The calculation parameters are [P]in,1 = 1.015 × 10⁶ particles per μl, D = 3.76 × 10⁻¹² m2 s−1 as the diameter of 130 nm, and [Rmax] = 1.19 × 10⁹ receptors per mm2.41 (b) Comparison of the diffusional boundary layer thickness at the outlet of the flow cell for three different inlet concentrations: [P]in,3 = 5[P]in,1, [P]in,2 = 2.5[P]in,1. | |
As the curves in Fig. 5a (spatially dependent) and Fig. 5b (time dependent) are very close and not deviating from each other we may assume an established diffusional boundary layer only depending on initial conditions. It is reasonable to use an approximate analytical solution which can be derived from the exact numerical solution. The terms containing (δD*)3 in the eqn (14) have an order of magnitude of at least 10−3 (taking all parameters from Fig. 5). They can be neglected, and the following analytical solution is derived:
| |  | (20) |
This derivation is in full agreement with the order-of-magnitude estimation presented in the work of Lok.
36 The analytical approximation of the diffusional boundary layer (A.S. in
Fig. 5a),
eqn (20), showed to be a good approximation to our numerical solution (
eqn (14)) under the constraint of our given experimental time when the mass transport rate still limits the adsorption rate. With the help of this analytical solution, the computation cost to estimate the unknown parameters (
Da and
n) can be reduced to just several seconds.
The numerical solution of the diffusional boundary layer (eqn (14)) has been applied to estimate model parameters of influenza virus nanoparticle adsorption successfully in ref. 41. As shown above, the analytical solution, eqn (20), is a good approximation to the numerical solution, eqn (14). Therefore, we predict that the model framework applying eqn (20) is going to be valid to estimate the parameters from the SPR experimental data as well. For validation, we take two experimental examples of the influenza virus particle adsorption into consideration. The results of the parameters newly estimated by the new model framework are shown together with the old parameters form the old framework with the numerical solution in Table 1. The values of both estimated parameter sets are very close for both experiments. It seems that our prediction about the suitability of the new model framework with the analytical solution of δD* to estimate the parameters is correct. In order to validate our prediction further, Fig. 6 shows the comparison of the simulated curves (lines) with the experimental data (symbols). The simulated curves are plotted employing the model framework with the analytical solution of δD*. They fit to the experimental data very closely for all three conditions. Moreover, Fig. 6 shows another important aspect of multivalent interaction. We show that the ratio of the concentration of the two interaction partners, bionanoparticles [P]in,3 or receptor at the surface [Rmax], play an important role in the model validation. The deviation from the initial ratio to a 1![[thin space (1/6-em)]](https://www.rsc.org/images/entities/char_2009.gif) :5 or to a 5:1 ratio leads to a different outcome. It seems that the decrease of the surface capacity decreases the amount of adsorbed bionanoparticles more than that of the bionanoparticle concentration in the solution. It might imply that, to consider the influences of two partners on the multivalent interaction, the influence from the side of the surface receptor could be stronger than the one from the other side. The reason may be that by a higher surface capacity, the nonspecific interaction can play a bigger role in the multivalent interaction. Hence, it seems wise to choose the design of the receptor surface as a starting point with regard to the process optimization of the multivalent interaction. With these validations, we are confident that the analytical solution of the diffusional boundary layer will work in our model framework. Hence, from now on all simulations will be done by using the analytical solution, eqn (20).
:5 or to a 5:1 ratio leads to a different outcome. It seems that the decrease of the surface capacity decreases the amount of adsorbed bionanoparticles more than that of the bionanoparticle concentration in the solution. It might imply that, to consider the influences of two partners on the multivalent interaction, the influence from the side of the surface receptor could be stronger than the one from the other side. The reason may be that by a higher surface capacity, the nonspecific interaction can play a bigger role in the multivalent interaction. Hence, it seems wise to choose the design of the receptor surface as a starting point with regard to the process optimization of the multivalent interaction. With these validations, we are confident that the analytical solution of the diffusional boundary layer will work in our model framework. Hence, from now on all simulations will be done by using the analytical solution, eqn (20).
Table 1 Estimated parameters by the model framework from the SPR experimental data
| |
Numerical41 |
Analytical |
|
n, — |
[P]in,1 |
413 |
388 |
| [P]in,2 |
330 |
328 |
|
k
a, M−1 s−1 |
[P]in,1 |
3.20 × 10⁶ |
2.96 × 10⁶ |
| [P]in,2 |
8.16 × 10⁵ |
8.10 × 10⁵ |
 |
| | Fig. 6 Comparison of the simulation curves with the experimental data. The simulation is performed by the model framework with the analytical solution of eqn (20). The experimental data were obtained in ref. 41. The parameters used in the simulation are the estimated parameters, ka and n, from Table 1 and the others from Fig. 5. [P]in,3 is the inlet concentration of the bionanoparticle solution. [Rmax] is the maximum concentration of receptors, namely the surface capacity. | |
As mentioned in the introduction, besides of the natural biological partners (e.g. the influenza virus) the model framework is also evaluated by using the synthetic multivalent interaction where the human IgG coated nanoparticles adsorb to the Protein A immobilized on the surface. One typical example for the synthetic case is shown in Fig. 7. The increase of the surface coverage in Fig. 7b (ref. the SPR data shown in the ESI†) verifies that human IgGs are attached to the nanoparticles. One can see that the model framework with the multi-site kinetic model (eqn (18)) can be fitted to the experimental data of the bionanoparticles very well. Looking back, in Fig. 1 we showed that the ligands are the functional elements of entity 1 interacting with entity 2. This implies that the interacting way of the ligands to the receptor surface can be either free without any scaffold or assembled by the scaffold. There should be entropy and enthalpy differences between the free ligands and the assembled ones, for example, the degree of the geometrical freedom. As a result, the adsorption kinetics of the free ligands at the receptor surface should be different from that of the ligands assembled by the nanoparticles. In order to display the difference of the adsorption kinetics between free ligands and assembled ones, with the flexibility of the synthetic system, the adsorption experiments are performed under the same experimental conditions.
 |
| | Fig. 7 Comparison of the simulated curves with the experimental data. (a) Adsorption of free ligands (human IgGs, Y) on the receptor surface. The Langmuir model, eqn (19), was used to estimate adsorption rate constant from the SPR experimental data: ka = 6.28 × 10⁴ M−1 S−1 by setting n = 1. (b) Adsorption of synthetic bionanoparticles (human IgG coated nanoparticles, NP–Y) on the receptor surface. The multi-site model, eqn (18), was used to estimate parameters for the synthetic bionanoparticles: ka = 3.72 × 10⁴ M−1 S−1 and n = 6275. The other parameters used in both simulations were [Rmax] = 1.56 × 10¹⁰ receptors per mm2, [P]in,Y = 9.15 × 10¹¹ particles per μl, DY = 0.389 × 10⁻¹² m2 s−1 as the diameter of 15 nm, [P]in,NP–Y = 3 × 10⁶ particles per μl, DNP–Y = 3.42 × 10⁻¹² m2 s−1 as the diameter of 143 nm. | |
In Section 2, we have shown that by setting the number of bonds n to 1, the multi-site model reduces to the classical Langmuir model (eqn (19)) which is used normally to analyze the adsorption kinetics of human IgG at the Protein A surface.48,49 As the experimental data in Fig. 7 show, the adsorption of the synthetic bionanoparticles is still not in a state of equilibrium (Fig. 7b) and the adsorption of the free human IgGs almost reaches the equilibrium level at the end of the experiment (Fig. 7a). It implies that, in the case of the free ligands, the adsorption rate is slow enough at a certain time point to be balanced by the desorption rate in the experimental process. So, based on the model of the adsorption rate in eqn (19), an additional desorption term should be added and the final equation appears similarly:
| |  | (21) |
where,
kd is the desorption rate constant. With the help of
eqn (21), the model framework is again used to estimate the parameters of the free ligand, and the simulated curve of the classical Langmuir model in
Fig. 7a is shown to fit to the experimental data well. Near the equilibrium there is a slight but acceptable derivation from the experimental data which may result from a nonspecific binding of proteins. It is clear that, with the help of the model framework, one can compare the adsorption kinetics of the free ligands with that of the synthetic bionanoparticles not only qualitatively but also quantitatively by comparing the characteristic parameters, namely the adsorption rate constant,
ka, and the number of the bonds
n. By comparing the values of
ka as shown in the caption of
Fig. 7, the adsorption of the free ligands is nearly two-fold faster than that of the synthetic bionanoparticles. Furthermore, according to the known number of bonds formed between single bionanoparticles and the receptor surface, the efficiency of the receptor surface would be displayed in terms of the coverage ratio of the adsorbed bionanoparticles at the receptor surface. Here one has to divide the number of the total bond ligands summed up from the amount of adsorbed bionanoparticles by the capacity of the receptor surface, [R
max]. As in the experimental case of the bionanoparticles in
Fig. 7b, the final surface coverage ratio is about 0.24 (see calculation details in ESI
†). With this information, it is possible to design a functionalized multivalent interaction in a more economical way. The parameter estimation elucidates that the size of the coated nanoparticle can influence the estimated result of
n because the size directly relates to the diameter and the molecular weight. The diameter is parameterized into the diffusivity,
D, in the model framework, and the molecular weight is involved in
eqn (3) as described in the ESI.
† It implies that, with possible experimental data, the relationship between the number of bonds and the size of the coated nanoparticle can be analyzed by estimating
n under the influence of the diameter and the influence of the molecular weight.
The number of bonds n, as seen in the illustration of Fig. 1, is estimated to have a large order of magnitude (some hundreds of bonds for the influenza virus41 or even thousands of bonds for the bionanoparticles here). With n ≫ 1, the multi-site kinetic model, eqn (18), can be reduced again by cancelling the power term of n:
| |  | (22) |
Eqn (22) displays an explicit relationship between the adsorption rate
r*(
X,
τ) and the dimensionless amount
θP,s(
X,
τ), namely
r*(
θP,s). Moreover, based on the reduced kinetic model (
eqn (22)), an approximate explicit solution for the concentration of adsorbed bionanoparticles at the receptor surface,
θP,s in
eqn (15), can be derived also as follows:
| |  | (23) |
The derivation details can be found in the section of the ESI.
† As the reductions are conducted practically on the basis of the experimental information, when the number of bonds
n ≫ 1, the reduced model equations can predict the adsorption behavior reasonably, such as the changing of the adsorption rate with the concentration of the adsorbed bionanoparticles at the receptor surface,
r*(
θP,s), by
eqn (22) and the adsorption equilibrium by
eqn (23). Although the reduced model equations are aimed for the prediction rather than the fitting, one may still argue how much the adsorption kinetics simulated by the model framework before and after the reduction deviate. As a demonstration of the suitability of the reduced model framework to predict certain adsorption behavior,
Fig. 8 illustrates the comparison of its simulated adsorption curves with those simulated by the model framework before the reductions (the same curves in
Fig. 6). The simulated adsorption curves after the reductions in each experimental case deviate from those before the reductions in the same way, which means that the reduced model framework is still able to differentiate each adsorption behavior in accordance with the particular experimental conditions. What is more, it could save us the experimental efforts, if only a general comparison of the relative quantity between different adsorption behaviors is purposed.
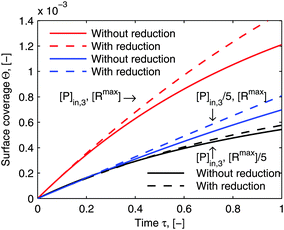 |
| | Fig. 8 Comparison of simulations by the model framework with and without reduction. The dashed curves are calculated by the model framework without reduction and are the same as in Fig. 6. The solid curves are calculated by the model framework with reduction with eqn (22) and (23). The parameters used in the simulation are the same as in Fig. 5 and 6. | |
In summary, the model framework with the multi-site kinetic model is evaluated to be valid to describe the multivalent interactions, not only of the natural partners but also of synthetic ones. Concerning the mass balances, we derive an analytical approximation (eqn (20)) to include the effects of the mass transport to the adsorption kinetics, which is verified to describe the diffusion rate of the bionanoparticles to the receptor surface properly. The model framework is shown to be able to estimate parameters, the number of bonds, n, and Damköhler number, Da, from the SPR experimental data. By handling the parameter n, the model framework is flexible enough to compare the estimated parameters of the mono-site adsorption interactions (n = 1) with the multi-site adsorption interactions (n > 1). Moreover, according to the information from the experimental data (n ≫ 1), the model framework can be further reduced into simplified model eqn (22) and (23) to predict the adsorption behavior which is probably difficult to be monitored by the experiments.
4.2. Simulating multivalent adsorption by model framework
As pointed out in the introduction, the influence of multi-valence on the adsorption behavior needs to be investigated in order to design the multivalent interacting system efficiently, to be either enhancing or inhibiting. To evaluate the influence of multi-valence, a contrast in the degree of the avidity among different valences in terms of ligands is already considered for the selectivity in the targeting process. However, another important criterion is the contrast in the amount of adsorbed bionanoparticles at the receptor surface, Θ, among different valences. This amount still is seldom evaluated quantitatively. In addition, it is also interesting to investigate this contrast because the measurement of the ligand density on the bionanoparticle surface after the coating process could be qualitatively achieved, which will be discussed in the following. In Fig. 9, a series of adsorption curves are simulated by varying the number of bonds, n (see Fig. 1), where all other parameters are kept constant. By changing these parameters according to different experimental conditions and varying the number of bonds, n likewise, a very similar pattern of the results is observed. So, although the results are simulated for one example only, all of the following discussions are applicable in a wide range.
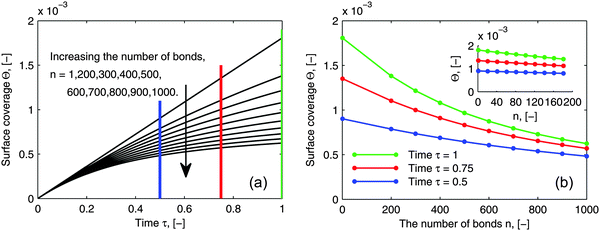 |
| | Fig. 9 Influence of the number of bonds on the adsorption behavior. (a) Dynamic growth of the adsorbed amount Θ under the influence of the number of bonds n. (b) Profiles of Θ as a function of the number of bonds n at certain time points τ taken from (a) where a clear distribution for 1 ≤ n ≤ 200 is displayed by the inset. The parameters used in the simulation were Da = 8, [P]in = 5 × 10⁶ particles per μl, [Rmax] = 1.19 × 10⁹ receptors per mm2, D = 3.7 × 10⁻¹² m2 s−1 as the diameter of 130 nm and the time was 6.5 minutes. | |
By comparing the adsorption curves in Fig. 9a, we show that with the increase in the number of bonds, the curves bend down accordingly. From a mathematical point of view, it means that the curvature of the adsorption curve relates to the number of bonds. We observe that the bigger the curvature appears, the higher the number of bonds is. This observation seems to be applicable for a general assessment of the bionanoparticle performance after the coating. As discussed above, the density of the ligands coated on the same type of the bionanoparticle surface can be qualitatively measured, because there is a linear relationship between the number of bonds and the curvature, if all other experimental conditions, especially the receptor density, are kept constant. Then, the adsorption curvature corresponding to each type of bionanoparticle like the one seen in Fig. 9a will reflect the density of ligands, and therefore inform the experimentalist which coating strategy would result in a high ligand density.
In Fig. 9b we show the surface coverage Θ as a function of the number of bonds, n, at selected time points τ (depicted as color lines in Fig. 9a). The value of τ = 1 corresponds to 390 seconds of an experimental measurement with the SPR system. One can see, that with the increase of the number of bonds, the adsorbed amount decreases (see the corresponding bending-down trend in Fig. 9a). The reason is that each individual bionanoparticle allocates a required number of bonds on the surface. As the capacity of the receptor surface [Rmax] is kept constant for all of the simulations, the amount of adsorbed nanoparticles naturally decreases with increasing the number of bonds. Moreover, the slope of the curves in Fig. 9b reflects the bending rate in Fig. 9a, and thereby a phenomenon is seen that the bending rate is larger when the number of bonds is smaller. In particular, for the number of bonds between 1 and 200 (see inset in Fig. 9b) an almost linear decrease of the adsorbed amount along with the increase of the number of bonds can be seen. This observation would be of interest for experimental design approaches targeting this relatively low multivalence situation between two biological partners. If this relative decrease in the amount of adsorbed bionanoparticles on a certain receptor surface would be detectable, the number of bonds could be predicted based on this linear relationship. It is also seen in Fig. 9b that if the adsorption time increases, as for example shown for τ = 0.5, τ = 0.75 to τ = 1, when the number of bonds is increased by the same value, the decreasing value of the surface coverage Θ becomes bigger.
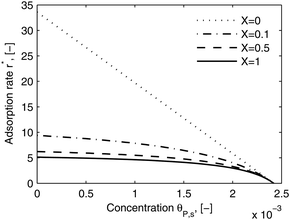
As shown in the last section, when the number of bonds is much bigger than one (n ≫ 1), the model equations can be further reduced to equations, eqn (22) and (23). Eqn (22) can be used to predict the changing behavior of the adsorption rate, r*, as a function of the concentration of the adsorbed bionanoparticles at the receptor surface, θP,s. One example is shown in Fig. 10. It is visible that r* decreases with an increasing θP,s, but these profiles are locally different. This is correlated with the enlargement in the thickness of the diffusional boundary layer, δD*. According to Fig. 5a, the diffusional boundary layer grows thicker as the solution flows into X direction. By comparing the r*-profiles at different X positions in Fig. 10, we conclude that along the flow direction r* decreases as δD* increases. Furthermore, r* decreases more quickly at the positions near the inlet (X = 0) than near the outlet (X = 1). Additionally, Fig. 10 shows that the local maximum adsorption rate, rmax*, exits at θP,s = 0. According to eqn (22), rmax*(X) = Da/(1 + DaδD*/3) while rmax*(X = 0) = Da (see eqn (20)). These two equations can be used to explain the physical phenomenon, namely that all space-dependent adsorption rates are maximal at the start of an experiment, τ = 0. Moreover, the global maximum adsorption rate is observed at the entrance point, X = 0. The local maximum concentration of adsorbed bionanoparticles, θP,s,max, appears when r* = 0, and its value can be estimated from the plots of θP,s by eqn (23), shown in Fig. 11.
 |
| | Fig. 10 Dimensionless adsorption rate r* versus adsorbed particle concentration θP,s. The curves were plotted by eqn (22) at four different locations, X. The parameters used in the simulation are Da = 33.6, n = 413, [P]in = 1 × 10⁶ particles per μl, [Rmax] = 1.19 × 10⁹ receptors per mm2, D = 3.76 × 10⁻¹² m2 s−1 with the bionanoparticle diameter of 130 nm and the experiment time of 6.5 minutes. | |
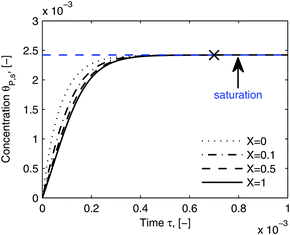 |
| | Fig. 11 Dynamic evolution of local virus concentration at the receptor surface. θP,s is simulated by eqn (23) at different locations, X in the flow channel. The parameters used in the simulation are the same as in Fig. 10, except an increase in time to 110 minutes. The cross shows the approximate starting point of the saturation period and the saturation value is marked by the blue line. | |
Fig. 11 shows that the local concentration of bionanoparticles adsorbed at the receptor surface (simulated by eqn (23)) is increasing over time until it saturates for a longer experimental time. The flat plateau happens, because the receptor surface is then saturated by the occupation of the adsorbed bionanoparticles, namely at the “saturation point” in Fig. 11. Although only the adsorption of the multivalent interaction is considered in the model framework, the saturation behavior can be used to predict the adsorption equilibrium. Especially, the time to reach the equilibrium can be estimated by the time to reach the saturation (see cross in Fig. 11). The equilibrium concentration can be estimated by the maximum concentration of adsorbed bionanoparticles, θP,s,max, under saturation conditions (see blue line in Fig. 11). From the example shown in Fig. 11, θP,s,max, is equal to 1/n (compare again to eqn (23)). Under the given conditions saturation is reached after about 4400 seconds (see cross in Fig. 11). These results provide options to analyze experimental data of similar SPR systems. For example, if θP,s,max would be experimentally determined, the number of bonds could approximately equal to 1/θP,s,max. Besides, the total amount of receptors required to reach equilibrium can be obtained by multiplying n with the total amount of bionanoparticles, Θ. This information could help to optimize an experimental design for the receptor surface. As observed from our SPR experiments, the equilibrium is difficult to achieve mainly due to the volume limit of the system. However, with the approximated saturation time from the model estimates, the equilibrium time could still be obtained for further investigations. For example, this information could be used to calculate the injection volume of the bionanoparticle solution for a given flow rate in order to reach the equilibrium.
5. Conclusions
A model framework with a multi-site kinetic model has been proposed to analyze the multi-valence interaction between two biological partners, namely bionanoparticles and receptor surface in a microfluidic SPR system. The system equations in the model framework have been built on the basis of the classical boundary layer theory and by using a multi-site kinetic model to describe the adsorption kinetics. Supplementing pure theoretical studies, we have built the model framework closely related to an experimental system so that key phenomena of the experiments can be interpreted by modeling parameters. In this way, extended simulations of the model framework do provide a more detailed knowledge of multivalent interactions, especially those concerning the bonds formed between two biological entities as illustrated in Fig. 1.
Multiple bonds between two biological partners are the intrinsic characteristics of the multivalent interaction. Accordingly, the number of bonds is an important parameter to any experimental design as well as to new model developments. Concerning the number of bonds, there are still only a few theoretical model studies, especially when related to experimental design issues. Particularly, calculations of the number of bonds formed naturally between two biological entities are rare. One true advantage of our model framework is its ability to estimate the number of bonds from experimental data. This estimate can provide important additional inherent information in order to analyze for example the specific system performance. Besides, our model framework is useful not only for natural bionanoparticles like virus particles, but also for function-oriented synthetic systems like antibody coated nanoparticles. Hence, it can serve as a design tool for the experimentalist in order to interpret the coverage of the receptor surface, to predict the adsorption behavior from model equations, or to simulate the adsorption kinetics according to specific key process parameters. A number of recent studies have varied such key parameters as flow rate, the size of bionanoparticles, the capacity of the receptor surface, or others. These studies can now be analyzed using the proposed model framework and from that, the number of bonds can be estimated. Here, we have shown that the presented interesting curvature of the adsorption curve is related to the number of the bonds. The obtained certain linear relationship between the adsorbed amount of the bionanoparticles at the receptor surface and the number of bonds could be a useful information for further interpretation.
One advantage of the proposed model framework is that it includes the influence of the mass transport on the adsorption kinetics in more detail. We have formulated a distributed equation of the thickness of the diffusional boundary layer in the flow direction, both numerically and analytically. The mass transport has been coupled to the adsorption rate not only time-dependent but also space-dependent. We find that in the flow direction, the increase in thickness of the diffusional boundary layer leads to a slower adsorption rate. Besides, the adsorption rate decreases more quickly at the entrance region than at the exit region. An analytical solution of the diffusional boundary layer, eqn (20), has been derived which is simpler than its numerical counterpart and still very useful to interpret the influence of mass transport.
Our model framework has a wide range of applications in view of the number of bonds considered. When the number of bonds equals to one, n = 1, the kinetic model becomes the classical Langmuir model, eqn (19). When the number of bonds is much bigger than one, n ≫ 1, reduced model equations can be obtained to predict the adsorption rate (eqn (22)) and the equilibrium (eqn (23)). The model framework has further applications to thermodynamic studies of multivalent interactions, because it can be linked to other important thermodynamic parameters, for example, the cooperativity,50 or the enhancement factor51 (ratio of two adsorption constants). Our model validation by experiments with synthetic bionanoparticles implies that this model framework could significantly help to analyze multivalent interactions at the nanoscale, like DNA, cells, and antibody-coated nanomedicine. Furthermore, our experiments and modeling with human IgG bionanoparticles show a potential impact for studies in various biological systems, like dynamic studies of bionanoparticle targeting in mixtures of human tumor cells.52 Hence, it is reasonable to argue that this work would also contribute to the study of nanoparticle related human antibody application.
Acknowledgements
The first author is also affiliated to the “International Max Planck Research School for Advanced Methods in Process and Systems Engineering” in Magdeburg.
References
- B. B. Minsky, C. H. Antoni and H. Boehm, Sci. Rep., 2016, 6, 21608, DOI:10.1038/srep21608.
- H. C. S. Chenette and S. M. Husson, J. Appl. Polym. Sci., 2015, 132, 41437, DOI:10.1002/app.41437.
- L. M. Wang and C. Y. Chen, Toxicol. Appl. Pharmacol., 2016, 299, 30–40 CrossRef CAS PubMed.
- L. Opitz, J. Salaklang, H. Buttner, U. Reichl and M. W. Wolff, Vaccine, 2007, 25, 939–947 CrossRef CAS PubMed.
- M. W. Wolff and U. Reichl, Chem. Eng. Technol., 2008, 31, 846–857 CrossRef CAS.
- L. Opitz, S. Lehmann, U. Reichl and M. W. Wolff, Biotechnol. Bioeng., 2009, 103, 1144–1154 CrossRef CAS PubMed.
- H. Yamada, S. Nagase, K. Takahashi, Y. Sakoda, H. Kida and S. Okamoto, Antiviral Res., 2016, 129, 81–92 CrossRef CAS PubMed.
- T. Matsubara, A. Onishi, D. Yamaguchi and T. Sato, Bioorg. Med. Chem., 2016, 24, 1106–1114 CrossRef CAS PubMed.
- S. R. Kumar, M. Paulpandi, M. ManivelRaja, D. Mangalaraj, C. Viswanathan, S. Kannan and N. Ponpandian, RSC Adv., 2014, 4, 13409–13418 RSC.
- M. Howard, B. J. Zern, A. C. Anselmo, V. V. Shuvaev, S. Mitragotri and V. Muzykantov, ACS Nano, 2014, 8, 4100–4132 CrossRef CAS PubMed.
- E. I. Matthaiou, J. Barar, R. Sandaltzopoulos, C. Li, G. Coukos and Y. Omidi, Int. J. Nanomed., 2014, 9, 1855–1870 Search PubMed.
- M. Bally, A. Gunnarsson, L. Svensson, G. Larson, V. P. Zhdanov and F. Hook, Phys. Rev. Lett., 2011, 107, 188103, DOI:10.1103/PhysRevLett.107.188103.
- A. Zeltins, Mol. Biotechnol., 2013, 53, 92–107 CrossRef CAS PubMed.
- E. Mahon, A. Salvati, F. B. Bombelli, I. Lynch and K. A. Dawson, J. Controlled Release, 2012, 161, 164–174 CrossRef CAS PubMed.
- A. A. Shemetov, I. Nabiev and A. Sukhanova, ACS Nano, 2012, 6, 4585–4602 CrossRef CAS PubMed.
- S. Barua, J. W. Yoo, P. Kolhar, A. Wakankar, Y. R. Gokarn and S. Mitragotri, Proc. Natl. Acad. Sci. U. S. A., 2013, 110, 3270–3275 CrossRef CAS PubMed.
- S. L. Zhang, J. Li, G. Lykotrafitis, G. Bao and S. Suresh, Adv. Mater., 2009, 21, 419–424 CrossRef CAS PubMed.
- W. Jiang, B. Y. S. Kim, J. T. Rutka and W. C. W. Chan, Nat. Nanotechnol., 2008, 3, 145–150 CrossRef CAS PubMed.
- C. C. Chen and E. E. Dormidontova, Langmuir, 2005, 21, 5605–5615 CrossRef CAS PubMed.
- V. M. Krishnamurthy, V. Semetey, P. J. Bracher, N. Shen and G. M. Whitesides, J. Am. Chem. Soc., 2007, 129, 1312–1320 CrossRef CAS PubMed.
- A. Salvati, A. S. Pitek, M. P. Monopoli, K. Prapainop, F. B. Bombelli, D. R. Hristov, P. M. Kelly, C. Aberg, E. Mahon and K. A. Dawson, Nat. Nanotechnol., 2013, 8, 137–143 CrossRef CAS PubMed.
- I. D. Kuntz, K. Chen, K. A. Sharp and P. A. Kollman, Proc. Natl. Acad. Sci. U. S. A., 1999, 96, 9997–10002 CrossRef CAS.
- D. G. Mullen, M. Fang, A. Desai, J. R. Baker, B. G. Orr and M. M. B. Holl, ACS Nano, 2010, 4, 657–670 CrossRef CAS PubMed.
- S. H. Wang and E. E. Dormidontova, Soft Matter, 2011, 7, 4435–4445 RSC.
- F. J. Martinez-Veracoechea and D. Frenkel, Proc. Natl. Acad. Sci. U. S. A., 2011, 108, 10963–10968 CrossRef CAS PubMed.
- S. Hong, P. R. Leroueil, I. J. Majoros, B. G. Orr, J. R. Baker, Jr. and M. M. Banaszak Holl, Chem. Biol., 2007, 14, 107–115 CrossRef CAS PubMed.
- M. H. Li, S. K. Choi, P. R. Leroueil and J. R. Baker, ACS Nano, 2014, 8, 5600–5609 CrossRef CAS PubMed.
-
N. J. de Mol and M. J. E. Fischer, in Surface Plasmon Resonance: Methods and Protocols, ed. N. J. DeMol and M. J. E. Fischer, Humana Press Inc., Totowa, 2010, vol. 627, pp. 1–14 Search PubMed.
- K. M. Müller, K. M. Arndt and A. Plückthun, Anal. Biochem., 1998, 261, 149–158 CrossRef PubMed.
- C. Tassa, J. L. Duffner, T. A. Lewis, R. Weissleder, S. L. Schreiber, A. N. Koehler and S. Y. Shaw, Bioconjugate Chem., 2010, 21, 14–19 CrossRef CAS PubMed.
- V. Lo Schiavo, P. Robert, L. Limozin and P. Bongrand, PLoS One, 2012, 7, e44070 CAS.
- T. Chou and M. R. D'Orsogna, J. Chem. Phys., 2007, 127, 105101, DOI:10.1063/1.2764053.
- M. A. van Dongen, J. E. Silpe, C. A. Dougherty, A. K. Kanduluru, S. K. Choi, B. G. Orr, P. S. Low and M. M. Banaszak Holl, Mol. Pharmaceutics, 2014, 11, 1696–1706 CrossRef CAS PubMed.
- D. G. Myszka, Curr. Opin. Biotechnol., 1997, 8, 50–57 CrossRef CAS PubMed.
- P. Schuck and H. Zhao, Methods Mol. Biol., 2010, 627, 15–54 CAS.
- B. K. Lok, Y. L. Cheng and C. R. Robertson, J. Colloid Interface Sci., 1983, 91, 104–116 CrossRef CAS.
- D. G. Myszka, X. He, M. Dembo, T. A. Morton and B. Goldstein, Biophys. J., 1998, 75, 583–594 CrossRef CAS PubMed.
- R. Karlsson, A. Michaelsson and L. Mattsson, J. Immunol. Methods, 1991, 145, 229–240 CrossRef CAS PubMed.
- P. R. Edwards and R. J. Leatherbarrow, Anal. Biochem., 1997, 246, 1–6 CrossRef CAS PubMed.
- R. W. Glaser, Anal. Biochem., 1993, 213, 152–161 CrossRef CAS PubMed.
- W. Wang, M. W. Wolff, U. Reichl and K. Sundmacher, J. Chromatogr. A, 2014, 1326, 125–129 CrossRef CAS PubMed.
- L. Yang, M. E. Biswas and P. Chen, Biophys. J., 2003, 84, 509–522 CrossRef CAS PubMed.
- W. Wang, A. Voigt, M. W. Wolff, U. Reichl and K. Sundmacher, Anal. Biochem., 2016, 505, 8–17 CrossRef CAS PubMed.
- C. Sieben, C. Kappel, R. Zhu, A. Wozniak, C. Rankl, P. Hinterdorfer, H. Grubmuller and A. Herrmann, Proc. Natl. Acad. Sci. U. S. A., 2012, 109, 13626–13631 CrossRef CAS PubMed.
-
K. A. Dill and S. Bromberg, Molecular Driving Forces: Statistical Thermodynamics in Chemistry and Biology, Garland Science, New York and London, 2003 Search PubMed.
-
R. B. Bird, W. E. Stewart and E. N. Lightfoot, Transport phenomena, J. Wiley, New York, 2nd edn, 2002 Search PubMed.
- B. Goldstein, D. Coombs, X. Y. He, A. R. Pineda and C. Wofsy, J. Mol. Recognit., 1999, 12, 293–299 CrossRef CAS PubMed.
- K. Saha, F. Bender and E. Gizeli, Anal. Chem., 2003, 75, 835–842 CrossRef CAS PubMed.
- R. Hahn, R. Schlegel and A. Jungbauer, J. Chromatogr. B: Anal. Technol. Biomed. Life Sci., 2003, 790, 35–51 CrossRef CAS.
- M. Mammen, S. K. Choi and G. M. Whitesides, Angew. Chem., Int. Ed., 1998, 37, 2755–2794 CrossRef CAS.
- C. Fasting, C. A. Schalley, M. Weber, O. Seitz, S. Hecht, B. Koksch, J. Dernedde, C. Graf, E. W. Knapp and R. Haag, Angew. Chem., Int. Ed. Engl., 2012, 51, 10472–10498 CrossRef CAS PubMed.
- S. Rollié, U. Lendeckel, M. Naumann, U. Reichl and K. Sundmacher, Soft Matter, 2010, 6, 1203 RSC.
Footnote |
| † Electronic supplementary information (ESI) available. See DOI: 10.1039/c6sm00995f |
|
| This journal is © The Royal Society of Chemistry 2016 |

 Open Access Article
 This Open Access Article is licensed under a Creative Commons Attribution-Non Commercial 3.0 Unported Licence


 and vy(x,y) = 0. As illustrated in Fig. 4, in the entrance region (0 < x < le), the flow profiles are developing until the boundary layers meet in the middle of the channel. Within the entrance region, the velocity profile is approximated by the following functions:


 is the average velocity and v is the kinematic viscosity.


 , eqn (7) can be reformulated as follows:
 stands for the Peclet number and δD is the thickness of the diffusional boundary layer. From eqn (8) it is concluded that, due to the fact that l/δD ≫ 1, the diffusional transport of virus particles in y-direction is dominant, i.e. the diffusional transport in x-direction is negligible. Furthermore, the importance of the accumulation term of eqn (8) depends on the ratio of the residence time, tr, to the characteristic time constant of the adsorption, ta. The residence time of the nanoparticle solution in the flow cell is
  . The characteristic adsorption time can be estimated from the experimental observations and is in the order of ta = 100 s. The ratio of characteristic time constants is therefore tr/ta ≪ 1. Thus, the accumulation term in eqn (8) is several orders of magnitude smaller than the convective transport term. Consequently, as we are interested to analyze experimental SPR data on the time scale of ta = 100 s, the following simplified mass balance of the bionanoparticles in the liquid solution is applied:


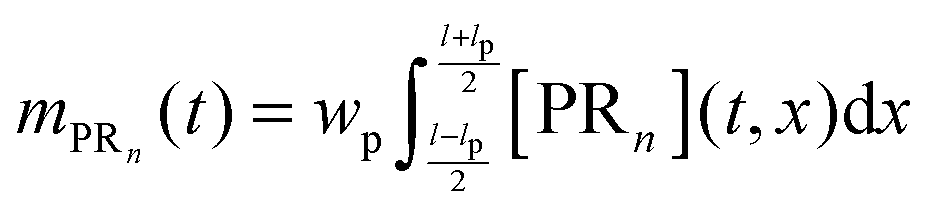 . mPRn(t) is the output quantity which is fitted to the SPR experimental data with the dimensionless quantity of Θ = mPRn/([Rmax]lpwp). The parameter estimation of Da and n is implemented by the least squares fitting based on the Gauß–Newton method. The calculation details of the equations are included in the ESI.†


